
East Devon is a local government district in Devon, England. Its council is based in the town of Honiton, although Exmouth is the largest town. The district also contains the towns of Axminster, Budleigh Salterton, Cranbrook, Ottery St Mary, Seaton and Sidmouth, along with numerous villages and surrounding rural areas.

East Devon is a constituency represented in the House of Commons of the UK Parliament since 2019 by Simon Jupp of the Conservative Party.
Cannock Chase District Council elections are held three years out of every four, with a third of the council elected each time. Cannock Chase District Council is the local authority for the non-metropolitan district of Cannock Chase in Staffordshire, England. Since the last boundary changes in 2002, 41 councillors have been elected from 15 wards.
The 2012 North Hertfordshire Council election was held on 3 May 2012, at the same time as other local elections across England, Scotland and Wales. Of the 49 seats on North Hertfordshire District Council, 15 were up for election.
The East Devon Alliance, also known as the Independent East Devon Alliance, was registered as a political party in East Devon at the Electoral Commission in 2015.

The 2018 Huntingdonshire District Council election took place on 3 May 2018 to elect members of Huntingdonshire District Council in England. This was on the same day as other local elections.
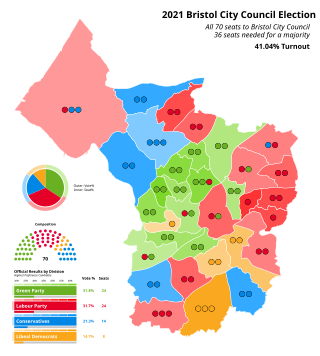
The 2021 Bristol City Council election took place on 6 May 2021 to elect members of Bristol City Council in England. It coincided with nationwide local elections. Voters in the city also voted for the mayor of Bristol, the mayor of the West of England and for Avon and Somerset's police and crime commissioner. The election was originally due to take place in May 2020, but was postponed due to the COVID-19 pandemic.
Claire Wright is a British politician. She was a Devon county councillor from 2013 to 2021 and stood as an independent for East Devon in the 2015, 2017, and 2019 United Kingdom general elections, coming second each time.
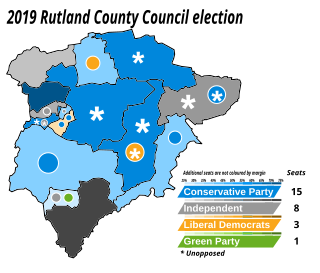
The 2019 Rutland County Council election took place on 2 May 2019 to elect members of Rutland County Council in England. This was on the same day as other local elections. New boundaries were used in this election and the number of councillors increased from 26 to 27.
The 2019 East Lindsey District Council election took place on 2 May 2019 to elect all members of East Lindsey District Council in England. The Conservatives retained overall control of the council.

The 2022 Islington London Borough Council election took place on 5 May 2022. All 51 members of Islington London Borough Council were to be elected. The elections took place alongside local elections in the other London boroughs and elections to local authorities across the United Kingdom.

The 2022 Exeter City Council election took place on 5 May 2022 to elect members to Exeter City Council in Devon, England. This was the same day as other local elections in the United Kingdom. 17 of the 39 seats were up for election, one councillor in each of the 13 wards, and 4 by-elections. These wards were last contested in 2018.

The 2023 Colchester City Council election took place on 4 May 2023 to elect members of Colchester City Council in Essex, England. This was on the same day as other local elections across England. There were 17 of the 51 seats on the council up for election, being the usual third of the council, with one seat available for each ward. This set of seats were last contested at the 2019 election.
Honiton and Sidmouth is a proposed constituency of the House of Commons in the UK Parliament. Further to the completion of the 2023 Periodic Review of Westminster constituencies, it will first be contested at the next general election.
The 2023 West Devon Borough Council election took place on 4 May 2023, to elect members of West Devon Borough Council in England. This was on the same day as other local elections across England. The election for Burrator ward was delayed until 15 June 2023 following the death of one of the original candidates.

The 2023 East Devon District Council election took place on 4 May 2023 to elect all 60 members of East Devon District Council in Devon, England. This was on the same day as other local elections across England.
Exmouth and Exeter East is a proposed constituency of the House of Commons in the UK Parliament. Further to the completion of the 2023 Periodic Review of Westminster constituencies, it will first be contested at the next general election.
