| |||||||||||||||||||||||||||||
All 39 seats to Exeter City Council 20 seats needed for a majority | |||||||||||||||||||||||||||||
---|---|---|---|---|---|---|---|---|---|---|---|---|---|---|---|---|---|---|---|---|---|---|---|---|---|---|---|---|---|
Turnout | 39.14% | ||||||||||||||||||||||||||||
| |||||||||||||||||||||||||||||
![]() Map showing the results of the 2016 Exeter City Council elections by ward. Red shows Labour seats, blue shows the Conservatives, and yellow shows the Liberal Democrats. Striped wards indicate seats shared between parties. | |||||||||||||||||||||||||||||
|
The 2016 Exeter City Council election took place on 5 May 2016, to elect members of Exeter City Council in England. [2] Following boundary changes, the entire council was up for election, and all 13 wards were contested, each electing three councillors. The election was held concurrently with other local elections held in England on the 5 May.
The council had been controlled by the Labour Party since 1990, which had held an outright majority since 2012. Labour won the Exeter election, extending their control to 30 seats, their highest ever share of the vote. The Conservatives came in second place with eight seats, losing four to Labour, while the Liberal Democrats won a single seat.
The election for the Devon and Cornwall Police and Crime Commissioner was also scheduled for the 5 May. Voters in Exeter would cast a separate ballot for the office, in conjunction with the residents of the rest of the Devon and Cornwall police area.
The elections to Exeter City Council were the first to be held since the Local Government Boundary Commission for England conducted a review into the electoral arrangements in Exeter. The review was prompted by the previous council that had a high level of electoral inequality, with some councillors representing many more voters than others. [3] The old council consisted of 40 councillors from 18 wards, each of two or three councillors, which were elected by thirds over a four-year cycle, with elections to Devon County Council on the fourth year. This resulted in some wards having elections every year, while others would have one year in the cycle with no elections. The review resulted in the number of councillors being reduced to 39 and the number of wards reduced to 13, with each ward returning three councillors. [4] The ward changes equalised the ratio of voters to councillors, and provided for the entire city being able to vote in local elections every year. [3]
As a result of the review, for 2016 all seats on the council were up for election. The election used the plurality-at-large voting system; each voter was able to cast up to three votes, with the three candidates with the highest number of votes being elected. [5] As the council would revert to electing by thirds in 2018, a number of councillors would serve partial terms in the interim. In each ward, the councillor who received the highest number of votes would serve a four-year term, the councillor with the second highest number a three-year term, and the councillor with the third-highest votes would have a two-year term. [5] In future elections, each councillor would serve a full four-year term.
Before 5 May 2016 the council was controlled by the Labour Party which had held a majority on the council since the 2012 election, and had traditionally been the largest party in the city. [6] After the previous election, which was held in 2015 for a third of the councillors, the council consisted of 29 Labour members, 10 Conservatives, and one Liberal Democrat. [7]
A total of 138 candidates stood for election across the city. Four parties stood in every ward in the city, with both the Labour and Conservative parties putting up candidates for all 39 seats. The Green Party had the next highest number of candidates with 27, and the Liberal Democrats stood 20 candidates across the city. The UK Independence Party had 12 candidates standing in nine wards, and one person represented the Independence from Europe party. [8]
The Labour Party were standing on their record in office and their key redevelopment plans for the former bus station, which would include the St Sidwell's Point leisure complex in the centre of the city. [9] Labour also aimed to reduce traffic congestion, add a food waste collection, and reduce homelessness and the lack of affordable housing. The Conservatives campaigned against the St Sidwell's Point project on cost grounds, instead promising to invest in affordable housing, cultural venues, and producing a new transport plan for Exeter. [9] The party aimed to improve on its low number of seats on the council. The Liberal Democrats planned to rebuild their former presence in Exeter, focusing on improving the quality of public services. The Green Party proposed a more environmentally sound city, focusing on improving the quality of life for residents, a sustainable development plan, and reducing waste from the city. They also planned to make the council more democratic and accountable to the people of Exeter. [9] UKIP had a national plan for local councils, which included devolution of power to local authorities, attempting to end funding and projects from the European Union and prioritising locals in service provision. [9]
The election was won by the Labour Party, who won 30 of the 39 seats on the council. The Conservative Party came second, winning eight seats, and the Liberal Democrats had one councillor elected. [10] The overall turnout was 39.14%. Labour extended its majority to 10 councillors – the party's largest ever majority on the council – by gaining three seats from the Conservatives. [11] Labour won all three seats in eight wards, and won at least one seat in every ward except the suburban Topsham, won by the Conservatives. The Conservatives also won five other seats across the city. One ward, Duryard & St James, was split three ways between the parties. [11]
2016 Exeter City Council election | ||||||||||
---|---|---|---|---|---|---|---|---|---|---|
Party | This election | Full council | This election | |||||||
Seats | Net | Seats % | Other | Total | Total % | Votes | Votes % | +/− | ||
Labour | 30 | ![]() | 76.9 | 0 | 30 | 76.9 | 43,905 | 47.5 | +11.1 | |
Conservative | 8 | ![]() | 20.5 | 0 | 8 | 20.5 | 26,797 | 29.0 | -4.1 | |
Liberal Democrats | 1 | ![]() | 2.6 | 0 | 1 | 2.6 | 8,629 | 9.3 | -1.5 | |
Green | 0 | ![]() | 0.0 | 0 | 0 | 0.0 | 8,868 | 9.6 | +0.3 | |
UKIP | 0 | ![]() | 0.0 | 0 | 0 | 0.0 | 4,036 | 4.4 | -5.6 | |
Independence from Europe | 0 | ![]() | 0.0 | 0 | 0 | 0.0 | 104 | 0.1 | New | |
An asterisk (*) denotes an incumbent councillor seeking re-election.
Party | Candidate | Votes | % | |
---|---|---|---|---|
Labour | Steve Warwick | 1,096 | 41.0 | |
Labour | Chris Musgrave | 1,063 | 39.8 | |
Labour | Bob Foale | 1,044 | 39.1 | |
Conservative | John Harvey* | 982 | 36.8 | |
Conservative | Emily Croft | 807 | 30.2 | |
Conservative | Aric Gilinsky | 669 | 25.0 | |
UKIP | Robert Ball | 349 | 13.1 | |
UKIP | Dutch Dudgeon | 331 | 12.4 | |
Liberal Democrats | Rod Ruffle | 312 | 11.7 | |
Green | Andrew Wallace Bell | 259 | 9.7 | |
Green | Audaye Khalid Elesedy | 157 | 5.9 | |
Green | Isabel Castle | 154 | 5.8 | |
Registered electors | 6,375 | |||
Turnout | 2,672 | 41.91% |
Party | Candidate | Votes | % | |
---|---|---|---|---|
Labour | Keith Owen* | 851 | 34.9 | |
Conservative | Percy Prowse* | 773 | 31.7 | |
Liberal Democrats | Kevin John Mitchell | 770 | 31.5 | |
Labour | Tristan Charles Leonard Harris | 720 | 29.5 | |
Labour | Robin Edward William Hughes-Chamberlain | 674 | 27.6 | |
Conservative | Richard William Elliott | 601 | 24.6 | |
Liberal Democrats | Michael Norman Mitchell | 583 | 23.9 | |
Conservative | Lee William Mottram* | 561 | 23.0 | |
Liberal Democrats | Nicholas George Sutton | 458 | 18.8 | |
Green | Bethany Payne | 303 | 12.4 | |
Green | Rouben Scott Freeman | 253 | 10.4 | |
Green | Jenny Steer | 245 | 10.0 | |
UKIP | Sallie Cherie Waters | 141 | 5.8 | |
Registered electors | 6,848 | |||
Turnout | 2,441 | 35.65% |
Party | Candidate | Votes | % | |
---|---|---|---|---|
Labour | Philip Michael Bialyk* | 1,362 | 57.6 | |
Labour | Ollie Pearson* | 1,277 | 54.0 | |
Labour | Rachel Helen Sutton* | 1,245 | 52.7 | |
UKIP | Lawrence Simon Harper | 473 | 20.0 | |
Conservative | Steve Hawkins | 462 | 19.6 | |
Conservative | Benjamin Tomos Lewis | 394 | 16.7 | |
Conservative | Patricia White | 362 | 15.3 | |
Green | Stephen Leslie Porter | 309 | 13.1 | |
Liberal Democrats | Caroline Emily Gwyneth Nottle | 268 | 11.3 | |
Registered electors | 7,197 | |||
Turnout | 2,363 | 32.83% |
Party | Candidate | Votes | % | |
---|---|---|---|---|
Labour | Olwen Margaret Foggin* | 1,677 | 55.3 | |
Labour | Rosie Clare Denham* | 1,653 | 54.6 | |
Labour | Greg Sheldon* | 1,394 | 46.0 | |
Conservative | Guy Steven Frank Richards | 620 | 20.5 | |
Green | Gill Baker | 607 | 20.0 | |
Conservative | Azhar-Jamal Chaudhry | 560 | 18.5 | |
Conservative | Sam Morfey | 558 | 18.4 | |
UKIP | Diana Beasley | 336 | 11.1 | |
Liberal Democrats | Sheila Muriel Hobden | 305 | 10.1 | |
Green | Steve Jones | 297 | 9.8 | |
Green | Rob Davies | 262 | 8.6 | |
Registered electors | 6,783 | |||
Turnout | 3,030 | 44.67% |
Party | Candidate | Votes | % | |
---|---|---|---|---|
Labour | Emma Anita Morse* | 1,337 | 55.8 | |
Labour | Peter William Edwards* | 1,209 | 50.5 | |
Labour | Stephen Alexander Brimble* | 1,183 | 49.4 | |
UKIP | Alison Jane Sheridan | 472 | 19.7 | |
UKIP | Anne Patricia Back | 418 | 17.5 | |
Conservative | David Thompson | 397 | 16.6 | |
Conservative | George Thomas Livesey | 372 | 15.5 | |
UKIP | Eddie Higgins | 367 | 15.3 | |
Conservative | Paul Robert Geoffrey Rota | 339 | 14.2 | |
Green | Bridget Catherine Oliver | 218 | 9.1 | |
Liberal Democrats | Andrew Matthew Soper | 167 | 7.0 | |
Registered electors | 6,688 | |||
Turnout | 2,394 | 35.80% |
Party | Candidate | Votes | % | |
---|---|---|---|---|
Labour | Richard Arthur Branston* | 1,725 | 57.0 | |
Labour | Natalie Jane Vizard* | 1,562 | 51.6 | |
Labour | Roger David Spackman* | 1,448 | 47.8 | |
Conservative | Norman Shiel | 816 | 26.9 | |
Conservative | John Murphy | 755 | 24.9 | |
Conservative | Stephanie Warner | 676 | 22.3 | |
Green | Tom Milburn | 416 | 13.7 | |
Green | Andrew Cheesewright | 371 | 12.3 | |
Green | Joe Powell | 276 | 9.1 | |
Liberal Democrats | James Landymore | 244 | 8.1 | |
UKIP | Jacqueline Barbara Holdstock | 172 | 5.7 | |
Independence from Europe | Dave Smith | 104 | 3.4 | |
Registered electors | 6,893 | |||
Turnout | 3,028 | 43.93% |
Party | Candidate | Votes | % | |
---|---|---|---|---|
Labour | Rachel Clare Lyons* | 1,307 | 41.3 | |
Labour | Daniel Ryan Gottschalk | 1,254 | 39.6 | |
Conservative | Peter Holland* | 1,196 | 37.8 | |
Labour | Christine Elizabeth Raybould-Gooding | 1,146 | 36.2 | |
Conservative | Alan Jones | 1,094 | 34.6 | |
Conservative | Anne Jobson | 1,092 | 34.5 | |
Green | Lizzie Woodman | 538 | 17.0 | |
Green | David Barker-Hahlo | 450 | 14.2 | |
Green | Alysa Freeman | 409 | 12.9 | |
Liberal Democrats | Kimberley Lauren Stansfield | 309 | 9.8 | |
Registered electors | 7,514 | |||
Turnout | 3,166 | 42.13% |
Party | Candidate | Votes | % | |
---|---|---|---|---|
Labour | David James Harvey | 1,046 | 45.5 | |
Conservative | Cynthia Thompson | 981 | 42.7 | |
Labour | Duncan Wood | 953 | 41.4 | |
Conservative | Ruth Smith | 926 | 40.3 | |
Conservative | John Rogers | 894 | 38.9 | |
Labour | Laura Charis Adelaide Wright | 869 | 37.8 | |
Green | Diana Patricia Jones | 224 | 9.7 | |
Liberal Democrats | Mike Payne | 163 | 7.1 | |
Registered electors | 5,052 | |||
Turnout | 2,300 | 45.53% |
Party | Candidate | Votes | % | |
---|---|---|---|---|
Labour | Kate Hannan* | 1,372 | 56.5 | |
Labour | Lesley Sara Robson* | 1,207 | 49.7 | |
Labour | Tony Wardle* | 1,141 | 47.0 | |
Conservative | Lucille Baker | 601 | 24.8 | |
Conservative | Nicola Guagliardo | 537 | 22.1 | |
Conservative | Mario Trabucco | 517 | 21.3 | |
UKIP | Robert James Sheridan | 337 | 13.9 | |
Green | Lynn Susan Wetenhall | 301 | 12.4 | |
Liberal Democrats | Ellen McDonnell | 215 | 8.9 | |
Registered electors | 6,256 | |||
Turnout | 2,428 | 38.81% |
Party | Candidate | Votes | % | |
---|---|---|---|---|
Labour | Robert Lamb | 1,063 | 40.3 | |
Labour | Lewis Peter Griffiths Keen | 1,002 | 38.0 | |
Labour | Luke Sean Sills | 875 | 33.2 | |
Liberal Democrats | Stella Rose Brock* | 768 | 29.1 | |
Green | Diana Frances Moore | 655 | 24.8 | |
Liberal Democrats | Philip John Brock | 612 | 23.2 | |
Liberal Democrats | Kevin Martin Chun | 526 | 19.9 | |
Conservative | Catherine Pierce | 473 | 17.9 | |
Conservative | Louis Ten-Holter | 453 | 17.2 | |
Conservative | Jeremy White | 438 | 16.6 | |
Green | Kay Powell | 413 | 15.7 | |
Green | Mark Shorto | 321 | 12.2 | |
Registered electors | 6,981 | |||
Turnout | 2,637 | 37.77% |
Party | Candidate | Votes | % | |
---|---|---|---|---|
Conservative | David John Henson* | 923 | 44.7 | |
Conservative | Yolonda Anne Cullis Henson | 901 | 43.6 | |
Labour | Rose Leinwen Ashford | 692 | 33.5 | |
Conservative | James Ali Taghdissian | 616 | 29.8 | |
Labour | Calum Gabriel John Craig | 581 | 28.1 | |
Labour | David Charles Coughlin | 549 | 26.6 | |
UKIP | Valerie Angus | 333 | 16.1 | |
Green | Ben Head | 306 | 14.8 | |
Liberal Democrats | David William Roberts | 304 | 14.7 | |
Registered electors | 6,597 | |||
Turnout | 2,066 | 31.32% |
Party | Candidate | Votes | % | |
---|---|---|---|---|
Labour | Rob Hannaford* | 1,502 | 49.8 | |
Labour | Hannah Louise Packham* | 1,314 | 43.6 | |
Labour | Paul David Bull* | 1,219 | 40.4 | |
Liberal Democrats | Adrian Alan Fullam | 978 | 32.4 | |
Liberal Democrats | Vanessa Newcombe | 730 | 24.2 | |
Liberal Democrats | Sandy Chenore | 670 | 22.2 | |
Conservative | Charles Arthur Michael Beaty | 383 | 12.7 | |
UKIP | Brian Jeffrey | 307 | 10.2 | |
Green | Samuel Charles Bolitho | 260 | 8.6 | |
Conservative | Elliott Latif Malik | 258 | 8.6 | |
Green | Joe Levy | 241 | 8.0 | |
Conservative | Nabila Roukhamieh-Mckinna | 210 | 7.0 | |
Green | Cheryl Jacqueline Freeman | 203 | 6.7 | |
Registered electors | 7,329 | |||
Turnout | 3,017 | 41.17% |
Party | Candidate | Votes | % | |
---|---|---|---|---|
Conservative | Andrew Robert Leadbetter* | 1,277 | 52.1 | |
Conservative | Rob Newby* | 1,188 | 48.4 | |
Conservative | Margaret Anne Baldwin* | 1,135 | 46.3 | |
Labour | Eliot Paul Wright | 882 | 36.0 | |
Labour | Elizabeth Oxburgh | 736 | 30.0 | |
Labour | Tom Stephenson | 635 | 25.9 | |
Green | John Moreman | 420 | 17.1 | |
Liberal Democrats | William Vasey | 247 | 10.1 | |
Registered electors | 6,334 | |||
Turnout | 2,453 | 38.73% |
Sketty is the name of an electoral ward in the City and County of Swansea, Wales, UK. The electoral ward is coterminous with the community.
Elections to Slough Borough Council were held on 4 May 2006. One third of the council was up for election. This was the 121st Slough general local authority election since Slough became a local government unit in 1863.
Elections to the Borough Council in Slough, England, were held on 3 May 2007. One third of the council was up for election. This was the 122nd Slough general local authority election since Slough became a local government unit in 1863.
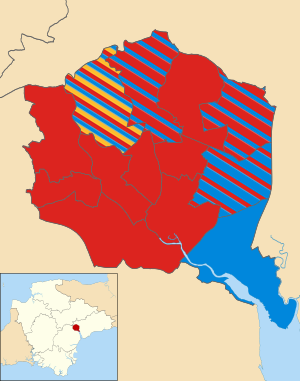
The 2011 council elections in Guildford saw the Conservatives retain control over Guildford Borough Council with an increased majority of 20 seats. Full results for each ward can be found at Guildford Council election, full results, 2011.
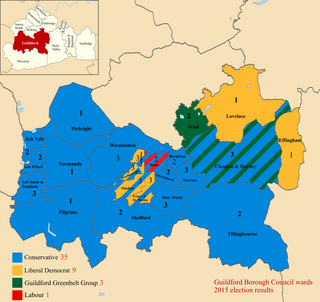
The 2015 Guildford Borough Council election took place on 7 May 2015 to elect members of Guildford Borough Council in England as one of the 2015 local elections, held simultaneously with the General Election.
Elections to Colchester Borough Council took place on 5 May 2016. Colchester Borough Council normally elects one third of its councillors each year, however, due to boundary changes, the whole council is up for election.
The 2016 Bristol City Council election took place on Thursday 5 May 2016, alongside nationwide local elections. Following a boundary review, the number of wards in the city was reduced to 34, with each electing one, two or three Councillors. The overall number of Councillors remained 70, with all seats up for election at the same time. Elections would then be held every 4 years.
The 2016 Woking Borough Council election took place on 5 May 2016 to elect members of Woking Borough Council in England. This was on the same day as other elections across the UK and the Police and Crime Commissioner election for Surrey Police.
The 2017 Cardiff Council election was held on 4 May 2017 as part of the national 2017 Welsh local elections. The elections were preceded by the 2012 elections and were followed by the 2022 elections.
The 2022 London local elections took place on 5 May 2022, as part of the 2022 United Kingdom local elections. All London borough councillor seats were up for election. Mayoral elections took place in Hackney, Lewisham, Newham and Tower Hamlets, with Croydon electing a mayor for the first time following a local referendum in October 2021.
The 2022 Bexley London Borough Council election took place on 5 May 2022. 45 members of Bexley London Borough Council were elected. The elections took place alongside local elections in the other London boroughs and elections to local authorities across the United Kingdom.
The 2022 Camden London Borough Council election took place on 5 May 2022. All 55 members of Camden London Borough Council were elected. The elections took place alongside local elections in the other London boroughs and elections to local authorities across the United Kingdom.
The 2022 Lambeth London Borough Council election took place on 5 May 2022. All 63 members of Lambeth London Borough Council were elected. The elections took place alongside local elections in the other London boroughs and elections to local authorities across the United Kingdom.
The 2022 Richmond upon Thames London Borough Council election took place on 5 May 2022. All 54 members of Richmond upon Thames London Borough Council were elected. The elections took place alongside local elections in the other London boroughs and elections to local authorities across the United Kingdom.
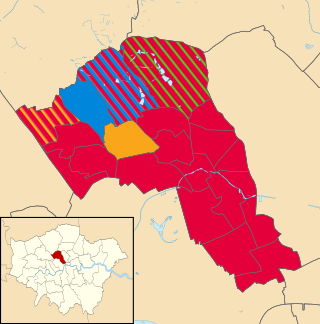
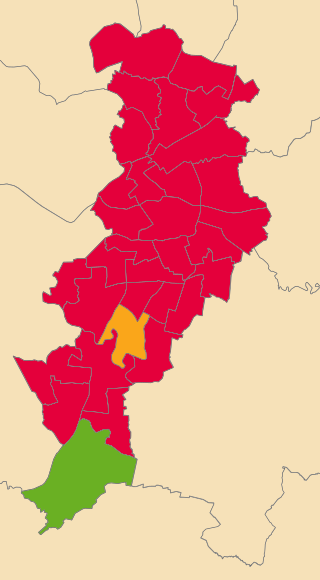
The 2022 Waltham Forest London Borough Council election was on 5 May 2022. All 60 members of Waltham Forest London Borough Council were elected. The elections took place alongside local elections in the other London boroughs and elections to local authorities across the United Kingdom. the Labour Party maintained its control of the council, winning 47 out of the 60 seats with the Conservative Party forming the council opposition with the remaining 13 seats.
The 2022 Manchester City Council election took place on 5 May 2022. One third of councillors on Manchester City Council were elected. This election was a part of the other local elections across the United Kingdom.
Elections to The Highland Council were held on 5 May 2022, the same day as the 31 other Scottish local government elections. As with other Scottish council elections, it was held using single transferable vote (STV) – a form of proportional representation – in which multiple candidates are elected in each ward and voters rank candidates in order of preference.
Elections to the City of Edinburgh Council took place on 5 May 2022 on the same day as the 31 other Scottish local government elections. As with other Scottish council elections, it was held using single transferable vote (STV) – a form of proportional representation – in which multiple candidates are elected in each ward and voters rank candidates in order of preference.
Elections to Argyll and Bute Council took place on 5 May 2022, the same day as the 31 other Scottish local government elections. As with other Scottish council elections, it was held using single transferable vote (STV)—a form of proportional representation—in which multiple candidates are elected in each ward and voters rank candidates in order of preference. New ward boundaries were proposed by Boundaries Scotland in 2021, which would have reduced the total number of councillors to 34. However, these were rejected by the Scottish Parliament and the boundaries used at the previous election remained in place.
Elections to Aberdeen City Council took place on 5 May 2022 on the same day as the 31 other Scottish local government elections. As with other Scottish council elections, it was held using single transferable vote (STV) – a form of proportional representation – in which multiple candidates are elected in each ward and voters rank candidates in order of preference.