Traffic congestion is a condition in transport that is characterized by slower speeds, longer trip times, and increased vehicular queuing. Traffic congestion on urban road networks has increased substantially since the 1950s, resulting in many of the roads becoming obsolete.[2] When traffic demand is great enough that the interaction between vehicles slows the traffic stream, this results in congestion. While congestion is a possibility for any mode of transportation, this article will focus on automobile congestion on public roads. Mathematically, traffic is modeled as a flow through a fixed point on the route, analogously to fluid dynamics.
As demand approaches the capacity of a road (or of the intersections along the road), extreme traffic congestion sets in. When vehicles are fully stopped for periods of time, this is known as a traffic jam,[3][4] a traffic snarl-up (informally)[5][6] or a tailback.[7] Drivers can become frustrated and engage in road rage. Drivers and driver-focused road planning departments commonly propose to alleviate congestion by adding another lane to the road; however, this is ineffective as increasing road capacity induces more demand for driving.[8]
Traffic on the Cairo-Assiut highway is blocked due to fogTraffic congestion on Marginal Pinheiros, near downtown São Paulo. According to Time magazine, São Paulo has the world's worst traffic jams. Drivers are informed through variable message signs that display the prevailing queue length.Time lapse video of traffic congestion near HaShalom interchange in Highway 20, Israel
Traffic congestion occurs when a volume of traffic generates demand for space greater than the available street capacity; this point is commonly termed saturation. Several specific circumstances can cause or aggravate congestion; most of them reduce the capacity of a road at a given point or over a certain length, or increase the number of vehicles required for a given volume of people or goods. About half of U.S. traffic congestion is recurring, and is attributed to sheer volume of traffic; most of the rest is attributed to traffic incidents, road work and weather events.[11][12] In terms of traffic operation, rainfall reduces traffic capacity and operating speeds, thereby resulting in greater congestion and road network productivity loss.
Individual incidents such as crashes or even a single car braking heavily in a previously smooth flow may cause ripple effects, a cascading failure also known as traffic waves, which then spread out and create a sustained traffic jam when, otherwise, the normal flow might have continued for some time longer.[13]
Economic theories
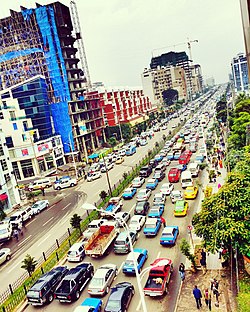
India's economic growth has resulted in a massive increase in the number of private vehicles on its roads overwhelming the transport infrastructure. Shown here is a traffic jam in Delhi.
Congested roads can be seen as an example of the tragedy of the commons. Because roads in most places are free at the point of usage, there is little financial incentive for drivers not to over-use them, up to the point where traffic collapses into a jam, when demand becomes limited by opportunity cost. Privatization of highways and road pricing have both been proposed as measures that may reduce congestion through economic incentives and disincentives [citation needed]. Congestion can also happen due to non-recurring highway incidents, such as a crash or roadworks, which may reduce the road's capacity below normal levels.
Rapid economic growth in China has resulted in a massive increase in the number of private vehicles in its major cities. Shown here is a traffic jam in downtown Haikou, Hainan Province, China.
Economist Anthony Downs argues that rush hour traffic congestion is inevitable because of the benefits of having a relatively standard work day[citation needed]. In a capitalist economy, goods can be allocated either by pricing (ability to pay) or by queueing (first-come first-served); congestion is an example of the latter. Instead of the traditional solution of making the "pipe" large enough to accommodate the total demand for peak-hour vehicle travel (a supply-side solution), either by widening roadways or increasing "flow pressure" via automated highway systems, Downs advocates greater use of road pricing to reduce congestion (a demand-side solution, effectively rationing demand), in turn putting the revenues generated therefrom into public transportation projects.
A 2011 study in The American Economic Review indicates that there may be a "fundamental law of road congestion." The researchers, from the University of Toronto and the London School of Economics, analyzed data from the U.S. Highway Performance and Monitoring System for 1983, 1993 and 2003, as well as information on population, employment, geography, transit, and political factors. They determined that the number of vehicle-kilometers traveled (VKT) increases in direct proportion to the available lane-kilometers of roadways. The implication is that building new roads and widening existing ones only results in additional traffic that continues to rise until peak congestion returns to the previous level.[14][15]
Classification and modeling
Qualitative classification of traffic is often done in the form of a six-letter A–F level of service (LOS) scale defined in the Highway Capacity Manual, a US document used (or used as a basis for national guidelines) worldwide. While this system generally uses delay as the basis for its measurements, the particular measurements and statistical methods vary depending on the facility being described. For instance, while the percent time spent following a slower-moving vehicle figures into the LOS for a rural two-lane road, the LOS at an urban intersection incorporates such measurements as the number of drivers forced to wait through more than one signal cycle.[16]
Another classification schema of traffic congestion is associated with some common spatiotemporal features of traffic congestion found in measured traffic data. Common spatiotemporal empirical features of traffic congestion are those features, which are qualitatively the same for different highways in different countries measured during years of traffic observations. Common features of traffic congestion are independent[clarification needed] on weather, road conditions and road infrastructure, vehicular technology, driver characteristics, day time, etc. Examples of common features of traffic congestion are the features [J] and [S] for, respectively, the wide moving jam and synchronized flow traffic phases found in Boris Kerner's three-phase traffic theory. The common features of traffic congestion can be reconstructed in space and time with the use of the ASDA and FOTO models.
Speed-flow diagram for a highway, scales omitted. When the volume of vehicles per hour reaches 75%-100% of the road capacity, traffic flow shifts from free-flowing (green) to congested (gray) and both volume and speeds are reduced. The red ellipse represents rush-hour traffic.Congestion on a street in Taipei consisting primarily of motorcycles
Some traffic engineers have attempted to apply the rules of fluid dynamics to traffic flow, likening it to the flow of a fluid in a pipe. Congestion simulations and real-time observations have shown that in heavy but free flowing traffic, jams can arise spontaneously, triggered by minor events ("butterfly effects"), such as an abrupt steering maneuver by a single motorist. Traffic scientists liken such a situation to the sudden freezing of supercooled fluid.[20]
Because of the poor correlation of theoretical models to actual observed traffic flows, transportation planners and highway engineers attempt to forecast traffic flow using empirical models. Their working traffic models typically use a combination of macro-, micro- and mesoscopic features, and may add matrix entropy effects, by "platooning" groups of vehicles and by randomizing the flow patterns within individual segments of the network. These models are then typically calibrated by measuring actual traffic flows on the links in the network, and the baseline flows are adjusted accordingly.
A team of MIT mathematicians has developed a model that describes the formation of "phantom jams", in which small disturbances (a driver hitting the brake too hard, or getting too close to another car) in heavy traffic can become amplified into a full-blown, self-sustaining traffic jam. Key to the study is the realization that the mathematics of such jams, which the researchers call "jamitons", are strikingly similar to the equations that describe detonation waves produced by explosions, says Aslan Kasimov, lecturer in MIT's Department of Mathematics. That discovery enabled the team to solve traffic-jam equations that were first theorized in the 1950s.[21]
Traffic congestion has a number of negative effects:
Wasting time of motorists and passengers ("opportunity cost"). As a non-productive activity for most people, congestion reduces regional economic health.
Delays, which may result in late arrival for employment, meetings, and education, resulting in lost business, disciplinary action or other personal losses.
Inability to forecast travel time accurately, leading to drivers allocating more time to travel "just in case", and less time on productive activities.
Wear and tear on vehicles as a result of idling in traffic and frequent acceleration and braking, leading to more frequent repairs and replacements.
Stressed and frustrated motorists, encouraging road rage and reduced health of motorists
Emergencies: blocked traffic may interfere with the passage of emergency vehicles traveling to their destinations where they are urgently needed.
Spillover effect from congested main arteries to secondary roads and side streets as alternative routes are attempted ('rat running'), which may affect neighborhood amenity and real estate prices.
Higher chance of collisions due to tight spacing and constant stopping-and-going.
Road rage
Road rage is aggressive or angry behavior by a driver of an automobile or other motor vehicle. Such behavior might include rude gestures, verbal insults, deliberately driving in an unsafe or threatening manner, or making threats. Road rage can lead to altercations, assaults, and collisions which result in injuries and even deaths. It can be thought of as an extreme case of aggressive driving.
An example of the traffic situation in Accra, Ghana, increasing carbon emission in the air
The term originated in the United States in 1987–1988 (specifically, from Newscasters at KTLA, a local television station), when a rash of freeway shootings occurred on the 405, 110 and 10 freeways in Los Angeles, California. These shooting sprees even spawned a response from the AAA Motor Club to its members on how to respond to drivers with road rage or aggressive maneuvers and gestures.[22]
Economic loss
Costs of congestion and parking search
This section needs expansion. You can help by adding to it. (December 2019)
Houses in this street in Royal Tunbridge Wells were built when cars were few. With no provision for garages or off-street parking, on-street parking has formed a choke point likely to cause traffic congestion.A traffic jam in Madrid
Congestion has the benefit of encouraging motorists to retime their trips so that expensive road space is in full use for more hours per day. It may also encourage travellers to pick alternate modes with a lower environmental impact, such as public transport or bicycles.[32]
It has been argued that traffic congestion, by reducing road speeds in cities, could reduce the frequency and severity of road crashes.[33] More recent research suggests that a U-shaped curve exists between the number of accidents and the flow of traffic, implying that more accidents happen not only at high congestion levels, but also when there are very few vehicles on the road.[34]
Metered ramp on I-894 in Milwaukee, Wisconsin, U.S. The queue of cars waiting at the red light can be seen on the upper portion of the picture.The A38M Aston Expressway in Aston, towards central Birmingham - the lanes are controlled via the overhead gantries, which reverse the flow of one lane (making 4 in one direction, 2 in the other and a central buffer lane) during peak times accordingly.The HOV lanes in Highway 404 in Southern Ontario are separated by a stripped buffer zone that breaks occasionally to allow vehicles to enter and exit the HOV lane.
Increasing road capacity is standard response to congestion, perhaps by widening an existing road or adding a new road, bridge or tunnel. However, this has been shown to result in attracting more traffic, otherwise known as induced demand. The result can be greater congestion on the expanded artery itself or on auxiliary roads.[8] In a similar vein, Braess's paradox shows that adding road capacity might make congestion worse, even if demand does not increase. In his paper, "The Law of Peak Hour Express Way Congestion", published in 1962, Anthony Downs formulated this phenomenon as a "law": "on urban commuter expressways, peak-hour traffic congestion rises to meet maximum capacity."[35]
Reversible lanes, where certain sections of highway operate in the opposite direction on different times of the day(s) of the week, to match asymmetric demand. These pose a potential for collisions, if drivers do not notice the change in direction indicators. This may be controlled by variable-message signs or by movable physical separation
Separate lanes for specific user groups (usually with the goal of higher people throughput with fewer vehicles)
HOV lanes, for vehicles with at least three (sometimes at least two) riders, intended to encourage carpooling
Slugging, impromptu carpooling at HOV access points, on a hitchhiking or payment basis
Market-based carpooling with pre-negotiated financial incentives for the driver
Urban planning and design
City planning and urban design practices can have a huge impact on levels of future traffic congestion, though they are of limited relevance for short-term change.
Grid plans including fused grid road network geometry, rather than tree-like network topology which branches into cul-de-sacs (which reduce local traffic, but increase total distances driven and discourage walking by reducing connectivity). This avoids concentration of traffic on a small number of arterial roads and allows more trips to be made without a car.
Zoning laws that encourage mixed-use development, which reduces distances between residential, commercial, retail, and recreational destinations and encourage cycling and walking. Cycling modal share is strongly associated with the availability of local cycling infrastructure.[36]
Carfree cities, car-light cities, and eco-cities designed to eliminate the need to travel by car for most inhabitants.[37][38]
Widening works under way on the M25 motorway surrounding London, England to increase the number of lanesDuring rush hour, right turns onto the side street shown here are prohibited in order to prevent rat running.
Congestion can be reduced by either increasing road capacity (supply), or by reducing traffic (demand). Capacity can be increased in a number of ways, but needs to take account of latent demand otherwise it may be used more strongly than anticipated. Critics of the approach of adding capacity have compared it to "fighting obesity by letting out your belt" (inducing demand that did not exist before). For example, when new lanes are created, households with a second car that used to be parked most of the time may begin to use this second car for commuting.[39][40] Reducing road capacity has in turn been attacked as removing free choice as well as increasing travel costs and times, placing an especially high burden on the low income residents who must commute to work.[citation needed]
Increased supply can include:
Adding more capacity at bottlenecks (such as by adding more lanes at the expense of hard shoulders or safety zones, or by removing local obstacles like bridge supports and widening tunnels)
Adding more capacity over the whole of a route (generally by adding more lanes)
Creating new routes
Traffic management improvements (see separate section below)
Reduction of demand can include:
Parking restrictions, making motor vehicle use less attractive by increasing the monetary and non-monetary costs of parking, introducing greater competition for limited city or road space.[41] Most transport planning experts agree that free parking distorts the market in favor of car travel, exacerbating congestion.[42][43]
Road pricing, charging money for access onto a road/specific area at certain times, congestion levels or for certain road users
"Cap and trade", in which only licensed cars are allowed on the roads.[44] A limited quota of car licenses are issued each year and traded in a free market fashion. This guarantees that the number of cars does not exceed road capacity while avoiding the negative effects of shortages normally associated with quotas. However, since demand for cars tends to be inelastic, the result are exorbitant purchase prices for the licenses, pricing out the lower levels of society, as seen Singapore's Certificate of Entitlement scheme.[45]
Fixed (the same at all times of day), variable (higher at peak times), or dynamic (higher during actual congestion) toll roads, toll bridges, toll tunnels, and toll lanes
Allowing driving on highway shoulders at peak times
Road space rationing, where regulatory restrictions prevent certain types of vehicles from driving under certain circumstances or in certain areas.
Number plate restrictions based on days of the week, as practiced in several large cities in the world, such as Athens,[46]Mexico City, Manila, and São Paulo.[47] In effect, such cities are banning a different part of the automobile fleet from roads each day of the week. Mainly introduced to combat smog, these measures also reduce congestion. A weakness of this method is that richer drivers can purchase a second or third car to circumvent the ban.[citation needed]
Permits, where only certain types of vehicles (such as residents) are permitted to enter a certain area, and other types (such as through-traffic) are banned.[47] For example, Bertrand Delanoë, the mayor of Paris, has proposed to impose a complete ban on motor vehicles in the city's inner districts, with exemptions only for residents, businesses, and the disabled.[48]
Bike lane constructed in areas of low space to encourage use of human-sized transportation
Policy approaches, which usually attempt to provide either strategic alternatives or which encourage greater usage of existing alternatives through promotion, subsidies or restrictions.
Promotion of more flexible work place practices. For example, a flexible workplaces pilot was undertaken in Brisbane, Australia during 2009 to test the applicability of a voluntary travel behavior change program to achieve transport system outcomes, particularly as they related to managing congestion, either through mode shift or peak spreading. During the one-month Pilot, amongst almost 900 Brisbane CBD workers across 20 private and public sector organizations, shifts of more than 30% out of the morning and afternoon peak travel was recorded.[56]
Remote work encouraged through legislation and subsidies.[57]
Traffic counters permanently installed, to provide real-time traffic counts
Automated highway systems, a future idea which could reduce the safe interval between cars (required for braking in emergencies) and increase highway capacity by as much as 100% while increasing travel speeds[citation needed]
Active traffic management[61] system opens up UK motorway hard shoulder as an extra traffic lane; it uses CCTV and VMS to control and monitor the traffic's use of the extra lane.
Other associated
Different modes of transport require different amounts of road space.
School opening times arranged to avoid rush hour traffic (in some countries, private car school pickup and drop-off traffic are substantial percentages of peak hour traffic).[citation needed]
Considerate driving behavior promotion and enforcement. Driving practices such as tailgating, frequent lane changes, and impeding the flow of traffic can reduce a road's capacity and exacerbate jams. In some countries signs are placed on highways to raise awareness, while others have introduced legislation against inconsiderate driving.
Visual barriers to prevent drivers from slowing down out of curiosity (often called "rubbernecking" in the United States). This often includes crashes, with traffic slowing down even on roadsides physically separated from the crash location. This also tends to occur at construction sites, which is why some countries have introduced rules that motorway construction has to occur behind visual barrier
Speed limit reductions, as practiced on the M25 motorway in London. With lower speeds allowing cars to drive closer together, this increases the capacity of a road. Note that this measure is only effective if the interval between cars is reduced, not the distance itself. Low intervals are generally only safe at low speeds.
Reduction of road freight avoiding problems such as double parking with innovative solutions including cargo bicycles and Gothenburg's Stadsleveransens.[64]
Traffic during peak hours in major Australian cities, such as Sydney, Melbourne, Brisbane and Perth, is usually very congested and can cause considerable delay for motorists. Australians rely mainly on radio and television to obtain current traffic information. GPS, webcams, and online resources are increasingly being used to monitor and relay traffic conditions to motorists.[citation needed] Based on a survey in 2024, Brisbane is the most congested city in Australia and 10th in the world, with drivers averagely losing 84 hours throughout the year.[66]
Traffic jams have become intolerable in Dhaka. Some other major reasons are the total absence of a rapid transit system; the lack of an integrated urban planning scheme for over 30 years;[67] poorly maintained road surfaces, with potholes rapidly eroded further by frequent flooding and poor or non-existent drainage;[68] haphazard stopping and parking;[69] poor driving standards;[70] total lack of alternative routes, with several narrow and (nominally) one-way roads.[71][72]
Brazil
Typical traffic jam in São Paulo downtown, despite road space rationing by plate number. Rua da Consolação, São Paulo, Brazil
According to Time magazine, São Paulo has the world's worst daily traffic jams.[10] Based on reports from the Companhia de Engenharia de Tráfego, the city's traffic management agency, the historical congestion record was set on May 23, 2014, with 344 kilometres (214mi) of cumulative queues around the city during the evening rush hour.[73] The previous record occurred on November 14, 2013, with 309 kilometres (192mi) of cumulative queues.[73]
Despite implementation since 1997 of road space rationing by the last digit of the plate number during rush hours every weekday, traffic in this 20-million-strong city still experiences severe congestion. According to experts, this is due to the accelerated rate of motorization occurring since 2003 and the limited capacity of public transport. In São Paulo, traffic is growing at a rate of 7.5% per year, with almost 1,000 new cars bought in the city every day.[74] The subway has only 61 kilometres (38mi) of lines, though 35 further kilometers are under construction or planned by 2010. Every day, many citizens spend between three up to four hours behind the wheel. In order to mitigate the aggravating congestion problem, since June 30, 2008, the road space rationing program was expanded to include and restrict trucks and light commercial vehicles.[75][76]
Canada
Highway 401 in Ontario, which passes through Toronto, suffers chronic traffic congestion despite its width of up to 18 lanes.
According to the Toronto Board of Trade, in 2010, Toronto is ranked as the most congested city of 19 surveyed cities, with an average commute time of 80 minutes.[79]
China
Traffic jam in Beijing
The Chinese city of Beijing started a license plate rationing since the 2008 Summer Olympics whereby each car is banned from the urban core one workday per week, depending on the last digit of its license plate. As of 2016, 11 major Chinese cities have implemented similar policies.[80] Towards the end of 2010, Beijing announced a series of drastic measures to tackle the city's chronic traffic congestion, such as limiting the number of new plates issued to passenger cars to 20,000 a month, barring vehicles with non-Beijing plates from entering areas within the Fifth Ring Road during rush hours and expanding its subway system.[81] The government aims to cap the number of locally registered cars in Beijing to below 6.3 million by the end of 2020.[82] In addition, more than nine major Chinese cities including Shanghai, Guangzhou and Hangzhou started limiting the number of new plates issued to passenger cars in an attempt to curb the growth of car ownership.[83][84] In response to the increased demand to public transit caused by these policies, aggressive programs to rapidly expand public transport systems in many Chinese cities are currently underway.[85]
A unique Chinese phenomenon of severe traffic congestion occurs during Chunyun Period or Spring Festival travel season.[86] It is a long-held tradition for most Chinese people to reunite with their families during Chinese New Year. People return to their hometown to have a reunion dinner with their families on Chinese New Year. It has been described as the largest annual human migration in the world.[87][88] Since the economic boom and rapid urbanization of China since the late 1970s, many people work and study a considerable distance from their hometowns. Traffic flow is typically directional, with large amounts of the population working in more developed coastal provinces needing travel to their hometowns in the less developed interior. The process reverses near the end of Chunyun. With almost 3 billion trips[89] made in 40 days of the 2016 Chunyun Period, the Chinese intercity transportation network is extremely strained during this period.
The August 2010 China National Highway 110 traffic jam in Hebei province caught media attention for its severity, stretching more than 100 kilometres (62mi) from August 14 to 26, including at least 11 days of total gridlock.[90][91][92] The event was caused by a combination of road works and thousands of coal trucks from Inner Mongolia's coalfields that travel daily to Beijing. The New York Times has called this event the "Great Chinese Gridlock of 2010."[92][93] The congestion is regarded as the worst in history by duration, and is one of the longest in length after the 175 kilometres (109mi) long Lyon-Paris traffic jam in France on February 16, 1980.
Recently, in Hangzhou City Brain has become active, reducing traffic congestion somewhat.[94]
A 2021 study of subway constructions in China found that in the first year of a new subway line, road congestion declined.[95]
Costa Rica
In 2025, Costa Rica was ranked as the country with the second-to-worst traffic congestion in the world according to the Numbeo Traffic Index of 2025 [96], only behind Nigeria and above Egypt, India, Bangladesh, etc...; mainly caused by an increase in the amount of vehicles, neglected or outdated infrastrucure and lack of viable transport alternatives [97], with the current bus and train routes being ill equipped to counteract or mitigate the increase of traffic congestion, specially in the Greater Metropolitan Area (GAM), where half the population lives.
Greece
Athens inner Daktylios limits
Since the 70s, the traffic on the streets of Athens has increased dramatically, with the existing road network unable to serve the ever-increasing demand. In addition, it has also caused an environmental burden, such as the photochemical smog. To deal with it, the Daktylios has been enforced.
The number of vehicles in India is quickly increasing as a growing middle class can now afford to buy cars. India's road conditions have not kept up with the exponential growth in number of vehicles.
Various causes for this include:
Private encroachments
Non cooperation among drivers
Unscientific road design
Lack of free ways/exit ways where local roads and main roads intersect
Lack of demarcated footpaths
Lack of bus bays
Lack of cycle tracks
Lack of coordination among various government departments (e.g. digging of roads by telecom/water department and leaving it open)
According to a 2015 study by motor oil company Castrol, Jakarta is found to be the worst city in the world for traffic congestion. Relying on information from TomTom navigation devices in 78 countries, the index found that drivers are stopping and starting their cars 33,240 times per year on the road. After Jakarta, the worst cities for traffic are Istanbul, Mexico City, Surabaya, and St. Petersburg.[98]
In 2016, 22 people died as a result of traffic congestion in Java. They were among those stuck in a three-day traffic jam at a toll exit in Brebes, Central Java called Brebes Exit or 'Brexit'. The traffic block stretched for 21km here and thousands of cars clogged the highway. Many people died because of carbon monoxide poisoning, fatigue or heat.[100]
New Zealand has followed strongly car-oriented transport policies since after World War II (especially in Auckland, where one third of the country's population lives, is New Zealand's most traffic congested city, and has been labeled worse than New York for traffic congestion with commuters sitting in traffic congestion for 95 hours per year),[101] and currently has one of the highest car-ownership rates per capita in the world, after the United States.[102] Traffic congestion in New Zealand is increasing with drivers on New Zealand's motorways reported to be struggling to exceed 20km/h on an average commute, sometimes crawling along at 8km/h for more than half an hour.
Traffic caused losses of ₱137,500,000,000 on the economy in 2011, and unbuilt roads and railway projects also causes worsening congestion.[106] The Japan International Cooperation Agency (JICA) feared that daily economic losses will reach Php 6,000,000,000 by 2030 if traffic congestion cannot be controlled.[107]
In the United Kingdom the inevitability of congestion in some urban road networks has been officially recognized since the Department for Transport set down policies based on the report Traffic in Towns in 1963:
Even when everything that it is possibly to do by way of building new roads and expanding public transport has been done, there would still be, in the absence of deliberate limitation, more cars trying to move into, or within our cities than could possibly be accommodated.[111]
The Department for Transport sees growing congestion as one of the most serious transport problems facing the UK.[112] On December 1, 2006, Rod Eddington published a UK government-sponsored report into the future of Britain's transport infrastructure. The Eddington Transport Study set out the case for action to improve road and rail networks, as a "crucial enabler of sustained productivity and competitiveness". Eddington has estimated that congestion may cost the economy of England £22 bn a year in lost time by 2025. He warned that roads were in serious danger of becoming so congested that the economy would suffer.[113] At the launch of the report Eddington told journalists and transport industry representatives introducing road pricing to encourage drivers to drive less was an "economic no-brainer". There was, he said "no attractive alternative". It would allegedly cut congestion by half by 2025, and bring benefits to the British economy totaling £28 bn a year.[114]
A congestion charge for driving in central London was introduced in 2003. In 2013, ten years later, Transport for London reported that the scheme resulted in a 10% reduction in traffic volumes from baseline conditions, and an overall reduction of 11% in vehicle kilometers in London. Despite these gains, traffic speeds in central London became progressively slower.
The Texas Transportation Institute estimated that, in 2000, the 75 largest metropolitan areas experienced 3.6 billion vehicle-hours of delay, resulting in 5.7 billion U.S. gallons (21.6 billion liters) in wasted fuel and $67.5 billion in lost productivity, or about 0.7% of the nation's GDP. It also estimated that the annual cost of congestion for each driver was approximately $1,000 in very large cities and $200 in small cities. Traffic congestion is increasing in major cities and delays are becoming more frequent in smaller cities and rural areas.
According to traffic analysis firm INRIX in 2019,[116] the top 31 worst US traffic congested cities (measured in average hours wasted per vehicle for the year) were:
City
Hours wasted per vehicle
Cost of congestion per driver
1
Boston, Massachusetts
149 hours
$2,205
2
Chicago, Illinois
145 hours
$2,146
3
Philadelphia, Pennsylvania
142 hours
$2,102
4
New York City, New York
140 hours
$2,072
5
Washington, D.C.
124 hours
$1,835
6
Los Angeles, California
103 hours
$1,524
7
San Francisco, California
97 hours
$1,436
8
Portland, Oregon
89 hours
$1,317
9
Baltimore, Maryland
84 hours
$1,243
10
Atlanta, Georgia
82 hours
$1,214
11
Houston, Texas
81 hours
$1,199
12
Miami, Florida
81 hours
$1,199
13
New Orleans, Louisiana
79 hours
$1,169
14
Seattle, Washington
74 hours
$1,095
15
Stamford, Connecticut
74 hours
$1,095
16
Providence, Rhode Island
70 hours
$1,036
17
San Diego, California
70 hours
$1,036
18
Austin, Texas
69 hours
$1,021
19
Sacramento, California
64 hours
$947
20
Dallas, Texas
63 hours
$932
21
Denver, Colorado
63 hours
$932
22
Hartford, Connecticut
61 hours
$903
23
Minneapolis, Minnesota
52 hours
$770
24
Charlotte, North Carolina
49 hours
$725
25
San Juan, Puerto Rico
46 hours
$681
26
Cleveland, Ohio
44 hours
$651
27
Columbus, Ohio
43 hours
$636
28
Milwaukee, Wisconsin
41 hours
$607
29
Detroit, Michigan
39 hours
$577
30
San Antonio, Texas
39 hours
$577
31
Boulder, Colorado
37 hours
$548
The most congested highway in the United States, according to a 2010 study of freight congestion (truck speed and travel time), is Chicago's Interstate 290 at the Circle Interchange. The average truck speed was just 29mph (47km/h).[117]
↑"Congestion pricing in New York gets the go-ahead after all. Maybe". The Economist. November 21, 2024. Retrieved November 21, 2024. But traffic is bad most days, with more than 900,000 cars entering Manhattan's central business district. INRIX, a traffic-data firm, found that New York City leads the world in urban traffic congestion among the cities scored, with the average driver stationary for 101 hours a year.
↑Caves, R. W. (2004). Encyclopedia of the City. Routledge. p.141.
↑Goddard, Haynes (July 1997). "Using Tradeable Permits to Achieve Sustainability in the World's Large Cities". Environmental and Resource Economics. 10 (1): 63–99. doi:10.1023/A:1026444113237. S2CID154186781.
12"Regulatory restrictions". KonSULT, the Knowledgebase on Sustainable Urban Land use and Transport. Institute for Transport Studies, University of Leeds. Archived from the original on August 25, 2004.
↑Simon, Hermann; Robert J Dolan. "Price Customization". Marketing Management. 7 (3). American Marketing Association.
↑Link, Heike (March 2004). "PEP-A Yield-Management Scheme for Rail Passenger Fares in Germany". Japan Railway & Transport Review. 38: 54.
↑Andersen, Bjørn (January 1993). "A survey of the Swiss public transport system and policy". Transport Reviews. 13 (1): 61–81. doi:10.1080/01441649308716835.
↑Marinelli, P. A. Cleary, N. Worthington Eyre, H. and Doonan, K. 2010. Flexible Workplaces: Achieving the worker's paradise and transport planner's dream in Brisbane, Proceedings of the 33rd Australasian Transport Research Forum, September 29-October 1, 2010, Canberra.
This page is based on this Wikipedia article Text is available under the CC BY-SA 4.0 license; additional terms may apply. Images, videos and audio are available under their respective licenses.