This article is about a hypothesis that vehicle use in some developed countries has peaked and will decline. For times when traffic is heavy, see rush hour.
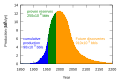
Transport modal share in the United Kingdom from 1952 to 2014
Peak car (also peak car use or peak travel) is a hypothesis that motor vehicle distance traveled per capita, predominantly by privatecar, has peaked and will now fall in a sustained manner. The theory was developed as an alternative to the prevailing market saturation model, which suggested that car use would saturate and then remain reasonably constant, or to GDP-based theories which predict that traffic will increase again as the economy improves, linking recent traffic reductions to the Great Recession of 2008.
The theory was proposed following reductions, which have now been observed in Australia,[1] Belgium,[1] France,[1] Germany, Iceland, Japan (early 1990s), New Zealand,[1] Sweden, the United Kingdom (many cities from about 1994) and the United States. A study by Volpe Transportation in 2013 noted that average miles driven by individuals in the United States has been declining from 900 miles (1,400km) per month in 2004 to 820 miles (1,320km) in July 2012, and that the decline had continued since the recent upturn in the US economy.[2]
A number of academics have written in support of the theory, including Phil Goodwin, formerly Director of the transport research groups at Oxford University and University College London (UCL), and David Metz, a former Chief Scientist of the UK Department of Transport. The theory is disputed by the UK Department for Transport, which predicts that road traffic in the United Kingdom will grow by 50% by 2036, and Professor Stephen Glaister, Director of the RAC Foundation, who say traffic will start increasing again as the economy improves. Unlike peak oil, a theory based on a reduction in the ability to extract oil due to resource depletion, peak car is attributed to more complex and less understood causes.
History
Saturation model
The idea that car ownership would reach a saturation level and stop growing further has been around since at least 1925 when, for example, Miller McClintock noted that "[t]he most widely accepted estimate of the saturation point is five-to-one, that is, one automobile for every five persons".[3] McClintock also predicted induced traffic: "the density of traffic will always approach a point of complete saturation. [An] increase in street capacity ... will not reduce the density of traffic, for the places thus made available, will be taken by those drivers who may be said to be on the margin of convenience".
In Traffic in Towns, a report produced in 1963 for the UK Ministry of Transport, Professor Sir Colin Buchanan suggested that traffic would saturate early in the 21st century. It has certainly been used in official traffic forecasting since the 1970s, for example in a UK Government study by Tulpule (1973) which forecast that car ownership would reach its maximum level by about 2010, with car use showing little further growth after that point.[4]
In a series of international comparisons starting in 1993 and continuing until his death in 2011, the American researcher Lee Schipper[5][6] and his colleagues noted that car traffic growth had slowed or ceased in a number of developed economies.
'Peak car' theory
The 'peak car' hypothesis was proposed after declines in traffic during the morning peak period were observed from the mid 1990s in some places and at a national level in the United Kingdom since about 2008. Local Transport Today, a professional transport journal in the United Kingdom, reported that the number "peak car traffic" entering Britain's town and city centres during the morning peak hours had declined significantly over the previous ten years; of 21 areas studied all except Leeds had seen falls.[7] Traffic into London during the morning peak period had fallen 28% between 1994 and 2003 when the London congestion charge was introduced and a further 12% by 2004.[7] Inbound car trip into Birmingham during the morning peak period had fallen by 29% between 1995 and 2003.[7]
Between June and September 2010 Professor Phil Goodwin published a series of articles in the UK professional transport press suggesting that data showed not merely a plateau in vehicle miles driven but rather a decline in overall automobile usage per capita.[8][9][10][11] These articles were later compiled and updated in a journal article by Goodwin, published in 2011.[12]
David Metz, of University College London and former Chief Scientist of the UK Department of Transport noted in 2010 that "peak car use came and went [in the UK] at least 15 years ago, when none of us noticed".[13] He then published articles in 2010 and 2012 suggesting that the Department's forecasts of growth were erroneous because in the UK a saturated peak level had already been reached.[14][15]
In November 2010 by Millard-Ball and Schipper presented data confirming the trend in cities in eight nations: United States, Canada, Sweden, France, Germany, the United Kingdom, Japan and Australia.[16][17][18] Newman and Kenworthy published an article in June 2011 suggesting that the effect was also valid for Australia.[19]
By 2016, several papers[20][21][22] have cast doubt on the peak car phenomenon, demonstrating that economic and sociodemographic factors account for most or all of the observed slowdowns. Recent statistics in the US show total vehicle-miles traveled (VMT) increasing after several years of decline,[23] although per-capita VMT remains below its all-time high.
Proposed causes
There is speculation about causes of a decline in automobile usage. Analysts such as Newman[19] as well as views expressed in the journal edited by Melia entitled World Transport Policy and Practice[24] point to various interrelated causes. Factors include:
Travel time budgets, a theoretical psychological limit suggesting a long term constraint on the amount of time people allocate to travel of about one hour a day. Studies using this concept (albeit not always defined in the same way) have included those of Zahavi (1974),[25] Mogridge (1983)[26] and Metz (2010) who suggested that saturation would naturally follow from the observation that access to destinations increased with the square of speed, but was offset by the tendency for each additional choice of destination to offer less and less extra benefit. A version was suggested by Marchetti, sometimes called 'the Marchetti Wall'; when cities become more than "one hour wide," they stop growing or they become dysfunctional, or both.[27]
The growth of public transport. For example, railway travel in the United Kingdom has been undergoing a renaissance, according to one view.[28] In the US Amtrak has posted record ridership for every year since 2000 with the exception of 2009.[29][30]
The reversal of urban sprawl and other population shifts from suburbs to cities.[31]
Proliferation of different ways to own and hire vehicles, such as Streetcar, Zipcar, and Whipcar,[32] as well as other options for car sharing,[1] or self-driving cars.
Cultural shifts especially among young people for whom acquisition of a driving licence is now seen less as a key rite of passage into adulthood, and is reflected in recent reductions in the propensity of young people to acquire driving licences. One report suggests there has been a shift in notions about status: the car is no longer a "big prestige item" as in previous decades.[32] For millennials and digital natives, there is less focus on ownership of things, especially big-ticket items such as cars.[32]Millennials see cars as "mere appliances—unnecessary, pricey ones that they'll try to avoid".[1]
Legal restrictions; for example, restrictions on teenagers seeking driving licences.[2]
Demographic changes; for example, baby boomers drive less as they age, according to one view.[2]
Saturation of demand in the sense that there has been a "levelling-off" of possible places to travel to by car.[32] According to this view, when road networks were expanding, there were numerous options of new places to drive to, but as road networks have generally stopped expanding, the demand for increased car travel has become saturated.[32]
Growth of e-commerce such as tele-shopping, conferences, and smartphone or computer-based social networks. According to this view, these developments have reduced the need for travel by car, such that the "love affair with the phone" has replaced the "love affair with the car" for a proportion of the population, and that widespread use of cell phones and Skype meant there was less need for in-person visits.[31] However, a contrasting view suggested that e-commerce was not a substantial factor explaining less car travel in the United States.[2] Still, countries with higher use of the Internet correlated with fewer 20- to 24-year-olds getting drivers' licenses.[31]
One analyst explained about changing attitudes of young people:
Virtual contact through electronic means reduces the need for actual contact among young people ... Furthermore, some young people feel that driving interferes with texting.
Another elaborated about the saturation of demand hypothesis:
They say as we get richer, we'll want to travel more. There's no limit. Our hunch was that this might not be the case. ... The data that we have shows fairly clearly that the growth in travel demand has stopped in every industrialised country that we looked at.
The proposition that car usage has peaked has been disputed regarding vehicle usage in the United Kingdom. In December 2010, Stephen Glaister, the Director of the RAC Foundation, suggested that total traffic has grown more or less as a straight line since the 1950s and such growth will recommence when economic conditions improve;[33] in 2011, the UK Department for Transport predicted a 50% growth in traffic in the coming 25 years.[34] In addition, a corroborating view by Paul Watters suggested that car usage will continue to be important in Britain, and that there will not be "shattering change" by 2020.[32] Scholars studying transport and socio-technical transitions have elaborated possible future scenarios for car use in England and the Netherlands.[35]
The advent of autonomous cars is likely to accelerate the decline in car ownership.[36][37] A 2015 case study by the OECD International Transport Forum[38] suggested Lisbon could maintain current levels of mobility with an autonomous car share fleet one tenth the size of its current vehicle fleet.
Note, in China there is a forecast of tremendous growth in car ownership and travel, although there is also greater awareness of environmental issues as well as issues of inequality between car-owners and non-owners.[43]
Declines in specific countries
Germany
The city of Hamburg in its so-called Green Network Plan, is considering ways of phasing out automobile traffic in the city center over the next two decades by increasing public transportation and adding special routes for cyclists and people on foot.[44]
United Kingdom
One report suggested driving in the United Kingdom has been declining since 1990.[1] The number of 17- to 20-year-olds with driving licences declined from 48% during the early-1990s to 35% in 2011, according to one report.[32] Traffic by cars and taxis has declined since 2007.[32] One report suggested renewed growth in rail travel, such that there was a "rail renaissance" underway.[28] The City of London has been experiencing a fall in the number of cars on the roads.[28] In 2022 the British Society of Motor Manufacturers and Traders reported a second consecutive year of declining car ownership.[45]
United States
A report in Time Magazine suggested Americans are "driving less and less each year."[1] It noted that fewer Americans were "commuting solo" to work.[1] Road congestion nationwide declined by 27% in 2011.[1] There is some evidence of a generational shift. For example, one 24-year-old with a car moved to Washington, D.C., for work purposes but did not take her car, and she explained:
I don't need (my car). My apartment is just over a mile from my office, so I walk every day... I think I might give it to my parents...
↑ McClintock, Miller (1925). Street traffic control. New York: McGraw-Hill. p.4. Retrieved 23 January 2022.
↑ Tulpule, A. H. (1973). Forecasts of vehicles and traffic in Great Britain 1972 revision, Report LR543. Crowthorne, UK: Transport and Road Research Laboratory.
↑ Schipper, Lee; Steiner R; Figueroa M J; Dolan K (1993). "Fuel prices and economy. Factors affecting land travel". Transport Policy. ! (1): 1–22.
↑ Schipper, Lee (2011). "Automobile use, fuel economy and CO2 emissions in industrialized countries: Encouraging trends through 2008?". Transport Policy. 18 (2): 358–372. doi:10.1016/j.tranpol.2010.10.011.
1 2 3 "Peak car traffic dropping in city centres, LTT survey reveals". Local Transport Today. 7 April 2006. The number of cars entering Britain's town and city centres in the morning peak hours has declined significantly in the last ten years, according to analysis of 21 urban areas conducted by LTT.... The number of people entering central London by car during the morning peak hours (0700-1000) has fallen by over 40% since 1994 and had already declined by 28% prior to the introduction of the congestion charge in 2003. Birmingham saw the number of inbound trips by car during the morning peak period fall by 29% between 1995 and 2003.
↑ Goodwin, P. (25 June 2010). "What about 'peak car' – heresy or revelation?". Local Transport Today. Rail, bus and tram use all peaked and then declined, so why do so many people assume that car use will either keep rising indefinitely or reach saturation and a 'steady state' condition?
↑ Goodwin, P. (23 July 2010). "Thoughts on peak car – part two". Local Transport Today. 'Peak car' is the idea that car use may not saturate, but turn down. In Part One in June I discussed the experience of rail use after 1918, and road public transport use after 1950, where this happened. In Part Two in July I considered what sort of evidence could distinguish between the identical-looking saturating curve and one about to turn down.
↑ Goodwin, Phil (2011). "Three Views on 'Peak Car'". World Transport Policy & Practice. 17 (4).
↑ "Car use peaked in London fifteen years ago". Local Transport Today. 9 July 2010. as far as London is concerned, peak car use came and went at least 15 years ago, when none of us noticed. Transport for London's most recent Travel in London report records a steady decline in private transport's share of trips since at least 1993 (then 50%, 41% in 2008). Correspondingly, public transport's mode share has risen from 24% to 33%, while walking and cycling have been steady at about 25%. Historically, car use has invariably increased as incomes have risen. So it is remarkable that this trend has gone into reverse in London, a prosperous world city with a growing population.
1 2 3 4 5 6 7 8 9 Millard-Ball, A. & Schipper, L. (18 November 2010). "Are We Reaching Peak Travel? Trends in Passenger Transport in Eight Industrialized Countries". Transport Reviews. 31 (3, 2011): 357–378. doi:10.1080/01441647.2010.518291. S2CID154874425.
↑ Peterson, G. (5 January 2011). "Peak travel?". Resilience Science.
↑ Bastian, Anne; Börjesson, Maria (1 August 2015). "Peak car? Drivers of the recent decline in Swedish car use". Transport Policy. 42: 94–102. doi:10.1016/j.tranpol.2015.05.005.
↑ "DfT rejects 'peak car' hypothesis and predicts return to traffic growth". Local Transport Today. 16 March 2012. After decades of relentless growth the last ten years have seen road traffic volumes first stabilise and then decline. But the DfT believes this is just a temporary blip and that growth will soon resume... ROAD TRAFFIC volumes in England are likely to grow by almost 50% over the next 25 years, according to the DfT's new National Road Traffic Forecasts (NRTF). The headline forecast is that road traffic will rise from 261.2bn vehicle miles [420.4billion kilometres] in 2010 to 375.6bn [604.5billion kilometres] in 2035. This 44% growth is a central estimate, between the low growth of 34% (to 349.8bn miles) and the high growth of 55% (to 405bn miles [652billion kilometres]).
↑ Geels, F., Kemp, R., Dudley, G., Lyons, G. (2012) Automobility in Transition? A Socio-Technical Analysis of Sustainable Transport. Oxford: Routledge.
1 2 3 4 5 Pearce, Fred (16 August 2011). "The end of the road for motormania". New Scientist. Retrieved 25 April 2012. Japan peaked in the 1990s. They talk there of "demotorisation". The west had its tipping point in 2004. That year the US, UK, Germany, France, Australia and Sweden all saw the start of a decline in the number of kilometres the average person travelled in a car that continues today. In Australia, car travel peaked in every city in 2004 and has been falling since
↑ Puentes, R. & Tomer, A. (2009). "The Road Less Travelled: An Analysis of Vehicle Miles Traveled Trends in the U.S. Metropolitan Infrastructure Initiatives Series". Brookings Institution, Washington DC. Archived from the original on 16 July 2011. An analysis at the national, state, and metropolitan levels of changing driving patterns, measured by Vehicle Miles Traveled (VMT) primarily between 1991 and 2008, reveals that: Driving, as measured by national VMT, began to plateau as far back as 2004 and dropped in 2007 for the first time since 1980, per capita driving followed a similar pattern, with flat-lining growth after 2000 and falling rates since 2005. These recent declines in driving predated the steady hikes in gas prices during 2007 and 2008.
This page is based on this Wikipedia article Text is available under the CC BY-SA 4.0 license; additional terms may apply. Images, videos and audio are available under their respective licenses.