Export Land Model

Last updated

The Export Land Model, or Export-Land Model, refers to work done by Dallas geologist Jeffrey Brown, building on the work of others, and discussed widely on The Oil Drum. [1] It models the decline in oil exports that result when an exporting nation experiences both a peak in oil production and an increase in domestic oil consumption. In such cases, exports decline at a far faster rate than the decline in oil production alone.

Contents

The Export Land Model is important to petroleum importing nations because when the rate of global petroleum production peaks and begins to decline, the petroleum available on the world market will decline much more steeply than the decline in total production.

Theory

As world oil exports approach (or pass) a global peak, the price of exported oil increases and further stimulates domestic economic growth and oil consumption in Export-Land countries, creating a positive feedback process between declining exports and higher prices. Eventually, however, the level of export decline outpaces the increasing oil price, slowing domestic growth. In some cases, an Export Land eventually becomes a net importer. It is unlikely that an Export Land would constrain domestic consumption to help importing countries. In fact, many oil exporting countries subsidize domestic consumption below price levels defined by the world market.

Hypothetical example

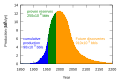
Given a hypothetical oil producing country (known by the model as an Export Land) that produces 2 Mbbl/d (320,000 m3/d), consumes 1 Mbbl/d (160,000 m3/d), and exports 1 Mbbl/d (160,000 m3/d) to oil consuming countries around the world, the model would be applied as such (illustrated in the graph above):

Export Land hits the point of Peak Oil production, and over a five-year period production drops by 25%. Over the same time period, Export Land's consumption increases by 20% to 1.2 mbpd. This causes Export Land's net exports over the five-year period to fall from 1 mbpd to 0.3 mbpd, a decrease of 70% -- resulting from a combination of increasing domestic consumption in Export Land and a 25% drop in production. Counter-intuitively, the fractional decline in exports is much greater than the sum of the fractional increase in domestic consumption and the fractional decline in production.

Real-world examples

5-years change in production and consumption from 11 Export Land countries. [2] [3] Figures in thousand barrels/day.
CountryProductionConsumptionnet exports [4]
200220072002200720022007
Argentina 806698364492442206
Bahrain 494823352514
Colombia 601561222228379333
Egypt 75171053465121759
Indonesia 128996911371157152-188
Malaysia 757755489514268241
Syria 548394256262292132
Turkmenistan 1921807811711462
Vietnam 33935019229414656
Yemen 438360112143326217

Several real-world nations exhibit the characteristics of the Export Land Model as pictured in the image gallery above. These four nations exhibit increasing domestic consumption along with declining production. Indonesia has already shifted from oil exporter to oil importer while Egypt is hovering on the brink. Malaysia and Mexico also have the hallmarks of the Export Land Model.

Within 5 years, Mexico (the second biggest exporter of oil to the US) may become a net oil importer. Other nations where this may soon happen include Iran, Algeria and Malaysia. [5]

A recent report from CIBC World Markets also indicates that as much as 40% of Saudi Arabia's expected production increases will be offset by rising internal demand by 2010, and Iranian exports will decline by more than 50% for similar reasons. This report indicates that similar market pressures could reduce net worldwide oil exports by 2.5 million barrels per day (400,000 m3/d) (about 3%). [5]

Nations may also reach their peak of oil production without fitting the Export Land model. For example, the United Kingdom began importing oil in 2006, after decades of exporting, due to declining production. But as domestic consumption in the UK has remained essentially unchanged for the last 20 years, their rising import levels essentially match their falling production levels. Similarly, Norway's exports began declining in 2001, but at the same rate as their production because their domestic consumption was also not growing. Unlike many exporters, these two countries don't subsidize local market oil price and have high fuel prices by world standards, [6] thus one of the premises of the export land model (that domestic consumption should not be affected by world market price)[ citation needed ] does not apply to those countries.

See also

Related Research Articles

Petroleum Naturally occurring hydrocarbon liquid found underground

Petroleum is a naturally occuring, yellowish-black liquid found in geological formations beneath the Earth's surface. It is commonly refined into various types of fuels. Components of petroleum are separated using a technique called fractional distillation, i.e. separation of a liquid mixture into fractions differing in boiling point by means of distillation, typically using a fractionating column.

2000s energy crisis oil crisis

From the mid-1980s to September 2003, the inflation-adjusted price of a barrel of crude oil on NYMEX was generally under US$25/barrel. During 2003, the price rose above $30, reached $60 by 11 August 2005, and peaked at $147.30 in July 2008. Commentators attributed these price increases to many factors, including Middle East tension, soaring demand from China, the falling value of the U.S. dollar, reports showing a decline in petroleum reserves, worries over peak oil, and financial speculation.

Energy policy of the United States Where and how the United States gets electrical and other power

The energy policy of the United States is determined by federal, state, and local entities in the United States, which address issues of energy production, distribution, and consumption, such as building codes and gas mileage standards. Energy policy may include legislation, international treaties, subsidies and incentives to investment, guidelines for energy conservation, taxation and other public policy techniques.

Price of oil Spot price of a barrel of benchmark crude oil

The price of oil, or the oil price, generally refers to the spot price of a barrel of benchmark crude oil—a reference price for buyers and sellers of crude oil such as West Texas Intermediate (WTI), Brent Crude, Dubai Crude, OPEC Reference Basket, Tapis Crude, Bonny Light, Urals oil, Isthmus and Western Canadian Select (WCS). There is a differential in the price of a barrel of oil based on its grade—determined by factors such as its specific gravity or API and its sulfur content—and its location—for example, its proximity to tidewater and/or refineries. Heavier, sour crude oils lacking in tidewater access—such as Western Canadian Select—are less expensive than lighter, sweeter oil—such as WTI.

Energy in the United States Energy

Energy in the United States comes mostly from fossil fuels: in 2010, data showed that 25% of the nation's energy originates from petroleum, 22% from coal, and 22% from natural gas. Nuclear energy supplied 8.4% and renewable energy supplied 8%, mainly from hydroelectric dams and biomass; however, this also includes other renewable sources like wind, geothermal, and solar.

United States energy independence

US energy independence relates to the goal of reducing the United States imports of petroleum and other foreign sources of energy. Energy independence is espoused by those who want to leave the US unaffected by global energy supply disruptions, and to restrict reliance upon politically unstable states for its energy security. Energy independence is highly concerned with oil, the source of the country's principal transport fuels.

Energy in Iran

Energy in Iran describes energy and electricity production, consumption, import and export in Iran. Iran has the fourth largest oil reserves and the largest natural gas reserves in the world.

According to M. King Hubbert's Hubbert peak theory, peak gas is the point in time at which the maximum global natural gas production rate will be reached, after which the rate of production will enter its terminal decline. Natural gas is a fossil fuel formed from plant matter over the course of millions of years. It is a finite resource and thus considered to be a non-renewable energy source.

Predicting the timing of peak oil

Peak oil is the point at which oil production, sometimes including unconventional oil sources, hits its maximum. Predicting the timing of peak oil involves estimation of future production from existing oil fields as well as future discoveries. The most influential production model is Hubbert peak theory, first proposed in the 1950s. The effect of peak oil on the world economy remains controversial.

1980s oil glut oversupply of oil in the 1980s

The 1980s oil glut was a serious surplus of crude oil caused by falling demand following the 1970s energy crisis. The world price of oil had peaked in 1980 at over US$35 per barrel ; it fell in 1986 from $27 to below $10. The glut began in the early 1980s as a result of slowed economic activity in industrial countries due to the crises of the 1970s, especially in 1973 and 1979, and the energy conservation spurred by high fuel prices. The inflation-adjusted real 2004 dollar value of oil fell from an average of $78.2 in 1981 to an average of $26.8 per barrel in 1986.

Petroleum in the United States

Petroleum in the United States has been a major industry since shortly after the oil discovery in the Oil Creek area of Titusville, Pennsylvania in 1859. The petroleum industry includes exploration for, production, processing (refining), transportation, and marketing of natural gas and petroleum products. As of 2019, the U.S. is the world's largest oil producer. The leading oil-producing area in the United States in 2014 was Texas, followed by the federal zone of the Gulf of Mexico, followed by North Dakota and California.

Oil reserves in Saudi Arabia oil reserves located in Saudi Arabia

The proven oil reserves in Saudi Arabia are the 2nd largest in the world, estimated to be 268 billion barrels, including 2.5 Gbbl in the Saudi–Kuwaiti neutral zone. They are predominantly found in the Eastern Province. These reserves were the largest in the world until Venezuela announced they had increased their proven reserves to 297 Gbbl in January 2011. The Saudi reserves are about one-fifth of the world's total conventional oil reserves, a large fraction of these reserves comes from a small number of very large oil fields, and past production amounts to 40% of the stated reserves.

Oil reserves in the United States Oil reserves located in the USA

Proven oil reserves in the United States were 36.4 billion barrels of crude oil as of the end of 2014, excluding the Strategic Petroleum Reserve. The 2014 reserves represent the largest US proven reserves since 1972, and a 90% increase in proved reserves since 2008. The Energy Information Administration estimates US undiscovered, technically recoverable oil resources to be an additional 198 billion barrels.

Energy security of the People's Republic of China concerns the need for the People's Republic of China to guarantee itself and its industries long- term access to sufficient energy and raw materials. China has been endeavoring to sign international agreements and secure such supplies; its energy security involves the internal and foreign energy policy of China. Currently, China's energy portfolio consists mainly of domestic coal, oil and gas from domestic and foreign sources, and small quantities of uranium. China has also created a strategic petroleum reserve, to secure emergency supplies of oil for temporary price and supply disruptions. Chinese policy focuses on diversification to reduce oil imports, which rely almost exclusively on producers in the Middle East.

1970s energy crisis Petroleum shortages

The 1970s energy crisis occurred when the Western world, particularly the United States, Canada, Western Europe, Australia, and New Zealand, faced substantial petroleum shortages, real and perceived, as well as elevated prices. The two worst crises of this period were the 1973 oil crisis and the 1979 energy crisis, when the Yom Kippur War and the Iranian Revolution triggered interruptions in Middle Eastern oil exports.

Petroleum industry in Iran petroleum industry in the country Iran

For the economic effects refer to Economy of Iran.

Petroleum refining in the United States

Petroleum refining in the United States in 2013 produced 18.9 million barrels per day of refined petroleum products, more than any other country. Although the US was the world's largest net importer of refined petroleum products as recently as 2008, the US became a net exporter in 2010, and in 2014 was the largest exporter and the largest net exporter of refined petroleum. As of January 2018, there were 135 operating refineries in the US, distributed among 30 states.

Natural gas in the United States

Natural gas was the United States' largest source of energy production in 2016, representing 33 percent of all energy produced in the country. Natural gas has been the largest source of electrical generation in the United States since July 2015.

The petroleum industry in Syria forms a major part of the economy of Syria. According to the International Monetary Fund, before the Syrian Civil War, oil sales for 2010 were projected to generate $3.2 billion for the Syrian government and accounted for 25.1% of the state's revenue.

The oil and gas industry in India dates back to 1889 when the first oil deposits in the country were discovered near the town of Digboi in the state of Assam. The natural gas industry in India began in the 1960s with the discovery of gas fields in Assam and Gujarat. As on 31 March 2018, India had estimated crude oil reserves of 594.49 million tonnes (MT) and natural gas reserves of 1339.57 billion cubic meters (BCM).

References

  1. Export Land Model discussion archive. TheOilDrum.com.
  2. All figure from BP statistical review 2008
  3. [EIA http://tonto.eia.doe.gov/country/country_energy_data.cfm?fips=YM Archived 2011-01-10 at the Wayback Machine ]
  4. Defined as the difference between all liquids production and consumption, may be different from physical flows.
  5. 1 2 Clifford Krauss (2007-12-09). "Oil-Rich Nations Use More Energy, Cutting Exports". The New York Times .
  6. [Gas price from around the world http://www.dailyfueleconomytip.com/oil-prices/gas-prices-from-around-the-world-2/]