Traffic comprises pedestrians, vehicles, ridden or herded animals, trains, and other conveyances that use public ways (roads) for travel and transportation.

A ramp meter, ramp signal, or metering light is a device, usually a basic traffic light or a two-section signal light together with a signal controller, that regulates the flow of traffic entering freeways according to current traffic conditions. Ramp meters are used at freeway on-ramps to manage the rate of automobiles entering the freeway. Ramp metering systems have proved to be successful in decreasing traffic congestion and improving driver safety.

Traffic engineering is a branch of civil engineering that uses engineering techniques to achieve the safe and efficient movement of people and goods on roadways. It focuses mainly on research for safe and efficient traffic flow, such as road geometry, sidewalks and crosswalks, cycling infrastructure, traffic signs, road surface markings and traffic lights. Traffic engineering deals with the functional part of transportation system, except the infrastructures provided.

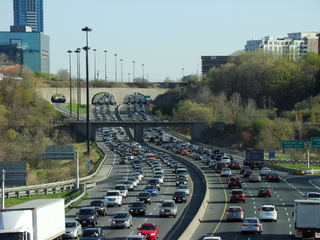
Traffic congestion is a condition in transport that is characterized by slower speeds, longer trip times, and increased vehicular queueing. Traffic congestion on urban road networks has increased substantially since the 1950s. When traffic demand is great enough that the interaction between vehicles slows the traffic stream, this results in congestion. While congestion is a possibility for any mode of transportation, this article will focus on automobile congestion on public roads.
Level of service (LOS) is a qualitative measure used to relate the quality of motor vehicle traffic service. LOS is used to analyze roadways and intersections by categorizing traffic flow and assigning quality levels of traffic based on performance measure like vehicle speed, density, congestion, etc. In a more general sense, levels of service can apply to all services in asset management domain.

In road transport, a lane is part of a roadway that is designated to be used by a single line of vehicles to control and guide drivers and reduce traffic conflicts. Most public roads (highways) have at least two lanes, one for traffic in each direction, separated by lane markings. On multilane roadways and busier two-lane roads, lanes are designated with road surface markings. Major highways often have two multi-lane roadways separated by a median.
In mathematics and transportation engineering, traffic flow is the study of interactions between travellers and infrastructure, with the aim of understanding and developing an optimal transport network with efficient movement of traffic and minimal traffic congestion problems.

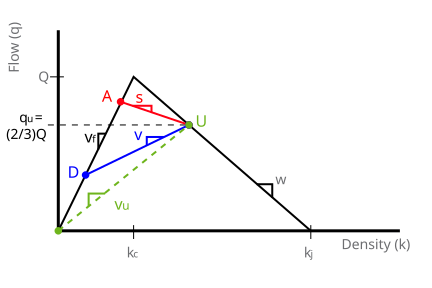
Three-phase traffic theory is a theory of traffic flow developed by Boris Kerner between 1996 and 2002. It focuses mainly on the explanation of the physics of traffic breakdown and resulting congested traffic on highways. Kerner describes three phases of traffic, while the classical theories based on the fundamental diagram of traffic flow have two phases: free flow and congested traffic. Kerner’s theory divides congested traffic into two distinct phases, synchronized flow and wide moving jam, bringing the total number of phases to three:
Boris S. Kerner is a German physicist and civil engineer who created three phase traffic theory. The three phase traffic theory is the framework for the description of empirical vehicular traffic states in three traffic phases: (i) free traffic flow (F), (ii) synchronized traffic flow (S), and (iii) wide moving jam (J). The synchronized traffic flow and wide moving jam phases belong to congested traffic.

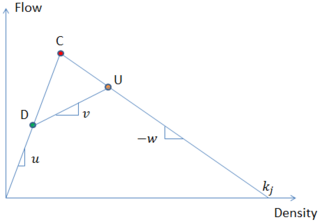
The fundamental diagram of traffic flow is a diagram that gives a relation between road traffic flux (vehicles/hour) and the traffic density (vehicles/km). A macroscopic traffic model involving traffic flux, traffic density and velocity forms the basis of the fundamental diagram. It can be used to predict the capability of a road system, or its behaviour when applying inflow regulation or speed limits.

Active traffic management is a method of increasing peak capacity and smoothing traffic flows on busy major highways. Techniques include variable speed limits, hard-shoulder running and ramp-metering controlled by overhead variable message signs. It has been implemented in several countries, including Germany, the United Kingdom, Canada and the United States.
In traffic flow theory, Newell’s car-following model is a method used to determine how vehicles follow one another on a roadway. The main idea of this model is that a vehicle will maintain a minimum space and time gap between it and the vehicle that precedes it. Thus, under congested conditions, if the leading car changes its speed, the following vehicle will also change speed at a point in time-space along the traffic wave speed, -w.

Traffic simulation or the simulation of transportation systems is the mathematical modeling of transportation systems through the application of computer software to better help plan, design, and operate transportation systems. Simulation of transportation systems started over forty years ago, and is an important area of discipline in traffic engineering and transportation planning today. Various national and local transportation agencies, academic institutions and consulting firms use simulation to aid in their management of transportation networks.
The Three-detector problem is a problem in traffic flow theory. Given is a homogeneous freeway and the vehicle counts at two detector stations. We seek the vehicle counts at some intermediate location. The method can be applied to incident detection and diagnosis by comparing the observed and predicted data, so a realistic solution to this problem is important. Newell G.F. proposed a simple method to solve this problem. In Newell's method, one gets the cumulative count curve (N-curve) of any intermediate location just by shifting the N-curves of the upstream and downstream detectors. Newell's method was developed before the variational theory of traffic flow was proposed to deal systematically with vehicle counts. This article shows how Newell's method fits in the context of variational theory.
Cell Transmission Model (CTM) is a popular numerical method proposed by Carlos Daganzo to solve the kinematic wave equation. Lebacque later showed that CTM is the first order discrete Godunov approximation.
Truck lane restriction within transportation traffic engineering, is a factor impacting freeway truck lanes and traffic congestion. In traffic flow theory, intuitively, slow vehicles will cause queues behind them, but how it relates to the kinematic wave theory was not revealed until Newell. Leclercq et al did a complete review of Newell's theory. In addition to the simulation models developed by Laval and Daganzo on the basis of numerical solution methods for Newell's theory to capture the impacts of slow vehicle, Laval also mathematically derived the analytical capacity formulas for bottlenecks caused by single-type of trucks for multi-lane freeway segments.

Vehicular traffic can be either free or congested. Traffic occurs in time and space, i.e., it is a spatiotemporal process. However, usually traffic can be measured only at some road locations. For efficient traffic control and other intelligent transportation systems, the reconstruction of traffic congestion is necessary at all other road locations at which traffic measurements are not available. Traffic congestion can be reconstructed in space and time based on Boris Kerner’s three-phase traffic theory with the use of the ASDA and FOTO models introduced by Kerner. Kerner's three-phase traffic theory and, respectively, the ASDA/FOTO models are based on some common spatiotemporal features of traffic congestion observed in measured traffic data.
Sidra Intersection is a software package used for intersection (junction), interchange and network capacity, level of service and performance analysis, and signalised intersection, interchange and network timing calculations by traffic design, operations and planning professionals.
Terminology related to road transport—the transport of passengers or goods on paved routes between places—is diverse, with variation between dialects of English. There may also be regional differences within a single country, and some terms differ based on the side of the road traffic drives on. This glossary is an alphabetical listing of road transport terms.

A managed lane is a type of highway lane that is operated with a management scheme, such as lane use restrictions or variable tolling, to optimize traffic flow, vehicle throughput, or both. Definitions and goals vary among transport agencies, but managed lanes are generally implemented to achieve an improved operational condition on a highway, such as improving traffic speed and throughput, reducing air pollution, and improving safety. Types of managed lanes include high-occupancy vehicle (HOV) lanes, high-occupancy toll lanes, express toll lanes, reversible lanes, and bus lanes. Most managed lane facilities are located in the United States and Canada, although HOV and bus lanes can be found in many other countries; outside of the US and Canada, many countries use active traffic management that manage all lanes of a highway.