| |||||||||||||||||||||||||||||||||||||||||||||||||||||||||||||||||
13 out of 36 seats to Exeter City Council 19 seats needed for a majority | |||||||||||||||||||||||||||||||||||||||||||||||||||||||||||||||||
|---|---|---|---|---|---|---|---|---|---|---|---|---|---|---|---|---|---|---|---|---|---|---|---|---|---|---|---|---|---|---|---|---|---|---|---|---|---|---|---|---|---|---|---|---|---|---|---|---|---|---|---|---|---|---|---|---|---|---|---|---|---|---|---|---|---|
| |||||||||||||||||||||||||||||||||||||||||||||||||||||||||||||||||
| |||||||||||||||||||||||||||||||||||||||||||||||||||||||||||||||||
The 1996 Exeter City Council election took place on 2 May 1996 to elect members of Exeter City Council in Devon, England. [1] This was on the same day as other local elections.
| |||||||||||||||||||||||||||||||||||||||||||||||||||||||||||||||||
13 out of 36 seats to Exeter City Council 19 seats needed for a majority | |||||||||||||||||||||||||||||||||||||||||||||||||||||||||||||||||
|---|---|---|---|---|---|---|---|---|---|---|---|---|---|---|---|---|---|---|---|---|---|---|---|---|---|---|---|---|---|---|---|---|---|---|---|---|---|---|---|---|---|---|---|---|---|---|---|---|---|---|---|---|---|---|---|---|---|---|---|---|---|---|---|---|---|
| |||||||||||||||||||||||||||||||||||||||||||||||||||||||||||||||||
| |||||||||||||||||||||||||||||||||||||||||||||||||||||||||||||||||
The 1996 Exeter City Council election took place on 2 May 1996 to elect members of Exeter City Council in Devon, England. [1] This was on the same day as other local elections.
At the election, the Labour Party gained an overall majority on the council, while the Conservatives suffered their biggest loss of seats in a single election since the local government re-organisation in 1974, with a net loss of eight seats.
Despite improvements in the popular vote (where they came second) and in marginal wards, the Conservatives fell to a record low of two seats and ended up in fourth place, behind the Liberal Party.
Both the Liberal Democrats and Liberal Party made minor gains, each winning an extra seat and obtaining a higher or similar share of the popular vote than the 1995 election. The Liberal Democrats became the official opposition for the first time.
| 1996 Exeter City Council election | ||||||||||
|---|---|---|---|---|---|---|---|---|---|---|
| Party | This election | Full council | This election | |||||||
| Seats | Net | Seats % | Other | Total | Total % | Votes | Votes % | +/− | ||
| Labour | 9 | 69.2 | 15 | 24 | 66.7 | 11,713 | 45.9 | –6.1 | ||
| Liberal Democrats | 3 | 23.1 | 4 | 7 | 19.4 | 5,423 | 21.2 | ±0.0 | ||
| Liberal | 1 | 7.7 | 2 | 3 | 8.3 | 1,717 | 6.7 | +2.3 | ||
| Conservative | 0 | 0.0 | 2 | 2 | 5.6 | 6,036 | 23.6 | +5.7 | ||
| Green | 0 | 0.0 | 0 | 0 | 0.0 | 610 | 2.4 | +0.5 | ||
| Independent | 0 | 0.0 | 0 | 0 | 0.0 | 31 | 0.1 | N/A | ||
| Party | Candidate | Votes | % | ±% | |
|---|---|---|---|---|---|
| Liberal Democrats | P. Smith | 1,156 | 48.6 | –12.7 | |
| Labour | R. Mathers | 702 | 29.5 | +4.8 | |
| Conservative | M. Jordan | 469 | 19.7 | +8.3 | |
| Green | R. Gittens | 54 | 2.3 | +0.5 | |
| Majority | 454 | 19.1 | –17.5 | ||
| Turnout | 2,381 | 39.7 | –7.7 | ||
| Registered electors | 6,033 | ||||
| Liberal Democrats hold | Swing | ||||
| Party | Candidate | Votes | % | ||
|---|---|---|---|---|---|
| Labour | B. McNamara* | 1,032 | 54.6 | ||
| Labour | C. McNamara | 966 | 51.1 | ||
| Liberal | H. Alford | 495 | 26.2 | ||
| Liberal | V. Iiolt | 419 | 22.2 | ||
| Conservative | A. Leadbetter | 308 | 16.3 | ||
| Conservative | D. Yeld | 259 | 13.7 | ||
| Liberal Democrats | G. Philpotts | 89 | 4.7 | ||
| Liberal Democrats | T. Revesz | 57 | 3.0 | ||
| Turnout | 1,889 | 46.9 | |||
| Registered electors | 4,028 | ||||
| Labour gain from Conservative | |||||
| Labour hold | |||||
| Party | Candidate | Votes | % | ±% | |
|---|---|---|---|---|---|
| Labour | G. Sheldon | 886 | 50.0 | +8.6 | |
| Conservative | A. Stilliard | 561 | 31.7 | –5.1 | |
| Liberal Democrats | S. Barrett | 270 | 15.2 | –2.2 | |
| Liberal | M. Berry | 54 | 3.0 | +0.5 | |
| Majority | 325 | 18.4 | +13.7 | ||
| Turnout | 1,771 | 50.2 | –9.3 | ||
| Registered electors | 3,566 | ||||
| Labour gain from Conservative | Swing | ||||
| Party | Candidate | Votes | % | ±% | |
|---|---|---|---|---|---|
| Labour | B. Robson | 1,161 | 61.3 | –5.3 | |
| Conservative | E. Knapp* | 513 | 27.1 | +6.1 | |
| Liberal Democrats | M. Pack | 219 | 11.6 | –0.8 | |
| Majority | 648 | 34.2 | –11.3 | ||
| Turnout | 1,893 | 44.3 | –4.1 | ||
| Registered electors | 4,330 | ||||
| Labour gain from Conservative | Swing | ||||
| Party | Candidate | Votes | % | ±% | |
|---|---|---|---|---|---|
| Labour | H. Slack | 1,473 | 71.9 | +5.4 | |
| Liberal Democrats | T. Thompson | 270 | 13.2 | –5.3 | |
| Conservative | T. Porter | 264 | 12.9 | +1.4 | |
| Green | B. Packer | 43 | 2.1 | –1.4 | |
| Majority | 1,203 | 58.7 | +10.7 | ||
| Turnout | 2,050 | 35.2 | –6.0 | ||
| Registered electors | 5,915 | ||||
| Labour hold | Swing | ||||
| Party | Candidate | Votes | % | ±% | |
|---|---|---|---|---|---|
| Liberal | D. Morrish | 749 | 36.9 | N/A | |
| Labour | D. Perrin | 568 | 28.0 | –8.8 | |
| Liberal Democrats | A. Williamson | 440 | 21.7 | –20.0 | |
| Conservative | C. Hodgson | 244 | 12.0 | –6.1 | |
| Green | S. Pfeiffer | 30 | 1.5 | –1.9 | |
| Majority | 181 | 8.9 | N/A | ||
| Turnout | 2,031 | 47.5 | +1.9 | ||
| Registered electors | 4,304 | ||||
| Liberal gain from Conservative | |||||
| Party | Candidate | Votes | % | ±% | |
|---|---|---|---|---|---|
| Liberal Democrats | D. Treharne | 871 | 42.2 | –16.0 | |
| Conservative | S. Syvret* | 672 | 32.6 | +10.1 | |
| Labour | C. Boyle | 440 | 21.3 | +5.6 | |
| Green | T. Brenan | 80 | 3.9 | +0.3 | |
| Majority | 199 | 9.6 | –26.1 | ||
| Turnout | 2,063 | 42.2 | –7.0 | ||
| Registered electors | 4,937 | ||||
| Liberal Democrats gain from Conservative | Swing | ||||
| Party | Candidate | Votes | % | ±% | |
|---|---|---|---|---|---|
| Labour | V. Dixon | 1,126 | 53.1 | +3.7 | |
| Conservative | J. Landers* | 672 | 37.6 | +7.8 | |
| Liberal Democrats | A. Vokes | 174 | 8.2 | –10.9 | |
| Green | S. Dunstan | 23 | 1.1 | –0.6 | |
| Majority | 454 | 15.5 | –11.3 | ||
| Turnout | 1,995 | 53.9 | –3.5 | ||
| Registered electors | 3,967 | ||||
| Labour gain from Conservative | Swing | ||||
| Party | Candidate | Votes | % | ±% | |
|---|---|---|---|---|---|
| Labour | M. Mills | 709 | 43.0 | –0.7 | |
| Conservative | Y. Henson* | 648 | 39.3 | +19.1 | |
| Liberal Democrats | A. Vokes | 174 | 8.2 | –17.5 | |
| Green | T. Canning | 69 | 4.2 | –0.8 | |
| Independent | K. Needs | 31 | 1.9 | N/A | |
| Majority | 61 | 3.7 | –12.3 | ||
| Turnout | 1,631 | 39.7 | –10.5 | ||
| Registered electors | 4,153 | ||||
| Labour gain from Conservative | Swing | ||||
| Party | Candidate | Votes | % | ±% | |
|---|---|---|---|---|---|
| Labour | R. Slack* | 1,124 | 64.3 | +6.5 | |
| Conservative | G. Williams | 336 | 19.2 | +2.9 | |
| Liberal Democrats | J. Bahrij | 176 | 10.1 | –9.6 | |
| Green | A. Thomas | 111 | 6.4 | +0.3 | |
| Majority | 788 | 45.1 | +7.0 | ||
| Turnout | 1,747 | 35.6 | –12.3 | ||
| Registered electors | 4,927 | ||||
| Labour hold | Swing | ||||
| Party | Candidate | Votes | % | ±% | |
|---|---|---|---|---|---|
| Labour | M. Griffiths | 939 | 40.1 | +3.9 | |
| Liberal Democrats | A. Hoey | 848 | 36.2 | +0.8 | |
| Conservative | G. Gooding | 442 | 18.9 | –4.6 | |
| Green | P. Edwards | 115 | 4.9 | ±0.0 | |
| Majority | 91 | 3.9 | +3.1 | ||
| Turnout | 2,344 | 36.9 | –11.4 | ||
| Registered electors | 6,389 | ||||
| Labour gain from Conservative | Swing | ||||
| Party | Candidate | Votes | % | ±% | |
|---|---|---|---|---|---|
| Liberal Democrats | P. Davies | 679 | 34.0 | –15.9 | |
| Conservative | N. Shiel* | 648 | 32.4 | +11.3 | |
| Labour | V. Vincent | 587 | 29.4 | +5.3 | |
| Green | K. Morris | 85 | 4.3 | N/A | |
| Majority | 31 | 1.6 | –24.3 | ||
| Turnout | 1,999 | 42.9 | –10.7 | ||
| Registered electors | 4,700 | ||||
| Liberal Democrats hold | Swing | ||||

The 2007 United Kingdom local elections were held on Thursday 3 May 2007. These elections took place in most of England and all of Scotland. There were no local government elections in Wales though the Welsh Assembly had a general election on the same day. There were no local government elections in Northern Ireland. Just over half of English councils and almost all the Scottish councils began the counts on Friday, rather than Thursday night, because of more complex arrangements regarding postal votes.
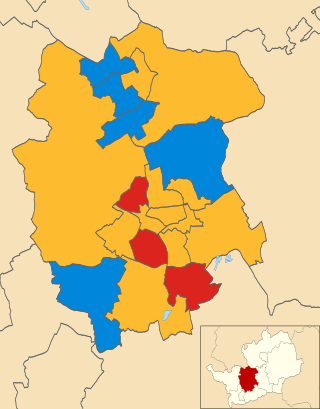
The 2003 St Albans City and District Council election took place on 1 May 2003 to elect members of St Albans District Council in Hertfordshire, England. One third of the council was up for election and the council stayed under no overall control.

The 2004 St Albans City and District Council election took place on 10 June 2004 to elect members of St Albans District Council in Hertfordshire, England. One third of the council was up for election and the council stayed under no overall control.

The 2008 Stratford-on-Avon District Council election took place on 1 May 2008 to elect members of Stratford-on-Avon District Council in Warwickshire, England. One third of the council was up for election and the Conservative Party stayed in overall control of the council.
The 2000 Oldham Council election took place on 4 May 2000 to elect members of Oldham Metropolitan Borough Council in Greater Manchester, England. One third of the council was up for election and the Liberal Democrats gained overall control of the council from the Labour Party.
The 1991 United Kingdom local elections were held on Thursday 2 May 1991. The results were a setback for the governing Conservative Party, who were left with their lowest number of councillors since 1973, though their popular vote was an improvement from the 1990 local elections.

The 2006 Solihull Metropolitan Borough Council election took place on 4 May 2006 to elect members of Solihull Metropolitan Borough Council in the West Midlands, England. One third of the council was up for election and the Conservative Party stayed in overall control of the council.
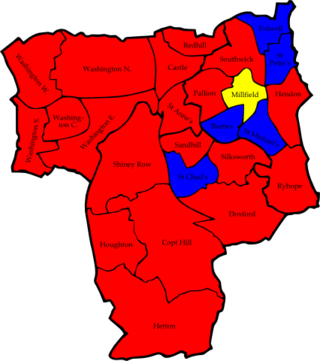
The 2006 Sunderland Council election took place on 4 May 2006 to elect members of Sunderland City Council in Tyne and Wear, England. One third of the Council was up for election and the Labour Party stayed in overall control.

Elections to Cannock Chase District Council took place on 5 May 2011 on the same day as other local elections in England and the Alternative Vote referendum. A total of 15 councillors were elected from all of the council's wards as a third of the council was up for election.

Elections to Norwich City Council took place on 3 May 2012, the same day as other 2012 United Kingdom local elections. Fifteen out of thirty-nine council seats were up for election and the Labour Party gained control of the council from No Overall Control.

The 2000 Colchester Borough Council election took place on 4 May 2000 to elect members of Colchester Borough Council in Essex, England. One third of the council was up for election and the council stayed under no overall control.
The 1998 Hackney London Borough Council election took place on 7 May 1998. All 60 members of Hackney London Borough Council were up for election. The elections took place as part of the 1998 London local elections.

The 2016 Exeter City Council election took place on 5 May 2016, to elect members of Exeter City Council in England. Following boundary changes, the entire council was up for election, and all 13 wards were contested, each electing three councillors. The election was held concurrently with other local elections held in England on the 5 May.

The 2018 United Kingdom local elections were held on Thursday 3 May 2018, with local council elections taking place in all 32 London boroughs, 34 metropolitan boroughs, 67 district and borough councils and 17 unitary authorities. There were also direct elections for the mayoralties of Hackney, Lewisham, Newham, Tower Hamlets and Watford.

Elections to Portsmouth City Council took place on Thursday 2 May 2019, alongside other local elections across the country. The seats contested in this election were last contested in 2015. The Conservative Party had 8 seats they were defending, the Liberal Democrats 5 and Labour 1 seat. A by-election occurred within the vacant Cosham seat from last years election, due to the sitting Conservative standing down. No party gained a majority from this election, and therefore the council remains under no overall control.

Elections to Welwyn Hatfield Borough Council took place on 6 May 2021. This was on the same day as other local elections across the United Kingdom.

The 2022 Sunderland City Council election took place on 5 May 2022 to elect members of Sunderland City Council. This is on the same day as other elections across the United Kingdom.

The 2022 Fareham Borough Council election took place on 5 May 2022 to elect members of Fareham Borough Council. This was on the same day as other local elections. 16 of the 31 seats were up for election.

Elections to Aberdeen City Council took place on 5 May 2022 on the same day as the 31 other Scottish local government elections. As with other Scottish council elections, it was held using single transferable vote (STV) – a form of proportional representation – in which multiple candidates are elected in each ward and voters rank candidates in order of preference.
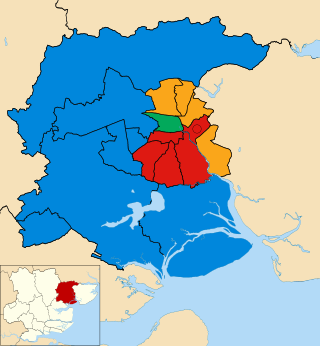
The 2024 Colchester City Council election took place on 2 May 2024 alongside other local elections across England. Eighteen members of the council were elected, one from each of the wards, with an additional by-election in Greenstead ward.