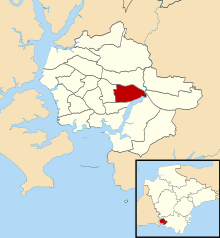
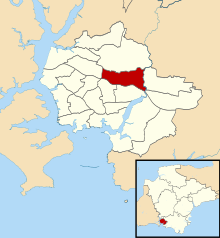
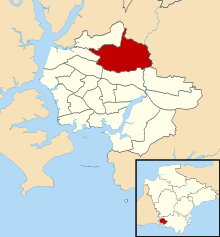
| |||||||||||||||||||||||||
All 60 seats in the Plymouth City Council 31 seats needed for a majority | |||||||||||||||||||||||||
---|---|---|---|---|---|---|---|---|---|---|---|---|---|---|---|---|---|---|---|---|---|---|---|---|---|
| |||||||||||||||||||||||||
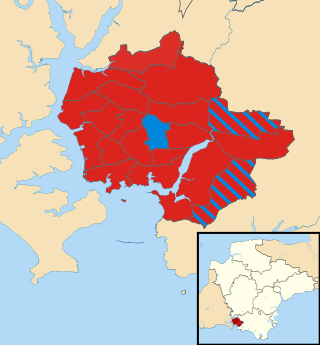
Map showing the results of the 2000 Plymouth City Council elections. | |||||||||||||||||||||||||
|
The 2000 Plymouth City Council election was held on 4 May 2000 to elect members of Plymouth City Council in England. This was on the same day as the other local elections. The entire council was up for election and the Conservative Party gained control of the council from the Labour Party. [2]
Party | Seats | Gains | Losses | Net gain/loss | Seats % | Votes % | Votes | +/− | |
---|---|---|---|---|---|---|---|---|---|
Conservative | 38 | 26 | 0 | 26 | 65.0 | 48.1 | 29,644 | 15.3 | |
Labour | 22 | 0 | 26 | 26 | 35.0 | 35.9 | 22,115 | 12.2 | |
Liberal Democrats | 0 | 0 | 0 | 0.0 | 14.6 | 8,992 | 2.7 | ||
Independent | 0 | 0 | 0 | 0.0 | 0.2 | 128 | 0.9 | ||
Green | 0 | 0 | 0 | 0.0 | 0.5 | 308 | 0.3 | ||
Liberal | 0 | 0 | 0 | 0.0 | 0.5 | 313 | New | ||
Independent Democrat | 0 | 0 | 0 | 0.0 | 0.2 | 143 | 0.5 | ||
Total | 60 | 61,643 |
Party | Candidate | Votes | % | |
---|---|---|---|---|
Labour | Ronald Simmonds | 1,134 | ||
Labour | Paul Carter | 1,105 | ||
Labour | Thomas Coleman | 1,079 | ||
Conservative | N. Milne | 708 | ||
Conservative | J. White | 678 | ||
Conservative | E. Wright | 645 | ||
Liberal Democrats | S. Simmonds | 357 | ||
Turnout | 24.7% | |||
Labour hold | ||||
Labour hold | ||||
Labour hold | ||||
Party | Candidate | Votes | % | |
---|---|---|---|---|
Conservative | Albert Fry | 1,910 | ||
Conservative | David Stark | 1,887 | ||
Conservative | Thomas Savery | 1,886 | ||
Labour | M. Dax | 646 | ||
Labour | S. Orgill | 634 | ||
Labour | K. French | 586 | ||
Liberal Democrats | C. Richardson | 466 | ||
Liberal Democrats | R. Casley | 442 | ||
Liberal Democrats | M. Barriball | 439 | ||
Turnout | 35.5% | |||
Conservative hold | ||||
Party | Candidate | Votes | % | |
---|---|---|---|---|
Conservative | Karen Gillard | 1,190 | ||
Conservative | Colin Miles | 1,151 | ||
Conservative | Patrick Marshall | 1,123 | ||
Liberal Democrats | R. Bray | 1,049 | ||
Liberal Democrats | S. Luscombe | 989 | ||
Liberal Democrats | R. Egerton | 974 | ||
Labour | V. Hiromeris | 939 | ||
Labour | C. Childs | 907 | ||
Labour | G. Pettet | 903 | ||
Turnout | 29.5% | |||
Conservative gain from Labour | ||||
Party | Candidate | Votes | % | |
---|---|---|---|---|
Conservative | Michael Leaves | 1,353 | ||
Labour | Bernard Miller | 1,313 | ||
Conservative | Mary Orchard | 1,310 | ||
Labour | Jane Margaret Jones | 1,301 | ||
Labour | Brian Vincent | 1,278 | ||
Conservative | P. Rickard | 1,192 | ||
Liberal | R. Vosper | 326 | ||
Liberal Democrats | C. Curry | 313 | ||
Turnout | 33.1% | |||
Conservative gain from Labour | ||||
Labour hold | ||||
Conservative gain from Labour | ||||
Party | Candidate | Votes | % | |
---|---|---|---|---|
Conservative | Gloria Bragg | 1,894 | ||
Conservative | Michael Foster | 1,845 | ||
Conservative | Paul Rowe | 1,788 | ||
Labour | Derick Brian Bray | 1,605 | ||
Labour | Michael George Wright | 1,522 | ||
Labour | M. Robinson | 1,462 | ||
Liberal Democrats | R. Bellamy | 496 | ||
Turnout | 36.5% | |||
Conservative gain from Labour | ||||
Party | Candidate | Votes | % | |
---|---|---|---|---|
Conservative | Peter Brookshaw | 2,419 | ||
Conservative | Heather Ellis | 2,395 | ||
Conservative | Alexandra Sloggett | 2,254 | ||
Labour | L. Fone | 1,322 | ||
Labour | Michael Robert Fox | 1,294 | ||
Labour | P. Harvey | 1,164 | ||
Liberal Democrats | S. Hutty | 500 | ||
Turnout | 33.4% | |||
Conservative gain from Labour | ||||
Party | Candidate | Votes | % | |
---|---|---|---|---|
Labour | Tudor Evans | 1,150 | ||
Labour | Ian Gordon | 1,066 | ||
Labour | Christopher Pattison | 1,034 | ||
Conservative | D. Corry | 738 | ||
Conservative | R. McSweeney | 698 | ||
Conservative | M. White | 638 | ||
Liberal Democrats | M. Luscombe | 268 | ||
Independent Democrat | P. Stanner | 143 | ||
Turnout | 27.5% | |||
Labour hold | ||||
Labour hold | ||||
Labour hold | ||||
Party | Candidate | Votes | % | |
---|---|---|---|---|
Labour | Alan Ford | 1,306 | ||
Labour | Pauline Purnell | 1,206 | ||
Labour | Peter Smith | 1,174 | ||
Conservative | K. Foster | 915 | ||
Conservative | J. Wallace | 894 | ||
Conservative | R. Mahony | 881 | ||
Liberal Democrats | M. Bellamy | 389 | ||
Turnout | 27.0% | |||
Labour hold | ||||
Labour hold | ||||
Labour hold | ||||
Party | Candidate | Votes | % | |
---|---|---|---|---|
Labour | Howard Davey | 1,000 | ||
Labour | Steven Lemin | 981 | ||
Conservative | James Bell | 915 | ||
Labour | A. Stephens | 904 | ||
Conservative | D. Hooper | 903 | ||
Conservative | J. Ellis | 812 | ||
Liberal Democrats | M. Gallagher | 335 | ||
Turnout | 26.7% | |||
Labour hold | ||||
Labour hold | ||||
Conservative gain from Labour | ||||
Party | Candidate | Votes | % | |
---|---|---|---|---|
Conservative | Glenn Jordan | 867 | ||
Conservative | S. Bennett | 836 | ||
Labour | A. Hughes | 808 | ||
Conservative | J. Pritchard | 805 | ||
Labour | John Gerard Williams | 793 | ||
Labour | Edwin Shaun Rennie | 754 | ||
Liberal Democrats | A. Egerton | 482 | ||
Liberal Democrats | G. Nye | 456 | ||
Liberal Democrats | P. York | 449 | ||
Independent | C. Brown | 128 | ||
Turnout | 28.0% | |||
Conservative gain from Labour | ||||
Labour hold | ||||
Party | Candidate | Votes | % | |
---|---|---|---|---|
Conservative | Kathleen Banks | 2,400 | ||
Conservative | John Fox | 2,332 | ||
Conservative | David James | 2,299 | ||
Labour | S. Dann | 815 | ||
Labour | M. Hughes | 679 | ||
Liberal Democrats | K. Hill | 667 | ||
Labour | A. Mason | 658 | ||
Liberal Democrats | S. Jennett | 504 | ||
Liberal Democrats | J. Seed | 407 | ||
Turnout | 28.2% | |||
Conservative hold | ||||
Party | Candidate | Votes | % | |
---|---|---|---|---|
Conservative | Patrick Nicholson | 2,086 | ||
Conservative | Delia Ford | 2,011 | ||
Conservative | Maureen Lawley | 1,728 | ||
Labour | E. O'Hara | 733 | ||
Labour | F. Sheaff | 606 | ||
Labour | W. Wraight | 566 | ||
Liberal Democrats | A. Cains | 290 | ||
Liberal Democrats | V. Baharie | 267 | ||
Turnout | 36.2% | |||
Conservative hold | ||||
Party | Candidate | Votes | % | |
---|---|---|---|---|
Conservative | David Viney | 2,885 | ||
Conservative | Vivien Pengelly | 2,793 | ||
Conservative | Kevin Wigens | 2,669 | ||
Labour | J. Kirk | 1,032 | ||
Labour | V. Burns | 860 | ||
Labour | L. Stacey | 810 | ||
Liberal Democrats | J. Coker | 517 | ||
Liberal Democrats | P. Durrant | 495 | ||
Liberal Democrats | C. Burrows | 434 | ||
Turnout | 39.9% | |||
Conservative hold | ||||
Party | Candidate | Votes | % | |
---|---|---|---|---|
Conservative | Kenneth Foster | 1,907 | ||
Conservative | Wendy Foster | 1,872 | ||
Conservative | Michael Leaves | 1,786 | ||
Labour | R. Earl | 1,116 | ||
Labour | P. Allan | 908 | ||
Labour | J. Clynch | 883 | ||
Liberal Democrats | J. Byatt | 696 | ||
Liberal Democrats | M. Coker | 621 | ||
Liberal Democrats | A. Nelmes | 592 | ||
Turnout | 40.9% | |||
Conservative hold | ||||
Conservative gain from Labour | ||||
Party | Candidate | Votes | % | |
---|---|---|---|---|
Labour | Dennis Camp | 1,446 | ||
Conservative | Janice Harden | 1,399 | ||
Conservative | Graham Horler | 1,318 | ||
Labour | A. Bull | 1,306 | ||
Conservative | E. Willey | 1,288 | ||
Labour | John George Jones | 1,286 | ||
Liberal Democrats | M. Trench | 315 | ||
Turnout | 30.8% | |||
Labour hold | ||||
Conservative gain from Labour | ||||
Party | Candidate | Votes | % | |
---|---|---|---|---|
Labour | Brenda Jones | 1,218 | ||
Labour | Carol Blackburn | 1,181 | ||
Labour | Thomas Wildy | 1,074 | ||
Conservative | J. Plymsol | 1,002 | ||
Conservative | E. Price | 948 | ||
Conservative | M. Gibson | 925 | ||
Liberal Democrats | W. Gallagher | 384 | ||
Turnout | 28.0% | |||
Labour hold | ||||
Labour hold | ||||
Labour hold | ||||
x
Party | Candidate | Votes | % | |
---|---|---|---|---|
Labour | Sylvia Bellamy | 1,062 | ||
Labour | Robert Bellamy | 994 | ||
Labour | Mark King | 985 | ||
Conservative | J. Parry | 651 | ||
Conservative | D. Gamble | 646 | ||
Conservative | P. Parnall | 637 | ||
Liberal Democrats | H. Guy | 280 | ||
Liberal Democrats | P. Jones | 277 | ||
Turnout | 24.8% | |||
Labour hold | ||||
Labour hold | ||||
Labour hold | ||||
Party | Candidate | Votes | % | |
---|---|---|---|---|
Conservative | Constance Pascoe | 1,584 | ||
Conservative | Yvonne Dawson | 1,556 | ||
Conservative | Grant Monahan | 1,481 | ||
Labour | David Alexander Millar | 1,237 | ||
Labour | Janet Millar | 1,182 | ||
Labour | William John Stevens | 1,172 | ||
Liberal Democrats | S. Guy | 447 | ||
Liberal Democrats | J. Evans | 422 | ||
Turnout | 35.3% | |||
Conservative gain from Labour | ||||
Party | Candidate | Votes | % | |
---|---|---|---|---|
Conservative | Frederick Brimacombe | 1,188 | ||
Conservative | Anna Angel | 1,101 | ||
Labour | Jean Nelder | 1,095 | ||
Conservative | K. Kelway | 1,071 | ||
Labour | E. Cohen | 1,031 | ||
Labour | G. Wheeler | 1,008 | ||
Liberal Democrats | J. Dean | 320 | ||
Turnout | 29.5% | |||
Conservative gain from Labour | ||||
Labour hold | ||||
Party | Candidate | Votes | % | |
---|---|---|---|---|
Conservative | John Mahony | 1,633 | ||
Conservative | Patricia Nicholson | 1,620 | ||
Conservative | David Birkenhead | 1,565 | ||
Labour | R. Rogers | 1,138 | ||
Labour | G. Shears | 1,113 | ||
Labour | V. Woodward | 1,093 | ||
Liberal Democrats | P. Aldersley | 408 | ||
Green | F. Allen | 308 | ||
Turnout | 42.5% | |||
Conservative gain from Labour | ||||
Plymouth City Council is the local authority for the a unitary authority of Plymouth in Devon, England. Until 1 April 1998 it was a non-metropolitan district.
The 1990 Newham London Borough Council election to the Newham London Borough Council was held on 3 May 1990. The whole council was up for election. turnout no change was 33.0%. Labour maintained its overwhelming majority.
The 1986 Newham London Borough Council election for the Newham London Borough Council was held on 8 May 1986. The whole council was up for election. Turnout was 30.7%. Labour, for the first time, won all 60 seats.
The 1982 Newham London Borough Council election for the Newham London Borough Council was held on 6 May 1982. The whole council was up for election. Turnout was 27.0%. The Labour Party held onto its overwhelming majority.
The 1978 Newham London Borough Council election for the Newham London Borough Council was held on 4 May 1978. The whole council was up for election. Turnout was 26.8%. The Liberal Party didn't stand in the elections. The Labour Party held onto its overwhelming majority.
The 1974 Newham London Borough Council election was held on 2 May 1974. The entire Newham London Borough Council was up for election. Turnout was 19.9%. Four of the wards had incumbents that were re-elected unopposed.
Elections to Newham London Borough Council were held in May 1971. The whole council was up for election. Turnout was 27.3%. This election had aldermen as well as councillors. Labour won all ten aldermen positions.
The Weoley local council ward is one of the 40 electoral wards for the City of Birmingham, England. It is also one of the four wards that make up the local council constituency of Birmingham Northfield, the other three being the wards of Northfield, Longbridge and King's Norton.
The 1995 Cardiff Council election was the first election to the new unitary County Council of the City and County of Cardiff following the re-organization of local government in Wales. It was held on Thursday 4 May 1995. It was followed by the 1999 elections. On the same day there were elections to the other 21 local authorities in Wales and community councils in Wales. Labour won a majority of the seats. It was preceded in Cardiff by the 1991 elections to Cardiff City Council and the 1993 elections to South Glamorgan County Council.
The 1994 York City Council elections took place in May 1994 to elect the members of York City Council in North Yorkshire, England. These were the final elections to York City Council. Fifteen seats, previously contested in 1990, were up for election: twelve were won by the Labour Party, two by the Liberal Democrats and one by the Conservative Party.
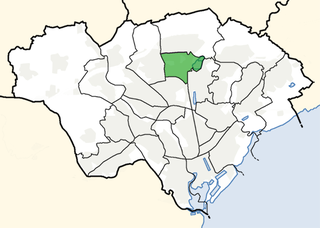
Llanishen is the name of an electoral ward in the north of Cardiff, capital city of Wales. It covers the community of Llanishen.
The 2003 Plymouth City Council election was held on 1 May 2003 to elect members of Plymouth City Council in England. This was on the same day as the other local elections. The election was the first to be contested under new ward boundaries, and as a result the entire council was up for election. The Labour Party regained control of the council, which it had lost to the Conservative Party at the previous election in 2000.
The 1995 Plymouth City Council election took place on 4 May 1995 to elect members of Plymouth City Council in Devon, England. This was on the same day as other local elections. The Labour Party retained control of the council, which it had gained from the Conservative Party at the previous election in 1991.
The 1997 Plymouth City Council election took place on 1 May 1997 to elect members of Plymouth City Council in Devon, England. This was on the same day as other local elections. The Labour Party retained control of the council, which it had held since 1991.
The 2000 Exeter City Council election took place on 4 May 2000, to elect members of Exeter City Council in England. The entire council was up for election following boundary changes, which increase the number of seats from 36 to 40. The election was held concurrently with other local elections in England. The Labour Party retained control of the council, which it had held since 1995.
The 2007 City of Lincoln Council election took place on 3 May 2007 to elect members of City of Lincoln Council in Lincolnshire, England. This was held on the same day as other local elections. All 33 seats were up for election, with 3 councillors in each of the 11 wards being elected following a boundary review. The Conservative Party gained control of the council from the Labour Party.
The 2008 City of Lincoln Council election took place on 1 May 2008 to elect members of City of Lincoln Council in Lincolnshire, England. This was held on the same day as other local elections. One third of the 33 seats were up for election, with one councillor in each of the 11 wards being elected. As the previous election in 2007 had been an all-out election with new ward boundaries, the seats of the candidates that had finished third in each ward in 2006 were up for election. The Conservative Party retained control of the council.
The 2010 City of Lincoln Council election took place on 6 May 2010 to elect members of City of Lincoln Council in Lincolnshire, England. This was held on the same day as other local elections, as well as the parliamentary general election. One third of the 33 seats were up for election, with one councillor in each of the 11 wards being elected. As the 2007 election had been an all-out election with new ward boundaries, the seats of the candidates that had finished second in each ward in 2006 were up for election. The Conservative Party retained control of the council.
The 2023 Plymouth City Council election was held on 4 May 2023 to elect members of Plymouth City Council in England. It coincided with local elections across the United Kingdom.