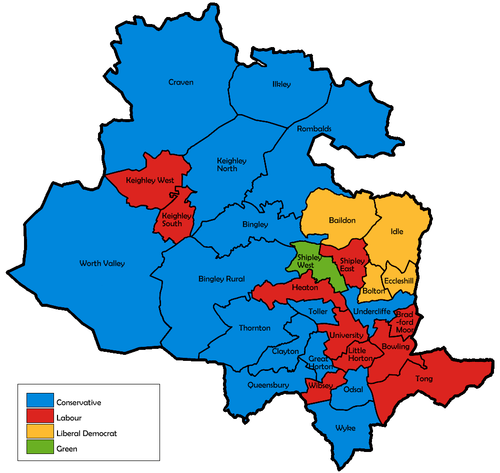
The 2000 City of Bradford Metropolitan District Council elections were held on Thursday, 4 May 2000, with one third of the council up for election. Labour lost control of the council to no overall control. [1] [2]
The 2000 City of Bradford Metropolitan District Council elections were held on Thursday, 4 May 2000, with one third of the council up for election. Labour lost control of the council to no overall control. [1] [2]
| Party | Seats | Gains | Losses | Net gain/loss | Seats % | Votes % | Votes | +/− | |
|---|---|---|---|---|---|---|---|---|---|
| Conservative | 15 | 11 | 0 | 50.0 | 43.7 | 45,422 | +4.0 | ||
| Labour | 10 | 0 | 13 | 33.3 | 34.4 | 35,729 | -3.9 | ||
| Liberal Democrats | 4 | 1 | 0 | 13.3 | 15.5 | 16,094 | -1.3 | ||
| Green | 1 | 1 | 0 | 3.3 | 3.3 | 3,410 | +0.7 | ||
| Independent | 0 | 0 | 0 | 0.0 | 2.9 | 2,980 | +0.4 | ||
| Asian League | 0 | 0 | 0 | 0.0 | 0.2 | 195 | +0.2 | ||
| Socialist Alternative | 0 | 0 | 0 | 0.0 | 0.1 | 97 | +0.1 | ||
This result had the following consequences for the total number of seats on the council after the elections:
| Party | Previous council | New council | |||
|---|---|---|---|---|---|
| Labour | 54 | 41 | |||
| Conservative | 26 | 37 | |||
| Liberal Democrat | 10 | 11 | |||
| Green | 0 | 1 | |||
| Total | 90 | 90 | |||
| Working majority | 18 | -8 | |||
| Party | Candidate | Votes | % | ±% | |
|---|---|---|---|---|---|
| Liberal Democrats | John Briggs | 1,982 | 46.5 | −8.4 | |
| Conservative | Edward Christopher Ward | 1,699 | 39.9 | +9.7 | |
| Labour | Carol Ann Jennings | 484 | 11.4 | −1.4 | |
| Green | Kevin Robert Warnes | 95 | 2.2 | +0.1 | |
| Majority | 283 | 6.6 | −18.1 | ||
| Turnout | 4,260 | 35.0 | |||
| Liberal Democrats hold | Swing | -9.0 | |||
| Party | Candidate | Votes | % | ±% | |
|---|---|---|---|---|---|
| Conservative | David Heseltine | 2,243 | 55.1 | +5.0 | |
| Labour | Eileen Mary Sinclair | 1,399 | 34.3 | −3.4 | |
| Liberal Democrats | Rebecca Anne Walter | 267 | 6.5 | −1.5 | |
| Green | Muriel Winifred Thompson | 165 | 4.0 | −0.2 | |
| Majority | 844 | 20.7 | +8.4 | ||
| Turnout | 4,074 | 38.7 | |||
| Conservative gain from Labour | Swing | +4.2 | |||
| Party | Candidate | Votes | % | ±% | |
|---|---|---|---|---|---|
| Conservative | Phyllis Vera Pettit | 2,479 | 65.9 | +3.4 | |
| Labour | James Albert Newton | 824 | 21.9 | −3.9 | |
| Liberal Democrats | Timothy Iain Mead | 322 | 8.5 | −0.6 | |
| Green | Arthur Albert John Arnold | 139 | 3.7 | +1.1 | |
| Majority | 1,655 | 44.0 | +7.4 | ||
| Turnout | 3,764 | 31.7 | |||
| Conservative hold | Swing | +3.6 | |||
| Party | Candidate | Votes | % | ±% | |
|---|---|---|---|---|---|
| Liberal Democrats | Howard Middleton | 1,675 | 57.3 | +3.4 | |
| Labour | Peter Cheney | 628 | 21.5 | −5.2 | |
| Conservative | Michael Thomas Looby | 618 | 21.2 | +1.9 | |
| Majority | 1,047 | 35.8 | +8.6 | ||
| Turnout | 2,921 | 28.3 | |||
| Liberal Democrats hold | Swing | +4.3 | |||
| Party | Candidate | Votes | % | ±% | |
|---|---|---|---|---|---|
| Labour | John Ryan | 1,391 | 52.4 | −6.8 | |
| Conservative | John Cecil David Hardy | 750 | 28.3 | +9.1 | |
| Liberal Democrats | Julie Rosemary Harrington | 317 | 11.9 | −9.6 | |
| Asian League | Farhan Hussain Khokhar | 195 | 7.4 | +7.4 | |
| Majority | 641 | 24.2 | −13.6 | ||
| Turnout | 2,653 | 21.5 | |||
| Labour hold | Swing | -7.9 | |||
| Party | Candidate | Votes | % | ±% | |
|---|---|---|---|---|---|
| Labour | Ghazanfer Khaliq | 1,827 | 56.1 | +21.8 | |
| Conservative | Asad Mercury Malik | 1,128 | 34.6 | −22.8 | |
| Liberal Democrats | James E Mangeolles | 302 | 9.3 | +1.0 | |
| Majority | 699 | 21.5 | −1.7 | ||
| Turnout | 3,257 | 30.4 | |||
| Labour hold | Swing | +22.3 | |||
| Party | Candidate | Votes | % | ±% | |
|---|---|---|---|---|---|
| Conservative | Charles Malcolm Sykes | 1,561 | 53.4 | +3.9 | |
| Labour | Gillian Margaret Whitfield | 973 | 33.3 | −3.4 | |
| Liberal Democrats | Edward John Hallmann | 297 | 10.2 | −1.0 | |
| Green | Alexander Suchi | 92 | 3.1 | +0.4 | |
| Majority | 588 | 20.1 | +7.3 | ||
| Turnout | 2,923 | 28.3 | |||
| Conservative gain from Labour | Swing | +3.6 | |||
| Party | Candidate | Votes | % | ±% | |
|---|---|---|---|---|---|
| Conservative | David Keith James Harrison | 2,059 | 49.9 | +6.4 | |
| Independent | Christopher Michael Atkinson | 993 | 24.1 | −0.4 | |
| Labour | Benita Eileen Smith | 779 | 18.9 | −1.7 | |
| Liberal Democrats | Hamish Gordon Hay | 293 | 7.1 | −4.4 | |
| Majority | 1,066 | 25.8 | +6.8 | ||
| Turnout | 4,124 | 33.0 | |||
| Conservative hold | Swing | +3.4 | |||
| Party | Candidate | Votes | % | ±% | |
|---|---|---|---|---|---|
| Liberal Democrats | Alun Own Griffiths | 1,002 | 38.1 | +0.1 | |
| Labour | Susanne Rooney | 851 | 32.3 | −0.7 | |
| Conservative | James Ralph Ryder | 780 | 29.6 | +0.6 | |
| Majority | 222 | 5.7 | +0.7 | ||
| Turnout | 2,633 | 27.7 | |||
| Liberal Democrats gain from Labour | Swing | +0.4 | |||
| Party | Candidate | Votes | % | ±% | |
|---|---|---|---|---|---|
| Conservative | Moira Crabtree | 1,358 | 43.0 | +4.3 | |
| Labour | Geoffrey Green | 1,294 | 41.0 | −5.1 | |
| Liberal Democrats | Colin Wright | 292 | 9.2 | −1.9 | |
| Independent | Mohd Afzal | 212 | 6.7 | +6.7 | |
| Majority | 64 | 2.0 | −5.4 | ||
| Turnout | 3,156 | 28.2 | |||
| Conservative gain from Labour | Swing | +4.7 | |||
| Party | Candidate | Votes | % | ±% | |
|---|---|---|---|---|---|
| Labour | Andrew Craig Pitts | 2,046 | 47.6 | +4.1 | |
| Conservative | John Antony Robertshaw | 1,747 | 40.6 | −2.2 | |
| Green | Helen Theyer Kemp | 257 | 6.0 | +6.0 | |
| Liberal Democrats | Hugh Alaric Tooby | 248 | 5.8 | −7.8 | |
| Majority | 299 | 7.0 | +6.3 | ||
| Turnout | 4,298 | 35.6 | |||
| Labour hold | Swing | +3.1 | |||
| Party | Candidate | Votes | % | ±% | |
|---|---|---|---|---|---|
| Liberal Democrats | David Ward | 1,732 | 48.7 | −8.4 | |
| Conservative | Philip Sweeney Kirkpatrick | 1,068 | 30.1 | +11.3 | |
| Labour | Gareth David Logan | 753 | 21.2 | −2.9 | |
| Majority | 664 | 18.7 | −14.3 | ||
| Turnout | 3,553 | 30.0 | |||
| Liberal Democrats hold | Swing | -9.8 | |||
| Party | Candidate | Votes | % | ±% | |
|---|---|---|---|---|---|
| Conservative | Colin George Powell | 2,633 | 65.0 | +5.4 | |
| Liberal Democrats | James Francis Keeley | 758 | 18.7 | +4.3 | |
| Labour | Talib Hussain | 658 | 16.2 | −9.6 | |
| Majority | 1,875 | 46.3 | +12.6 | ||
| Turnout | 4,049 | 36.7 | |||
| Conservative hold | Swing | +0.5 | |||
| Party | Candidate | Votes | % | ±% | |
|---|---|---|---|---|---|
| Conservative | Andrew Charles Mallinson | 1,932 | 49.7 | +13.5 | |
| Labour | Alexander James MacPherson | 1,531 | 39.4 | −15.4 | |
| Liberal Democrats | Judith Brooksbank | 424 | 10.9 | +1.9 | |
| Majority | 401 | 10.3 | −8.4 | ||
| Turnout | 3,887 | 35.1 | |||
| Conservative gain from Labour | Swing | +14.4 | |||
| Party | Candidate | Votes | % | ±% | |
|---|---|---|---|---|---|
| Labour | Stephen Thomas | 1,363 | 58.2 | −9.3 | |
| Conservative | Mark Francis Startin | 690 | 29.5 | +7.4 | |
| Liberal Democrats | Ian James Inness | 289 | 12.3 | +1.8 | |
| Majority | 673 | 28.7 | −16.7 | ||
| Turnout | 2,342 | 25.1 | |||
| Labour hold | Swing | -8.3 | |||
| Party | Candidate | Votes | % | ±% | |
|---|---|---|---|---|---|
| Labour | Andrew Geoffrey Mudd | 1,583 | 41.7 | −1.6 | |
| Conservative | Arshed Majeed | 1,209 | 31.8 | +0.2 | |
| Independent | Brian Hudson | 677 | 17.8 | +0.1 | |
| Liberal Democrats | Tracy Lorraine Keeley | 328 | 8.6 | +1.2 | |
| Majority | 374 | 9.8 | −1.8 | ||
| Turnout | 3,797 | 32.3 | |||
| Labour hold | Swing | -0.9 | |||
| Party | Candidate | Votes | % | ±% | |
|---|---|---|---|---|---|
| Labour | Sher Khan | 1,474 | 50.5 | −9.2 | |
| Conservative | Jamshed Khan | 1,091 | 37.4 | +10.5 | |
| Liberal Democrats | John Brian Massen | 217 | 7.4 | −2.1 | |
| Green | Brian Richard Ford | 136 | 4.7 | +2.4 | |
| Majority | 383 | 13.1 | −19.7 | ||
| Turnout | 2,918 | 26.7 | |||
| Labour hold | Swing | -9.8 | |||
| Party | Candidate | Votes | % | ±% | |
|---|---|---|---|---|---|
| Conservative | Gordon Johnson | 1,257 | 42.6 | +8.9 | |
| Labour | James O'Neill | 1,239 | 42.0 | −9.6 | |
| Liberal Democrats | Brian James Boulton | 451 | 15.3 | +0.7 | |
| Majority | 18 | 0.6 | −17.2 | ||
| Turnout | 2,947 | 24.2 | |||
| Conservative gain from Labour | Swing | +9.2 | |||
| Party | Candidate | Votes | % | ±% | |
|---|---|---|---|---|---|
| Conservative | Michael Walls | 1,802 | 54.6 | +6.0 | |
| Labour | Gordon Winter | 974 | 29.5 | −8.3 | |
| Liberal Democrats | Susan Elizabeth Lambert | 264 | 8.0 | −2.3 | |
| Independent | George Frank Riseborough | 162 | 4.9 | +1.6 | |
| Green | Derek Curtis | 98 | 3.0 | +3.0 | |
| Majority | 828 | 25.1 | +14.3 | ||
| Turnout | 3,300 | 26.1 | |||
| Conservative gain from Labour | Swing | +7.1 | |||
| Party | Candidate | Votes | % | ±% | |
|---|---|---|---|---|---|
| Conservative | Dale Smith | 2,799 | 61.8 | +7.5 | |
| Labour | David Leslie Anderson | 975 | 21.5 | −2.4 | |
| Liberal Democrats | John Hall | 757 | 16.7 | −5.1 | |
| Majority | 1,824 | 40.3 | +9.8 | ||
| Turnout | 4,531 | 35.8 | |||
| Conservative hold | Swing | +4.9 | |||
| Party | Candidate | Votes | % | ±% | |
|---|---|---|---|---|---|
| Labour | Phillip Thornton | 1,300 | 53.8 | +0.8 | |
| Conservative | Michael Bryn Allcock | 607 | 25.1 | +3.8 | |
| Liberal Democrats | Michael Pollard | 410 | 17.0 | −3.9 | |
| Green | Martin John Love | 101 | 4.2 | −0.8 | |
| Majority | 693 | 28.7 | −3.0 | ||
| Turnout | 2,418 | 23.8 | |||
| Labour hold | Swing | -1.5 | |||
| Party | Candidate | Votes | % | ±% | |
|---|---|---|---|---|---|
| Green | David Michael Ford | 1,859 | 37.0 | +7.3 | |
| Conservative | David John Servant | 1,256 | 32.6 | −0.9 | |
| Labour | James Robert Flood | 1,256 | 25.0 | −5.8 | |
| Liberal Democrats | Ronald Craig | 266 | 5.3 | −0.6 | |
| Majority | 220 | 4.4 | +1.6 | ||
| Turnout | 5,020 | 43.4 | |||
| Green gain from Labour | Swing | +4.1 | |||
| Party | Candidate | Votes | % | ±% | |
|---|---|---|---|---|---|
| Conservative | Valerie Binney | 1,810 | 67.5 | +9.9 | |
| Labour | Munir Ahmed | 390 | 14.5 | −14.2 | |
| Liberal Democrats | Helen Wright | 370 | 13.8 | +3.3 | |
| Green | Michael Anthony Rawnsley | 112 | 4.2 | +1.0 | |
| Majority | 1,420 | 52.9 | +24.1 | ||
| Turnout | 2,682 | 27.9 | |||
| Conservative gain from Labour | Swing | +12.0 | |||
| Party | Candidate | Votes | % | ±% | |
|---|---|---|---|---|---|
| Conservative | Arshad Hussain | 2,639 | 47.5 | +4.6 | |
| Labour | Imran Hussain | 2,506 | 45.1 | −3.6 | |
| Liberal Democrats | Christine Reid | 416 | 7.5 | −0.9 | |
| Majority | 133 | 2.4 | −3.4 | ||
| Turnout | 5,561 | 45.9 | |||
| Conservative gain from Labour | Swing | +4.1 | |||
| Party | Candidate | Votes | % | ±% | |
|---|---|---|---|---|---|
| Labour | James Anthony Cairns | 800 | 50.8 | −10.6 | |
| Conservative | John Arthur Stead | 567 | 36.0 | +12.4 | |
| Liberal Democrats | Adrian Hugh Cruden | 207 | 13.1 | −1.8 | |
| Majority | 233 | 14.8 | −23.0 | ||
| Turnout | 1,574 | 16.5 | |||
| Labour hold | Swing | -11.5 | |||
| Party | Candidate | Votes | % | ±% | |
|---|---|---|---|---|---|
| Conservative | Intkhab Alam | 1,203 | 40.5 | +9.3 | |
| Labour | S. Barnbrook | 927 | 31.2 | −15.2 | |
| Liberal Democrats | Brian Moore | 727 | 24.4 | +8.0 | |
| Green | Steven Schofield | 116 | 3.9 | −2.0 | |
| Majority | 276 | 9.3 | −5.9 | ||
| Turnout | 2,973 | ||||
| Conservative gain from Labour | Swing | +12.2 | |||
| Party | Candidate | Votes | % | ±% | |
|---|---|---|---|---|---|
| Labour | Sajawal Hussain | 2,202 | 44.4 | +3.8 | |
| Conservative | Tariq Mahmood | 2,183 | 44.0 | −2.9 | |
| Green | John Edward Robinson | 240 | 4.8 | −0.7 | |
| Liberal Democrats | Margaret Isobel Chadwick | 237 | 4.8 | −0.2 | |
| Socialist Alternative | Sajjad Hussain Shah | 97 | 2.0 | +2.0 | |
| Majority | 19 | 0.4 | −6.0 | ||
| Turnout | 4,959 | 31.3 | |||
| Labour hold | Swing | +3.3 | |||
| Party | Candidate | Votes | % | ±% | |
|---|---|---|---|---|---|
| Labour | Valerie McMath | 1,378 | 49.0 | −0.3 | |
| Conservative | Richard Ian Sheard | 1,101 | 39.2 | +2.1 | |
| Liberal Democrats | Shauna Ann Devonshire | 332 | 11.8 | −1.8 | |
| Majority | 277 | 9.8 | −2.5 | ||
| Turnout | 2,811 | 28.9 | |||
| Labour hold | Swing | -1.2 | |||
| Party | Candidate | Votes | % | ±% | |
|---|---|---|---|---|---|
| Conservative | Paul Michael Barker | 1,703 | 43.5 | +6.2 | |
| Labour | John Cope | 1,048 | 26.8 | −1.1 | |
| Independent | David Samuels | 936 | 23.9 | +1.1 | |
| Liberal Democrats | Samuel E Harris | 228 | 5.8 | −6.2 | |
| Majority | 655 | 16.7 | +7.3 | ||
| Turnout | 3,915 | 33.7 | |||
| Conservative gain from Labour | Swing | -3.6 | |||
| Party | Candidate | Votes | % | ±% | |
|---|---|---|---|---|---|
| Conservative | Robert Philip Andrew Reynolds | 1,067 | 40.6 | +1.6 | |
| Labour | Anthony Niland | 876 | 33.3 | −9.8 | |
| Liberal Democrats | Kevin Anthony Hall | 684 | 26.0 | +8.3 | |
| Majority | 191 | 7.3 | +3.2 | ||
| Turnout | 2,627 | 22.1 | |||
| Conservative gain from Labour | Swing | +5.7 | |||
| Party | Candidate | Votes | % | ±% | |
|---|---|---|---|---|---|
| Labour | Tony Niland | 1,014 | 44.0 | −8.4 | |
| Conservative | Zameer Shah | 777 | 33.7 | +5.4 | |
| Liberal Democrats | Rupert Oliver | 473 | 20.5 | +8.6 | |
| Majority | 237 | 10.3 | −13.9 | ||
| Turnout | 2,264 | 18.6 | −2.9 | ||
| Labour hold | Swing | -6.9 | |||
| Party | Candidate | Votes | % | ±% | |
|---|---|---|---|---|---|
| Labour | Geoffrey Green | 3,217 | 45.5 | +16.0 | |
| Conservative | 2,744 | 38.8 | −15.8 | ||
| Liberal Democrats | 892 | 12.6 | −4.6 | ||
| Independent | 203 | 2.9 | −2.0 | ||
| Asian League | 13 | 0.2 | +0.2 | ||
| Majority | 473 | 6.7 | −18.4 | ||
| Turnout | 7,069 | 53.3 | +27.2 | ||
| Labour hold | Swing | +15.9 | |||
| Party | Candidate | Votes | % | ±% | |
|---|---|---|---|---|---|
| Conservative | Juliette Kinsey | 1,576 | 65.2 | −0.7 | |
| Labour | James Newton | 642 | 26.6 | +4.7 | |
| Liberal Democrats | James Stewart | 150 | 6.2 | −2.4 | |
| Green | John Love | 50 | 2.1 | −1.9 | |
| Majority | 934 | 38.6 | −5.4 | ||
| Turnout | 2,418 | 20.0 | −11.7 | ||
| Conservative hold | Swing | -2.7 | |||
| Mayor | |
|---|---|
| Bradford | |
| Calderdale | |
| Kirklees | |
| Leeds |
|
| Wakefield | |
| West Yorkshire CC | |
| West Riding CC | |
| |