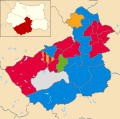
Kirklees Council is the local authority for the metropolitan borough of Kirklees in West Yorkshire, England. Since the last boundary changes in 2004, the council has comprised 69 councillors representing 23 wards. Elections are held three years out of four, with one third of the councillors (one for each ward) elected each time for a four-year term. [1]
Election | Labour | Conservative | Liberal Democrat/Liberal | UKIP | Green | Independent | Other | Control |
---|---|---|---|---|---|---|---|---|
1973 [2] | 45 | 14 | 8 | 0 | 0 | 1 | 0 | Labour |
1975 [3] | 36 | 28 | 7 | 0 | 0 | 1 | 0 | Labour hold |
1976 [4] | 25 | 50 | 9 | 0 | 0 | 0 | 0 | Conservative gain from Labour |
1978 [5] | 15 | 48 | 9 | 0 | 0 | 0 | 0 | Conservative hold |
1979 [6] | 32 | 35 | 5 | 0 | 0 | 0 | 0 | Conservative lose to no overall control |
1980 [7] | 44 | 25 | 3 | 0 | 0 | 0 | 0 | Labour gain from no overall control |
1982 [8] [9] | 37 | 19 | 12 | 0 | 0 | 0 | 4 | Labour hold |
1983 [10] | 37 | 20 | 12 | 0 | 0 | 0 | 3 | Labour hold |
1984 [11] | 37 | 18 | 14 | 0 | 0 | 0 | 3 | Labour hold |
1986 [12] | 36 | 18 | 17 | 0 | 0 | 1 | 0 | Labour hold |
1987 [13] | 33 | 21 | 18 | 0 | 0 | 0 | 0 | Labour lose to no overall control |
1988 [14] | 33 | 23 | 15 | 0 | 0 | 1 | 0 | No overall control |
1990 [15] | 45 | 15 | 12 | 0 | 0 | 0 | 0 | Labour gain from no overall control |
1992 [16] | 41 | 19 | 10 | 0 | 0 | 2 | 0 | Labour hold |
1994 [17] | 35 | 21 | 15 | 0 | 0 | 1 | 0 | Labour lose to no overall control |
1995 [18] | 40 | 16 | 14 | 0 | 0 | 2 | 0 | Labour gain from no overall control |
1996 [19] | 45 | 6 | 18 | 0 | 1 | 1 | 1 vacancy | Labour hold |
1998 [20] | 43 | 7 | 20 | 0 | 2 | 0 | 0 | Labour hold |
1999 [21] | 36 | 10 | 23 | 0 | 3 | 0 | 0 | Labour lose to no overall control |
2000 [22] | 25 | 15 | 29 | 0 | 3 | 0 | 0 | No overall control |
2002 [23] | 26 | 15 | 28 | 0 | 3 | 0 | 0 | No overall control |
2003 [24] | 22 | 16 | 31 | 0 | 3 | 0 | 0 | No overall control |
2004 [25] | 17 | 22 | 25 | 0 | 3 | 1 | 1 | No overall control |
2006 [26] | 20 | 21 | 20 | 0 | 3 | 1 | 4 | No overall control |
2007 [27] | 22 | 20 | 18 | 0 | 4 | 1 | 4 | No overall control |
2008 [28] | 22 | 21 | 19 | 0 | 4 | 0 | 3 | No overall control |
2010 [29] | 24 | 19 | 20 | 0 | 4 | 2 | 0 | No overall control |
2011 [30] | 27 | 21 | 14 | 0 | 4 | 3 | 0 | No overall control |
2012 [31] | 32 | 18 | 10 | 0 | 5 | 4 | 0 | No overall control |
2014 [32] | 32 | 18 | 10 | 0 | 5 | 4 | 0 | No overall control |
2015 [33] | 34 | 18 | 10 | 0 | 4 | 3 | 0 | No overall control |
2016 [34] | 34 | 20 | 9 | 0 | 3 | 3 | 0 | No overall control |
2018 [35] | 36 | 20 | 7 | 0 | 3 | 3 | 0 | Labour gain from no overall control |
2019 [36] | 35 | 17 | 10 | 0 | 3 | 4 | 0 | Labour hold |
2021 | 33 | 19 | 9 | 0 | 3 | 3 | 2 [lower-alpha 1] | Labour lose to no overall control |
2022 | 36 | 18 | 8 | 0 | 3 | 4 | 0 | Labour gain from no overall control |
2023 | 39 | 18 | 8 | 0 | 3 | 1 | 0 | Labour hold |
2024 | 31 | 15 | 10 | 0 | 4 | 9 | Labour lose to no overall control |
Party | Candidate | Votes | % | ±% | |
---|---|---|---|---|---|
Labour | 1,558 | 48.9 | |||
Liberal Democrats | 1,179 | 37.0 | |||
Conservative | 375 | 11.7 | |||
Green | 73 | 2.3 | |||
Majority | 377 | 11.9 | |||
Turnout | 3,185 | ||||
Labour hold | Swing |
Party | Candidate | Votes | % | ±% | |
---|---|---|---|---|---|
Liberal Democrats | 2,077 | 50.6 | |||
Labour | 1,418 | 34.5 | |||
Conservative | 486 | 11.8 | |||
Green | 124 | 3.0 | |||
Majority | 659 | 16.1 | |||
Turnout | 4,105 | 38.2 | |||
Liberal Democrats hold | Swing |
Party | Candidate | Votes | % | ±% | |
---|---|---|---|---|---|
Labour | 1,219 | 55.5 | +1.7 | ||
Conservative | 710 | 32.3 | −3.5 | ||
Liberal Democrats | 268 | 12.2 | +6.2 | ||
Majority | 509 | 23.2 | |||
Turnout | 2,197 | 16.0 | |||
Labour gain from Conservative | Swing |
Party | Candidate | Votes | % | ±% | |
---|---|---|---|---|---|
Liberal Democrats | 1,236 | 43.8 | +31.3 | ||
Labour | 1,039 | 36.8 | −16.6 | ||
Conservative | 456 | 16.2 | −9.2 | ||
Socialist Labour | 90 | 3.2 | +0.3 | ||
Majority | 197 | 7.0 | |||
Turnout | 2,821 | 25.1 | |||
Liberal Democrats gain from Labour | Swing |
Party | Candidate | Votes | % | ±% | |
---|---|---|---|---|---|
Liberal Democrats | 1,174 | 43.4 | −13.1 | ||
Labour | 976 | 36.0 | +13.3 | ||
Conservative | 518 | 19.1 | +3.4 | ||
Socialist | 40 | 1.5 | +1.5 | ||
Majority | 198 | 7.4 | |||
Turnout | 2,708 | 21.4 | |||
Liberal Democrats hold | Swing |
Party | Candidate | Votes | % | ±% | |
---|---|---|---|---|---|
Conservative | 3,176 | 41.2 | −14.6 | ||
Labour | 2,892 | 37.5 | +3.8 | ||
Liberal Democrats | 1,651 | 21.4 | +13.6 | ||
Majority | 284 | 3.7 | |||
Turnout | 7,719 | ||||
Liberal Democrats hold | Swing |
Party | Candidate | Votes | % | ±% | |
---|---|---|---|---|---|
BNP | David Exley | 1,607 | 27.7 | +27.7 | |
Liberal Democrats | Tabasum Aslam | 1,493 | 25.8 | +3.9 | |
Independent | Tim Crowther | 1,147 | 19.8 | +19.8 | |
Labour | Florence Smith | 982 | 16.9 | −22.9 | |
Conservative | Roger Roberts | 490 | 8.5 | −22.9 | |
Green | Heidi Smithson | 76 | 1.3 | −5.6 | |
Majority | 114 | 1.9 | |||
Turnout | 5,795 | 43.8 | |||
BNP gain from Labour | Swing |
Party | Candidate | Votes | % | ±% | |
---|---|---|---|---|---|
Labour | Barbara Jones | 2,904 | 63.5 | +6.5 | |
Liberal Democrats | John O'Reilly | 814 | 17.8 | −0.7 | |
Conservative | Paul Murphy | 287 | 6.3 | −4.1 | |
Green | Paul Cooney | 240 | 5.3 | −2.1 | |
Respect | David Ellis | 178 | 3.9 | +3.9 | |
BNP | Barry Fowler | 148 | 3.2 | −3.5 | |
Majority | 2,090 | 45.7 | |||
Turnout | 4,571 | 35.1 | |||
Labour hold | Swing |
Party | Candidate | Votes | % | ±% | |
---|---|---|---|---|---|
Labour | Peter Daniel McBride | 1,397 | 40.5 | +10.0 | |
Liberal Democrats | Alison Louise Munro | 1,155 | 33.5 | −0.8 | |
Conservative | Martin James Leonard | 605 | 17.5 | −1.9 | |
BNP | Jonathan David Baxter Wright | 157 | 4.5 | −6.3 | |
Green | David William Hargreaves | 103 | 3.0 | −2.0 | |
Independent | Colin Anthony Walder | 34 | 1.0 | +1.0 | |
Majority | 242 | 7.0 | |||
Turnout | 3,451 | 27.5 | |||
Labour hold | Swing |
Party | Candidate | Votes | % | ±% | |
---|---|---|---|---|---|
Labour | Cathy Scott | 1,513 | 37.4 | −2.0 | |
Liberal Democrats | Dennis Hullock | 1,405 | 34.8 | +14.3 | |
BNP | Joe Barber | 690 | 17.1 | −10.6 | |
Conservative | Amelia Lynne Bolton | 345 | 8.5 | −3.9 | |
Green | Adrian Hugh Cruden | 58 | 1.4 | N/A | |
Independent | Safiq Ali Patel | 17 | 0.4 | N/A | |
Independent | Alan Girvan | 15 | 0.4 | N/A | |
Majority | 108 | 2.7 | |||
Turnout | 4,043 | 31.0 | |||
Labour gain from BNP | Swing |
Party | Candidate | Votes | % | ±% | |
---|---|---|---|---|---|
Labour | Simon Alvy | 1,517 | 43.4 | ||
Conservative | Sharon Light | 1.378 | 39.4 | ||
Liberal Democrats | Richard Farnhill | 599 | 17.1 | ||
Majority | 139 | 4.0 | |||
Turnout | 3,494 | 25.3 | |||
Labour gain from Conservative | Swing |
Party | Candidate | Votes | % | ±% | |
---|---|---|---|---|---|
Liberal Democrats | Christine Mary Iredale | 1,591 | 47.6 | ||
Labour | Stephan Georg Jungnitz | 901 | 27.0 | ||
UKIP | Gregory Lloyd Broome | 450 | 13.5 | ||
Green | Daniel Edward Greenwood | 210 | 6.3 | ||
Conservative | Clinton Noel Simpson | 189 | 5.7 | ||
Majority | 690 | 20.7 | |||
Turnout | 3,341 | 23.0 | |||
Liberal Democrats gain from Labour | Swing |
Party | Candidate | Votes | % | ±% | |
---|---|---|---|---|---|
Labour | Habiban Nisa Zaman | 2,640 | 76.8 | ||
Conservative | Paul Young | 443 | 12.9 | ||
Independent | Aleks Lukic | 140 | 4.1 | ||
Liberal Democrats | Jon Robert Bloom | 136 | 4.0 | ||
Green | David Michael Smith | 70 | 2.0 | ||
Majority | 2,197 | 63.9 | |||
Turnout | 3,437 | 25.9 | |||
Labour hold | Swing |
Party | Candidate | Votes | % | ±% | |
---|---|---|---|---|---|
Labour | Will Simpson | 1,834 | 46.7 | ||
Conservative | Paula Kemp | 1,689 | 43.0 | ||
Liberal Democrats | Alison Baskeyfield | 289 | 7.4 | ||
Green | Isabel Walters | 116 | 3.0 | ||
Majority | 145 | 3.7 | |||
Turnout | 3,928 | ||||
Labour gain from Conservative | Swing |
Party | Candidate | Votes | % | ±% | |
---|---|---|---|---|---|
Conservative | Donna Bellamy | 4,504 | 45.8 | ||
Labour | Duggs Carre | 3,308 | 46.7 | ||
Liberal Democrats | Robert Iredale | 1,386 | 14.1 | ||
Green | Ian Vincent | 646 | 6.6 | ||
Majority | 1,196 | 12.1 | |||
Turnout | 9,844 | ||||
Conservative gain from Labour | Swing |
Party | Candidate | Votes | % | ±% | |
---|---|---|---|---|---|
Labour | Eric Firth | 3,299 | 42.0 | ||
Conservative | Keith Mallinson | 2,669 | 33.9 | ||
Heavy Woollen Independents | Ian Vincent | 1,515 | 19.3 | ||
Liberal Democrats | Dennis Hullock | 380 | 4.8 | ||
Majority | 630 | 8.0 | |||
Turnout | 7,863 | ||||
Labour hold | Swing |
Party | Candidate | Votes | % | ±% | |
---|---|---|---|---|---|
Labour | Ebrahim Dockrat | 2,248 | 73.7 | +29.4 | |
Conservative | Beverley Smith | 413 | 13.5 | −30.5 | |
Liberal Democrats | Stephen Long | 178 | 5.8 | −0.1 | |
Green | Simon Duffy | 145 | 4.8 | −3.9 | |
Yorkshire | Bikatshi Katenga | 42 | 1.4 | +1.4 | |
SDP | Mark Steele | 24 | 0.8 | +0.8 | |
Majority | 1,835 | 60.2 | |||
Turnout | 3,050 | ||||
Labour hold | Swing |
Party | Candidate | Votes | % | ±% | |
---|---|---|---|---|---|
Conservative | Damian Brook | 1,639 | 39.1 | −2.2 | |
Labour | Phillip Lucitt | 1134 | 27.0 | −18.3 | |
Green | Toby Cooper | 734 | 17.5 | +8.0 | |
Reform UK | Susan Laird | 511 | 12.2 | +12.2 | |
Liberal Democrats | Howard Cohen | 158 | 3.8 | −0.1 | |
Independent | Miri Finch | 17 | 0.4 | +0.4 | |
Majority | 1,835 | 60.2 | |||
Turnout | 3,050 | 27.2 | |||
Conservative hold | Swing |
Kirklees is a metropolitan borough of West Yorkshire, England. The borough comprises the ten towns of Batley, Birstall, Cleckheaton, Dewsbury, Heckmondwike, Holmfirth, Huddersfield, Meltham, Mirfield and Slaithwaite. It is governed by Kirklees Council. Kirklees had a population of 422,500 in 2011; it is the third-largest metropolitan district in England by area, behind Doncaster and Leeds.
The election of councillors to Allerdale Borough Council in Cumbria, England took place every four years. The council was established in 1974 and it was abolished in 2023. The last elections were in 2019.
Gateshead Metropolitan Borough Council elections are generally held three years out of every four, with a third of the council being elected each time. Gateshead Metropolitan Borough Council is the local authority for the metropolitan borough of Gateshead in Tyne and Wear, England.
Bournemouth Borough Council was the local authority for Bournemouth in Dorset, England between 1974 and 2019. Prior to 1974 Bournemouth had been a county borough within Hampshire. Under the Local Government Act 1972 Bournemouth became a non-metropolitan district within Dorset on 1 April 1974, with the same boundaries as the former county borough. On 1 April 1997 it became a unitary authority, taking over the functions previously provided for the area by Dorset County Council. In 2019 the council was abolished, merging with Christchurch and Poole to form Bournemouth, Christchurch and Poole.
Lichfield District Council elections are held every four years. Lichfield District Council is the local authority for the non-metropolitan district of Lichfield in Staffordshire, England. Since the last boundary changes in 2015, 47 councillors have been elected from 22 wards.
Bury Metropolitan Borough Council elections are generally held three years out of every four, with a third of the council being elected each time. Bury Metropolitan Borough Council, generally known as Bury Council, is the local authority for the metropolitan borough of Bury in Greater Manchester, England. Since the last boundary changes in 2022, 51 councillors have been elected from 17 wards.
Dudley Metropolitan Borough Council elections are held three years out of every four, with a third of the council elected each time. Dudley Metropolitan Borough Council is the local authority for the metropolitan borough of Dudley in the West Midlands, England. Since the last boundary changes in 2004, 72 councillors have been elected from 24 wards.
Aylesbury Vale District Council was the council for the non-metropolitan district of Aylesbury Vale in Buckinghamshire, England, which existed as a local government area from 1974 to 2020. The council was elected every four years from 1973 until 2020. At the time of its abolition, the council had 59 councillors, elected from 33 wards.
Fenland District Council in Cambridgeshire, England is elected every four years. Since the last boundary changes in 2023, the council has comprised 43 councillors representing 18 wards, with each ward electing one, two or three councillors.
Sefton Metropolitan Borough Council elections are generally held three years out of every four, with a third of the council being elected each time. Sefton Metropolitan Borough Council, generally known as Sefton Council, is the local authority for the metropolitan borough of Sefton in Merseyside, England. Since the last boundary changes in 2004, 66 councillors have been elected from 22 wards.
West Lancashire Borough Council elections are generally held three years out of every four, with a third of the council elected each time. West Lancashire Borough Council is the local authority for the non-metropolitan district of West Lancashire in Lancashire, England. Since the last boundary changes in 2023 the council has comprised 45 councillors representing 15 wards, with each ward electing three councillors.
Sandwell Borough Council elections are held three years out of every four, with a third of the council elected each time. Sandwell Metropolitan Borough Council is the local authority for the metropolitan borough of Sandwell in the West Midlands, England. Since the last boundary changes in 2004, 72 councillors have been elected from 24 wards.
South Tyneside Council elections are generally held three years out of every four, with a third of the council being elected each time. South Tyneside Council is the local authority for the metropolitan borough of South Tyneside in Tyne and Wear, England. Since the last boundary changes in 2004, 54 councillors are elected, 3 from each of the 18 wards.
Walsall Metropolitan Borough Council elections are held three years out of every four, with a third of the council elected each time. Walsall Metropolitan Borough Council, which styles itself "Walsall Council", is the local authority for the metropolitan district of Walsall in the West Midlands, England. Since the last boundary changes in 2004, 60 councillors have been elected from 20 wards.
City of Wolverhampton Council elections are held three years out of every four, with a third of the council elected each time. City of Wolverhampton Council is the local authority for the metropolitan borough of Wolverhampton in the West Midlands, England. Since the boundary changes in 2004, 60 councillors have been elected from 20 wards.
Newcastle-under-Lyme Borough Council elections are held every four years. Newcastle-under-Lyme Borough Council is the local authority for the non-metropolitan district of Newcastle-under-Lyme in Staffordshire, England. Since the last boundary changes in 2018, 47 councillors have been elected from 21 wards. Prior to 2018 elections were held three years out of every four, with a third of the council elected each time.
Tamworth Borough Council elections are held three years out of every four, with a third of the council elected each time. Tamworth Borough Council is the local authority for the non-metropolitan district of Tamworth in Staffordshire, England. Since the last boundary changes in 2002, 30 councillors have been elected from 10 wards.
Swindon Borough Council is the local authority for the unitary authority of Swindon in Wiltshire, England. Until 1 April 1997 its area was a non-metropolitan district called Thamesdown Borough Council, with Wiltshire County Council providing the county-level services.
Redcar and Cleveland Borough Council is the local authority for the unitary authority of Redcar and Cleveland in North Yorkshire, England. Until 1 April 1996 it was a non-metropolitan district in Cleveland, called Langbaurgh.
One third of Woking Borough Council in Surrey, England is elected each year, followed by one year without election. Since the last boundary changes in 2016, 30 councillors have been elected from 10 wards.