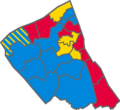
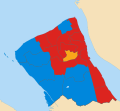
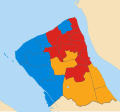
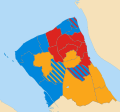
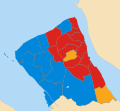
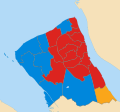
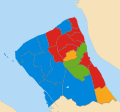
Wirral Metropolitan Borough Council elections are held every four years from 2023 onwards, having previously been held three years out of every four for a third of the council at a time. Wirral Metropolitan Borough Council, generally known as Wirral Council, is the local authority for the metropolitan borough of Wirral in Merseyside, England. [1]
Only four parties have won seats to Council: Conservative, Green, Labour and Liberal Democrat (and its predecessors). All other political representation has come via changes in affiliation.
Year | Con | Green | Lab | Lib Dem | Other | Ref |
---|---|---|---|---|---|---|
1973 | 29 | 0 | 24 | 13 | 0 | [2] |
1974 | 29 | 0 | 24 | 13 | 0 | |
1975 | 36 | 0 | 21 | 9 | 0 | |
37 | 0 | 21 | 8 | 0 | ||
1976 | 42 | 0 | 18 | 6 | 0 | |
1977 | 42 | 0 | 18 | 6 | 0 | |
1978 | 45 | 0 | 16 | 5 | 0 | |
1979 | 40 | 0 | 20 | 6 | 0 | |
1980 | 37 | 0 | 23 | 6 | 0 | |
1981 | 37 | 0 | 23 | 6 | 0 | |
1982 | 35 | 0 | 25 | 6 | 0 | |
1983 | 34 | 0 | 24 | 8 | 0 | |
1984 | 34 | 0 | 24 | 8 | 0 | |
1985 | 34 | 0 | 24 | 8 | 0 | |
1986 | 30 | 0 | 26 | 10 | 0 | |
1987 | 29 | 0 | 27 | 10 | 0 | |
1988 | 24 | 0 | 32 | 10 | 0 | |
24 | 0 | 29 | 10 | 3 | ||
1989 | 24 | 0 | 29 | 10 | 3 | |
1990 | 23 | 0 | 33 | 7 | 3 | |
23 | 0 | 33 | 8 | 2 | ||
1991 | 24 | 0 | 34 | 7 | 1 | |
1992 | 29 | 0 | 31 | 6 | 0 | |
1993 | 29 | 0 | 31 | 6 | 0 | |
1994 | 30 | 0 | 30 | 6 | 0 | |
28 | 0 | 30 | 8 | 0 | ||
1995 | 22 | 0 | 36 | 8 | 0 | |
1996 | 16 | 0 | 41 | 9 | 0 | |
1997 | 16 | 0 | 41 | 9 | 0 | |
1998 | 16 | 0 | 41 | 8 | 1 | |
16 | 0 | 42 | 8 | 0 | [3] | |
1999 | 17 | 0 | 39 | 10 | 0 | [2] |
2000 | 20 | 0 | 34 | 12 | 0 | |
2001 | 20 | 0 | 34 | 12 | 0 | |
20 | 0 | 33 | 12 | 1 | [4] | |
2002 | 20 | 0 | 32 | 12 | 2 | |
20 | 0 | 31 | 14 | 1 | [5] | |
2003 | 23 | 0 | 26 | 16 | 1 | [6] |
2004 | 21 | 0 | 26 | 19 | 0 | [7] |
20 | 0 | 26 | 19 | 1 | [8] | |
2005 | 21 | 0 | 26 | 18 | 1 | [9] |
2006 | 21 | 0 | 26 | 19 | 0 | [10] |
2007 | 21 | 0 | 25 | 20 | 0 | [11] |
21 | 0 | 25 | 19 | 1 | [12] | |
20 | 0 | 25 | 19 | 2 | [13] | |
2008 | 24 | 0 | 21 | 20 | 1 | [14] |
2009 | 25 | 0 | 20 | 20 | 1 | [15] |
2010 | 27 | 0 | 24 | 15 | 0 | [16] |
2011 | 27 | 0 | 29 | 10 | 0 | [17] |
27 | 0 | 30 | 9 | 0 | [18] | |
2012 | 22 | 0 | 37 | 7 | 0 | [19] |
2013 | 23 | 0 | 36 | 7 | 0 | [20] |
22 | 0 | 37 | 7 | 0 | [21] | |
22 | 0 | 37 | 6 | 1 | [22] | |
2014 | 21 | 1 | 38 | 6 | 0 | [23] |
2015 | 21 | 1 | 39 | 5 | 0 | [24] |
2016 | 21 | 1 | 38 | 5 | 1 | [25] |
21 | 1 | 39 | 5 | 0 | [26] | |
2017 | 21 | 1 | 39 | 5 | 0 | |
2018 | 21 | 1 | 39 | 5 | 0 | [27] |
21 | 1 | 38 | 5 | 1 | [28] | |
21 | 1 | 37 | 5 | 2 | [29] | |
2019 | 21 | 1 | 36 | 5 | 3 | [30] |
21 | 1 | 35 | 5 | 4 | [31] | |
21 | 1 | 34 | 5 | 5 | [32] | |
22 | 3 | 32 | 6 | 3 | [33] | |
2020 | 22 | 2 | 32 | 6 | 4 | [34] |
2021 | 23 | 5 | 30 | 6 | 2 | [35] |
23 | 5 | 29 | 6 | 3 | [36] | |
2022 | 23 | 5 | 28 | 6 | 4 | [37] |
23 | 6 | 28 | 6 | 3 | [38] | |
24 | 9 | 26 | 6 | 1 | [39] | |
2023 | 23 | 9 | 26 | 6 | 2 | [40] |
23 | 9 | 25 | 6 | 3 | [41] | |
23 | 9 | 24 | 6 | 4 | [42] | |
23 | 9 | 23 | 6 | 5 | [43] | |
17 | 13 | 30 | 6 | 0 | [44] | |
2024 | 17 | 14 | 29 | 6 | 0 | [45] |
2025 | 14 | 14 | 29 | 6 | 3 | [46] |
Since the first election in 1973, boundary changes have occurred in 1980 (where a third of the council were up for election) and in 2004 (where there was an all out election). [47] [1] [48] Following changes in 2023, Wirral moved from a thirds system of election to an all-out system, with all councillors elected every four years. [49]
![]() |
![]() |
Party | Candidate | Votes | % | ±% | |
---|---|---|---|---|---|
Conservative | Lesley Rennie | 1,781 | 47.3 | ![]() | |
Labour | Elizabeth McArdle | 1,490 | 39.5 | ![]() | |
Liberal Democrats | John Uriel | 443 | 11.8 | ![]() | |
Green | George Bowler | 54 | 1.4 | New | |
Majority | 291 | 7.7 | ![]() | ||
Turnout | 32.2 | ![]() | |||
Conservative hold | Swing | ![]() |
Party | Candidate | Votes | % | ±% | |
---|---|---|---|---|---|
Liberal Democrats | Francis Doyle | 1,764 | 63.3 | ![]() | |
Conservative | Ian McKellar | 634 | 22.7 | ![]() | |
Labour | Gerard Allen | 389 | 14.0 | ![]() | |
Majority | 1,130 | 40.6 | ![]() | ||
Registered electors | 11,596 | ||||
Turnout | 24.0 | ![]() | |||
Liberal Democrats hold | Swing | ![]() |
Party | Candidate | Votes | % | ±% | |
---|---|---|---|---|---|
Conservative | Steve Williams | 2,255 | 70.1 | ![]() | |
Labour | Andrew Hollingworth | 615 | 19.1 | ![]() | |
Liberal Democrats | Steve Pitt | 134 | 4.2 | ![]() | |
Independent | Alec McFadden | 121 | 3.8 | New | |
Green | Jim McGinley | 92 | 2.9 | ![]() | |
Majority | 1,640 | 51.0 | ![]() | ||
Turnout | 28.0 | ![]() | |||
Conservative hold | Swing | ![]() |
Party | Candidate | Votes | % | ±% | |
---|---|---|---|---|---|
Conservative | Ian Lewis | 1,620 | 50.5 | ![]() | |
Labour | Pauline Daniels | 1,355 | 42.2 | ![]() | |
UKIP | Susan Whitham | 148 | 4.6 | ![]() | |
TUSC | Mark Halligan | 31 | 1.0 | New | |
Liberal Democrats | Daniel Clein | 28 | 0.9 | New | |
Green | Jim McGinley | 28 | 0.9 | ![]() | |
Majority | 265 | 8.3 | N/A | ||
Registered electors | 10,551 | ||||
Turnout | 30.5 | ![]() | |||
Conservative gain from Labour | Swing | ![]() |
Party | Candidate | Votes | % | ±% | |
---|---|---|---|---|---|
Conservative | Kathryn Hodson | 1,254 | 58.8 | ![]() | |
UKIP | David Scott | 460 | 21.6 | ![]() | |
Labour | Mike Holliday | 289 | 13.6 | −4.2 | |
Green | Barbara Burton | 110 | 5.2 | ![]() | |
TUSC | Greg North | 19 | 0.9 | New | |
Majority | 794 | 37.2 | ![]() | ||
Registered electors | 10,855 | ||||
Turnout | 19.7 | ![]() | |||
Conservative hold | Swing | ![]() |
Party | Candidate | Votes | % | ±% | |
---|---|---|---|---|---|
Labour | Phillip Brightmore | 1,411 | 38.5 | ![]() | |
Conservative | Sheila Clarke | 868 | 23.7 | ![]() | |
Liberal Democrats | Damien Cummins | 834 | 22.7 | ![]() | |
UKIP | Jan Davison | 426 | 11.6 | ![]() | |
Green | Allen Burton | 74 | 2.0 | ![]() | |
English Democrat | Neil Kenny | 53 | 1.4 | New | |
Majority | 543 | 14.8 | ![]() | ||
Registered electors | 10,487 | ||||
Turnout | 35.0 | ![]() | |||
Labour gain from Conservative | Swing | ![]() |
Party | Candidate | Votes | % | ±% | |
---|---|---|---|---|---|
Labour | Matthew Patrick | 1,954 | 65.4 | ![]() | |
Conservative | Geoffrey Gubb | 762 | 25.5 | ![]() | |
Green | Jim McGinley | 143 | 4.8 | ![]() | |
Liberal Democrats | Alan Davies | 130 | 4.3 | ![]() | |
Majority | 1,192 | 39.9 | ![]() | ||
Registered electors | 12,154 | ||||
Turnout | 3,031 | 24.9 | ![]() | ||
Rejected ballots | 21 | 0.7 | |||
Labour hold | Swing | ![]() |
Party | Candidate | Votes | % | ±% | |
---|---|---|---|---|---|
Labour | Gillian Wood | 1,761 | 52.4 | ![]() | |
Liberal Democrats | David Evans | 740 | 22.0 | ![]() | |
Conservative | Barbara Sinclair | 567 | 16.9 | ![]() | |
Green | Liz Heydon | 136 | 4.1 | ![]() | |
UK_Independence_Party | Beryl Jones | 130 | 3.9 | New | |
TUSC | Leon Wheddon | 27 | 0.8 | ![]() | |
Majority | 976 | 30.4 | ![]() | ||
Registered electors | 11,336 | ||||
Turnout | 3,372 | 29.7 | ![]() | ||
Rejected ballots | 11 | 0.3 | ![]() | ||
Labour hold | Swing | ![]() |
Party | Candidate | Votes | % | ±% | |
---|---|---|---|---|---|
Labour Co-op | Jo Bird | 1,253 | 47.1 | ![]() | |
Conservative | Des Drury | 749 | 28.1 | ![]() | |
Liberal Democrats | Vicky Downie | 454 | 17.1 | ![]() | |
Independent | Steve Niblock | 147 | 5.5 | New | |
Green | Susan Braddock | 59 | 2.2 | ![]() | |
Majority | 504 | 19.0 | ![]() | ||
Registered electors | 11,760 | ||||
Turnout | 2664 | 22.7 | ![]() | ||
Rejected ballots | 2 | 0.1 | ![]() | ||
Labour hold | Swing | ![]() |
Party | Candidate | Votes | % | ±% | |
---|---|---|---|---|---|
Labour | Jean Robinson | 1,490 | 61.3 | ![]() | |
Conservative | Emma Sellman | 705 | 29.0 | ![]() | |
Green | Lily Clough | 151 | 6.2 | ![]() | |
Liberal Democrats | Alan Davies | 83 | 3.4 | ![]() | |
Majority | 785 | 32.3 | ![]() | ||
Registered electors | 12,040 | ||||
Turnout | 2,434 | 20.2 | ![]() | ||
Rejected ballots | 5 | 0.2 | ![]() | ||
Labour hold | Swing | ![]() |
Party | Candidate | Votes | % | ±% | |
---|---|---|---|---|---|
Labour | Daisy Kenny | 1,137 | 53.6 | ![]() | |
Conservative | Jane Owens | 582 | 27.4 | ![]() | |
Liberal Democrats | Sue Arrowsmith | 201 | 9.5 | ![]() | |
Green | Edward Lamb | 109 | 5.1 | ![]() | |
Independent | Lynda Williams | 68 | 3.2 | New | |
For Britain | Gary Bergin | 26 | 1.2 | New | |
Majority | 555 | 26.1 | ![]() | ||
Registered electors | 11,399 | ||||
Turnout | 2,128 | 18.7 | ![]() | ||
Rejected ballots | 5 | 0.2 | ![]() | ||
Labour hold | Swing | ![]() |
Party | Candidate | Votes | % | ±% | |
---|---|---|---|---|---|
Liberal Democrats | Orod Osanlou | 1,666 | 68.3 | ![]() | |
Labour Co-op | Sue Mahoney [72] | 460 | 18.8 | ![]() | |
Conservative | Philip Merry | 168 | 6.9 | ![]() | |
Green | Mary Heydon | 147 | 6.0 | ![]() | |
Majority | 1,206 | 49.4 | ![]() | ||
Registered electors | 10,795 | ||||
Turnout | 22.7 | 2,447 | ![]() | ||
Rejected ballots | 6 | 0.2 | ![]() | ||
Liberal Democrats hold | Swing | ![]() |
Party | Candidate | Votes | % | ±% | |
---|---|---|---|---|---|
Labour | James Laing | 1,304 | 64.8 | ![]() | |
Conservative | Jane Owens | 370 | 18.4 | ![]() | |
Green | Nadia Parson | 172 | 8.5 | ![]() | |
Liberal Democrats | Sue Arrowsmith | 167 | 8.3 | ![]() | |
Majority | 934 | 46.4 | ![]() | ||
Registered electors | 10,795 | ||||
Turnout | 2,027 | 18.8 | ![]() | ||
Rejected ballots | 14 | 0.7 | ![]() | ||
Labour hold | Swing | ![]() |
Party | Candidate | Votes | % | ±% | |
---|---|---|---|---|---|
Labour | Graeme Cooper | 3,630 | 59.6 | ||
Green | Oliver Reeves | 909 | 14.9 | ||
Conservative | Stephen Dobson | 751 | 12.3 | ||
Liberal Democrats | Chase Newton | 321 | 5.3 | ||
Workers Party | Philip Bimpson | 300 | 4.9 | ||
Freedom Alliance | Kieran Folkard | 178 | 2.9 | ||
Majority | 2,721 | 44.7 | |||
Turnout | 6,089 | ||||
Labour hold | Swing |
![]() |