2019 Liverpool City Council election

Last updated
2019 Liverpool City Council election
Coat of arms of Liverpool City Council.svg
  2018 2 May 2019 (2019-05-02) 2021  

30 of 90 seats (one-third)
to Liverpool City Council
46 seats needed for a majority
 First partySecond partyThird party
 
Joe Anderson (crop).jpg
Cllr Richard Kempq.jpg
Cllr Tom Crone.jpg
Leader Joe Anderson Richard KempTom Crone
Party Labour Liberal Democrats Green
Leader's seatN/A,
Mayor
Church
St Michael's
Last election25 seats,
63.8%
3 seats,
16.7%
2 seats,
9.4%
Seats before7584
Seats won2531
Seats after72104
Seat changeDecrease2.svg 3Increase2.svg 2Steady2.svg 0
Popular vote53,26416,33712,124
Percentage59%18%13%
SwingDecrease2.svg4.8%Increase2.svg 1.4%

 Fourth party
 
Cllr Steve Radford.png
Leader Steve Radford
Party Liberal
Leader's seat Tuebrook
and
Stoneycroft
Last election1 seat,
4.2%
Seats before2
Seats won1
Seats after3
Seat changeIncrease2.svg 1
Popular vote4,120
Percentage5%
Swing

Liverpool City Council Election Results Map 2019.svg
Map of results of 2019 election

Control of Council before election

Joe Anderson
Labour

Control of Council after Election

Joe Anderson
Labour

The 2019 Liverpool City Council election took place on 2 May 2019 to elect members of Liverpool City Council in England. [1] This was the same day as other local elections.

Contents

Due to the 'in thirds' system of election, one third of the council were up for election, with comparisons to previous results made with the corresponding vote at the 2015 Liverpool City Council election.

Council composition

Prior to the election the composition of the council was:

758421
LabLDGLI

After the election the composition of the council was:

7210431
LabLDGLI

Retiring councillors

Council WardDeparting CouncillorPartyRef
Anfield Adele Dowling Labour [2]
Central Sharon Sullivan Labour [3]
Clubmoor Irene Rainey Labour [2]
Cressington William Jones Labour [4]
Fazakerley Peter Clarke Labour [2]
Norris Green Alan Walker Labour [2]
Picton Paul Kenyon Labour [4]
Princes Park Alan Dean Labour [4]
Riverside Michelle Corrigan Labour [4]
Tuebrook and Stoneycroft Carol Sung Labour

Parties Standing

Liverpool City Council election result, 2019
PartyCandidatesVotes
StoodElectedGainedUnseatedNet % of total %No.Net %
  Labour 302503-38358.7753,264
  Liberal Democrats 30320+21018.0216,337
  Green 301000313.3812,124
  Liberal 22110+134.554,120
  Conservative 30000003.993,620
  UKIP 3000000.72653
  Socialist Alternative 2000000.14131
  Women's Equality 1000000.0657
  Democrats and Veterans 1000000.0875
  Old Swan Against the Cuts 1000000.0984
  Independent 2000000.19172

Results

Allerton and Hunts Cross

Allerton and Hunts Cross
PartyCandidateVotes%±%
Labour Sharon Connor * 2,318 50.64 Increase2.svg6.32
Liberal Democrats Fiona McBride1,70937.34Decrease2.svg5.24
Green Maggi Williams3377.36Increase2.svg1.88
Conservative Denise Nutall2134.65Decrease2.svg2.99
Majority60913.31
Registered electors 11,565
Turnout 4,61339.89Increase2.svg3.14
Rejected ballots360.78Increase2.svg0.64
Labour hold Swing Increase2.svg 6.3

[5]

Anfield

Anfield
PartyCandidateVotes%±%
Labour Lena Simic 1,448 73.28 Decrease2.svg6.73
Green Harry Glen Gallimore-King1939.77Increase2.svg4.63
Liberal James Richardson1417.14Increase2.svg4.61
Liberal Democrats James Liam Madine974.91Decrease2.svg1.12
Conservative Irene Stuart974.91Decrease2.svg1.39
Majority1,25563.51
Registered electors 9,172
Turnout 2,00021.81Decrease2.svg2.38
Rejected ballots241.20Increase2.svg0.89
Labour hold Swing Decrease2.svg6.72

[6]

Belle Vale

Belle Vale
PartyCandidateVotes%±%
Labour Helen Thompson 2,113 70.62 Decrease2.svg11.98
UKIP Douglas Anthony Boffey31010.36
Liberal Democrats Stephen David Atkinson1986.62Decrease2.svg0.67
Green Hilary Brenda McDonagh1745.82Increase2.svg2.80
Conservative Wendy Rose Hine1073.58Decrease2.svg2.23
Socialist Alternative Roy Dixon622.07
Liberal Marjorie Peel280.94Decrease2.svg0.35
Majority1,80360.26
Registered electors 11,581
Turnout 3,00425.94Decrease2.svg1.18
Rejected ballots120.40Decrease2.svg0.11
Labour hold Swing Decrease2.svg11.8

[7]

Central

Central
PartyCandidateVotes%±%
Labour Maria Toolan 914 60.13 Decrease2.svg7.81
Green Jayne Louise Stephanie Clough34022.37Increase2.svg10.77
Liberal Democrats Sam Buist1449.47Increase2.svg1.89
Conservative Lee David Berry1016.64Decrease2.svg0.88
Liberal Bethan Hazel Williams211.38
Majority57437.76
Registered electors 9,585
Turnout 1,53616.03Decrease2.svg0.07
Rejected ballots161.04Increase2.svg0.85
Labour hold Swing Decrease2.svg7.77

[8]

Childwall

Childwall
PartyCandidateVotes%±%
Liberal Democrats Alan Peter Tormey 2,421 52.41 Increase2.svg3.80
Labour Jeremy Wolfson *1,78038.54Decrease2.svg4.69
Green David Ronald Teasdale2525.46Increase2.svg1.50
Conservative David Jeffery1092.36Decrease2.svg0.96
Women's Equality Erika Raffle-Currie571.23
Majority64113.88
Registered electors 10,807
Turnout 4,64142.94Increase2.svg0.96
Rejected ballots220.47Increase2.svg0.23
Liberal Democrats gain from Labour Swing

[9]

Church

Church
PartyCandidateVotes%±%
Liberal Democrats Richard Kemp 2,859 60.32 Increase2.svg2.33
Labour Nat Griffin [10] 1,31327.70Decrease2.svg3.88
Green Julie Elizabeth Birch-Holt48610.25Increase2.svg3.38
Conservative James Craig821.73Decrease2.svg1.83
Majority1,54632.62
Registered electors 10,490
Turnout 4,77045.47Increase2.svg1.37
Rejected ballots300.63Increase2.svg0.52
Liberal Democrats hold Swing Increase2.svg2.32

[11]

Clubmoor

Clubmoor
PartyCandidateVotes%±%
Labour Sarah Jane Morton 1,770 74.24 Decrease2.svg8.84
Liberal Paul Wynne Jones2038.52Increase2.svg3.58
Green Helen Parker-Jervis1958.18Increase2.svg4.13
Liberal Democrats Sean Robertson1184.95Increase2.svg2.03
Conservative Peter Andrew984.11Decrease2.svg0.83
Majority1,56765.73
Registered electors 11,121
Turnout 2,41621.72Decrease2.svg1.25
Rejected ballots321.32Increase2.svg0.86
Labour hold Swing Decrease2.svg8.86

[12]

County

County
PartyCandidateVotes%±%
Labour Roy Gladden 1,635 77.64 Decrease2.svg9.00
Green Linda Jones1999.45Increase2.svg6.02
Liberal Democrats Alex Cottrell1537.26Increase2.svg0.97
Conservative Olivia Georgina Lever622.94Decrease2.svg0.70
Liberal Irene Morrison572.71
Majority1,43668.19
Registered electors 9,329
Turnout 2,13422.87Decrease2.svg2.00
Rejected ballots281.31Increase2.svg0.89
Labour hold Swing Decrease2.svg8.96

[13]

Cressington

Cressington
PartyCandidateVotes%±%
Labour Sam Gorst 1,896 42.64 Decrease2.svg9.80
Liberal Democrats Norman Mills1,82641.06Increase2.svg7.46
Green Jean-Paul Roberts51411.56Increase2.svg4.22
Conservative Christopher Hall2114.74Decrease2.svg1.88
Majority701.57
Registered electors 11,659
Turnout 4,48238.44Decrease2.svg1.85
Rejected ballots350.78Increase2.svg0.70
Labour hold Swing Decrease2.svg10.24

[14]

Croxteth

Croxteth
PartyCandidateVotes%±%
Labour Joann Kushner 1,670 73.12 Decrease2.svg9.76
Green Rachael Blackman-Stretton2159.41Increase2.svg5.54
Conservative Alice Margaret Day1466.39Decrease2.svg0.33
Liberal Ray Catesby1285.60Increase2.svg2.63
Liberal Democrats William Barrow1255.47Increase2.svg1.92
Majority1,45563.70
Registered electors 10,532
Turnout 2,31822.01Decrease2.svg2.30
Rejected ballots341.47Increase2.svg1.12
Labour hold Swing

[15]

Everton

Everton
PartyCandidateVotes%±%
Labour Jane Corbett * 2,036 82.60 Decrease2.svg4.01
Green Samuel James Cassidy2018.15Increase2.svg4.38
Liberal Democrats Susan Kennaugh-Dyson963.89Increase2.svg1.67
Conservative David William Murray682.76Decrease2.svg2.37
Liberal Linda Roberts642.60Increase2.svg0.33
Majority1,83574.44
Registered electors 10,722
Turnout 2,50023.32Decrease2.svg1.46
Rejected ballots351.40Increase2.svg0.91
Labour hold Swing

[16]

Fazakerley

Fazakerley
PartyCandidateVotes%±%
Labour Frazer Lake 1,897 77.11 Decrease2.svg6.06
Green Luke Anthony Burke2088.46Increase2.svg4.14
Conservative Giselle Henrietta McDonald1596.46Decrease2.svg0.17
Liberal Democrats Joseph Robert Slupsky1154.67Increase2.svg0.63
Liberal Brenda Edwards813.29Increase2.svg1.46
Majority1,68968.66
Registered electors 11,221
Turnout 2,50222.30Decrease2.svg1.49
Rejected ballots421.68Increase2.svg1.34
Labour hold Swing

[17]

Greenbank

Greenbank
PartyCandidateVotes%±%
Labour Laura Robertston-Collins * 1,757 52.70 Increase2.svg7.24
Green Kay Alexandra Inckle1,37741.30Decrease2.svg6.94
Liberal Democrats Dewi Anthony John1053.15Decrease2.svg0.25
Conservative Nicholas John Leigh Basson742.22Decrease2.svg0.68
Liberal Donald MacRitchie210.63
Majority38011.40
Registered electors 8,721
Turnout 3,36238.55Decrease2.svg0.45
Rejected ballots280.83Increase2.svg0.54
Labour hold Swing

[18]

Kensington and Fairfield

Kensington and Fairfield
PartyCandidateVotes%±%
Labour Wendy Simon * 1,484 69.54 Decrease2.svg6.53
UKIP Thomas Kangley1617.54
Liberal Democrats Pat Moloney1607.50Increase2.svg2.76
Green Rebecca Lawson1396.51Decrease2.svg1.19
Liberal Damien Patrick Daly833.89Increase2.svg0.96
Conservative Brian James Jones562.62Decrease2.svg1.03
Independent Joe Owens512.39Decrease2.svg2.52
Majority1,32362.00
Registered electors 9,206
Turnout 2,14623.31Decrease2.svg1.69
Rejected ballots120.56Increase2.svg0.09
Labour hold Swing

[19]

Kirkdale

Kirkdale
PartyCandidateVotes%±%
Labour Lisa Gaughan 1,935 78.63 Decrease2.svg3.52
UKIP Corinna Christine Allen1827.40
Green Jonathan Richard Clatworthy1496.05Increase2.svg1.97
Liberal Democrats Mike McAllister-Bell953.86Increase2.svg0.88
Socialist Alternative Roger Bannister [20] 692.80Decrease2.svg3.04
Conservative Katie Maria Burgess311.26Decrease2.svg2.78
Majority1,75371.23
Registered electors 11,208
Turnout 2,46822.02Decrease2.svg0.47
Rejected ballots70.28Decrease2.svg0.03
Labour hold Swing

[21]

Knotty Ash

Knotty Ash
PartyCandidateVotes%±%
Labour Co-op Harry Doyle * 1,778 69.70 Decrease2.svg0.06
Liberal Democrats Graham Hughes 26410.35Decrease2.svg1.35
Green Fiona Margaret McGill Coyne2319.06Increase2.svg3.56
Conservative Mark Butchard1897.41Decrease2.svg2.29
Liberal Kenneth Russell893.49Increase2.svg0.69
Majority1,51459.35
Registered electors 10,466
Turnout 2,58324.68Decrease2.svg0.08
Rejected ballots321.24Increase2.svg0.93
Labour Co-op hold Swing

[22]

Mossley Hill

Mossley Hill
PartyCandidateVotes%±%
Labour Patrick Hurley * 1,746 42.72 Decrease2.svg2.92
Liberal Democrats Robert Charles McAllister-Bell1,36333.35Decrease2.svg1.69
Green Ted Grant72917.84Increase2.svg7.29
Conservative Christopher Andrew Roland1664.06Decrease2.svg2.17
Liberal David Stanley Wood832.03Decrease2.svg0.51
Majority3839.37
Registered electors 9,455
Turnout 4,11843.55Decrease2.svg0.85
Rejected ballots310.75Increase2.svg0.59
Labour hold Swing

[23]

Norris Green

Prospective Labour candidate Liam Moore stepped down over allegations of anti-Semitism and homophobia. [24] [25]

Norris Green
PartyCandidateVotes%±%
Labour George Knibb 2,079 80.80 Decrease2.svg5.03
Green Martyn Madeley2379.21Increase2.svg4.01
Conservative Alma McGing1154.47Decrease2.svg0.36
Liberal Democrats Angela Hulme853.30Increase2.svg1.03
Liberal Colin Edwards572.22Increase2.svg0.35
Majority1,84271.59
Registered electors 12,433
Turnout 2,60320.94Decrease2.svg1.98
Rejected ballots301.15Increase2.svg0.61
Labour hold Swing

[26]

Old Swan

Old Swan
PartyCandidateVotes%±%
Labour Peter Brennan * 2,021 72.36 Decrease2.svg2.63
Green George Maxwell2187.81Increase2.svg3.11
Liberal Mick Coyne2157.70Increase2.svg3.35
Liberal Democrats Norman Darbyshire1665.94Increase2.svg0.36
Conservative Derek Thomas Nuttall893.19Decrease2.svg1.78
Old Swan Against the Cuts Martin Ralph843.01Decrease2.svg2.41
Majority1,80364.55
Registered electors 11,201
Turnout 2,81825.16Decrease2.svg0.74
Rejected ballots250.89Increase2.svg0.51
Labour hold Swing

[27]

Picton

Picton
PartyCandidateVotes%±%
Labour Abdul Qadir * 1,556 69.84 Decrease2.svg13.75
Green Sophie Brown33915.22Increase2.svg9.20
Liberal Democrats Stephen Brauner1677.50Increase2.svg3.69
Conservative Joshua Forrester964.31Increase2.svg1.02
Liberal Alan Oscroft703.14Increase2.svg2.23
Majority1,21754.62
Registered electors 10,059
Turnout 2,25022.37Decrease2.svg0.83
Rejected ballots220.98Increase2.svg0.46
Labour hold Swing

[28]

Princes Park

Princes Park
PartyCandidateVotes%±%
Labour Tomas Logan 1,926 72.13 Decrease2.svg6.66
Green Stephanie Louise Pitchers49018.35Increase2.svg5.66
Liberal Democrats Thomas Sebire1445.39Increase2.svg0.93
Conservative Beryl Pinnington813.03Decrease2.svg1.02
Liberal Barbara Lever291.09
Majority1,43653.78
Registered electors 10,778
Turnout 2,69625.01Decrease2.svg0.69
Rejected ballots260.96Increase2.svg0.31
Labour hold Swing

[29]

Riverside

Riverside
PartyCandidateVotes%±%
Labour Sarah Doyle 2,336 70.04 Decrease2.svg9.42
Green Sally Newey48714.60Increase2.svg5.53
Liberal Democrats Anna McCracken2146.42Increase2.svg0.89
Conservative Graham Kenwright1494.47Decrease2.svg1.46
Independent Robin Singleton1213.63
Liberal Lindsey Janet Mary Wood280.84
Majority1,84955.44
Registered electors 14,464
Turnout 3,36623.27Increase2.svg0.07
Rejected ballots310.92Increase2.svg0.53
Labour hold Swing

[30]

SpekeGarston

SpekeGarston
PartyCandidateVotes%±%
Labour Mary Rasmussen * 2,365 79.84 Decrease2.svg2.99
Green Jonathan Key29910.09Increase2.svg4.31
Liberal Democrats Wiebke Ruterjans1786.01Increase2.svg0.22
Conservative Michael Borman1204.05Decrease2.svg1.55
Majority2,06669.75
Registered electors 13,781
Turnout 2,99621.74Decrease2.svg1.36
Rejected ballots341.13Increase2.svg0.85
Labour hold Swing

[31]

St Michaels

St Michaels
PartyCandidateVotes%±%
Green Anna Key * 2,458 66.96 Increase2.svg8.64
Labour Calvin Wesley Smeda1,01127.54Decrease2.svg9.35
Liberal Democrats Chris Collins1163.16Increase2.svg0.99
Conservative David Patmore862.34Decrease2.svg0.28
Majority1,44739.42
Registered electors 9,642
Turnout 3,69338.30Decrease2.svg0.30
Rejected ballots220.60Increase2.svg0.38
Green hold Swing

[32]

Tuebrook and Stoneycroft

Tuebrook and Stoneycroft
PartyCandidateVotes%±%
Liberal Joe Dunne 2,132 67.96 Increase2.svg3.92
Labour Rona Ellen Heron79825.44Decrease2.svg7.12
Green Martin Sydney Dobson932.96Increase2.svg1.77
Liberal Democrats Jenny Goulding822.61Increase2.svg1.35
Conservative Luke Andrew Hingley-Smith321.02Increase2.svg0.08
Majority1,33442.52
Registered electors 10,253
Turnout 3,15130.73Decrease2.svg7.27
Rejected ballots140.44Increase2.svg0.27
Liberal gain from Labour Swing

[33]

Warbreck

Warbreck
PartyCandidateVotes%±%
Labour Co-op Ann O'Byrne * 2,240 80.58 Increase2.svg0.62
Green Noël Jane Little2217.95Increase2.svg3.61
Liberal Democrats Gerard George Thompson1565.61Decrease2.svg2.2
Conservative McLean Campbell Patrick Wickham1053.78Decrease2.svg2.77
Liberal George Blacklock Roberts582.09Increase2.svg0.78
Majority2,01972.63
Registered electors 11,064
Turnout 2,82725.55Decrease2.svg0.65
Rejected ballots471.66Increase2.svg1.22
Labour Co-op hold Swing

[34]

Wavertree

Wavertree
PartyCandidateVotes%±%
Labour Dave Cummings * 1,841 52.90 Decrease2.svg9.56
Liberal Democrats Graham Hulme71620.57Increase2.svg1.35
Green David William Morgan56216.15Increase2.svg7.23
Conservative Stuart Wood1444.14Decrease2.svg3.13
Liberal David Seth Harrap1424.08Increase2.svg1.96
Democrats and Veterans Adam Giles Heatherington752.16NEW
Majority1,12532.33
Registered electors 10,439
Turnout 3,50233.55Increase2.svg1.11
Rejected ballots220.63Increase2.svg0.28
Labour hold Swing

[35]

West Derby

West Derby
PartyCandidateVotes%±%
Labour Daniel Barrington * 2,039 68.17 Decrease2.svg1.70
Liberal Democrats Paul John Twigger Parr2658.86Increase2.svg0.76
Green Elke Weissmann2478.26Increase2.svg4.92
Liberal Ann Hines2418.06Decrease2.svg0.48
Conservative Pauline Shuttleworth1996.65Decrease2.svg2.01
Majority1,77459.31
Registered electors 10,939
Turnout 3,02427.64Decrease2.svg1.70
Rejected ballots331.09Increase2.svg0.90
Labour hold Swing

[36]

Woolton

Woolton
PartyCandidateVotes%±%
Liberal Democrats Barbara Mace 2,042 48.68 Decrease2.svg1.79
Labour Alice Bennett *1,55036.95Increase2.svg4.19
Green Jennifer Mary Brown3147.49Increase2.svg2.17
Conservative Christopher David Thomas2896.89Decrease2.svg4.58
Majority492
Registered electors 10,699
Turnout 4,22639.50Decrease2.svg0.6
Rejected ballots31
Liberal Democrats gain from Labour Swing

[37]

Yew Tree

Yew Tree
PartyCandidateVotes%±%
Labour Barbara Murray * 2,012 74.93 Decrease2.svg6.40
Green William Ward2208.19Increase2.svg5.06
Liberal Democrats Jacqueline Wilson1585.88Increase2.svg1.94
Liberal Sam Hawksford1495.55Increase2.svg2.18
Conservative Gillian Michelle Ferrigno1465.44Decrease2.svg2.78
Majority1,79266.74
Registered electors 11,719
Turnout 2,71723.18Decrease2.svg1.99
Rejected ballots321.18Increase2.svg0.94
Labour hold Swing

[38]

By Elections

Old Swan 19 September 2019

Caused by the resignation of Cllr. Peter Brennan (Labour, last elected 2 May 2019) [39]

Old Swan
PartyCandidateVotes%±%
Labour William Shortall 1,153 55.4 Decrease2.svg17.0
Liberal Mick Coyne29314.1Increase2.svg6.4
Liberal Democrats Chris Lea27213.1Increase2.svg7.2
Old Swan Against the Cuts Martin Ralph1386.6Increase2.svg3.6
Green George Duncan1306.2Decrease2.svg1.6
Conservative Peter Andrew964.6Increase2.svg1.4
Majority86041.3Decrease2.svg23.3
Registered electors 11,207
Turnout 18.72,096Decrease2.svg6.5
Rejected ballots140.7Decrease2.svg0.2
Labour hold Swing Decrease2.svg11.7

[40]

Princes Park 17 October 2019

Caused by the resignation of Cllr. Tim Moore (Labour, last elected 5 May 2016) [41]

Princes Park
PartyCandidateVotes%±%
Labour Joanne Marie Anderson 1,259 73.1%
Green Stephanie Louise Pitchers23713.8%
Liberal Democrats Lee James Rowlands1488.59%
Conservative Alma Gavine McGing794.59%
Majority1,022
Registered electors 10,921
Turnout 1,72315.92%
Rejected ballots16
Labour hold Swing

[42] [43]

Clubmoor 12 December 2019

Caused by the resignation of Cllr. James Noakes (Labour, last elected 5 May 2016) [44]

Clubmoor
PartyCandidateVotes%±%
Labour Tim Jeeves 6,276 86%
Liberal Paul Wynne Jones4205.8%
Green Michael Christopher Stretton3284.5%
Liberal Democrats Stephen Fitzsimmons 2433.3%
Majority5,856
Registered electors 11,258
Turnout 7,40766%
Rejected ballots140
Labour hold Swing

[45]

Picton 12 December 2019

Caused by the resignation of Cllr. Paul Kenyon (Labour, last elected 3 May 2018) following allegations of anti-semitism in the Labour Party. [46] [47]

Picton
PartyCandidateVotes%±%
Labour Calvin Wesley Smeda 5,196 79%
Green Sophie Brown4577%
Conservative Chris Hall3625.5%
Liberal Democrats Jenny Turner3365.1%
Liberal Alan Oscroft1081.7%
Independent Adam Heatherington811.2%
Majority4,739
Registered electors 11,536
Turnout 6,57957%
Rejected ballots39
Labour hold Swing

[48]

See also

Notes


    Related Research Articles

    <span class="mw-page-title-main">Liverpool City Council</span> Local government body in England

    Liverpool City Council is the governing body for the city of Liverpool in Merseyside, England. It consists of 85 councillors, for the city's 64 wards. Following a review by the Local Government Boundary Commission the number of wards increased to 64 at the elections on Thursday 4th May 2023. Three wards elect 3 councillors each, fifteen wards elect 2 councillors each and the remaining 46 wards each elect a single councillor, which brought down the total number of councillors to 85.

    <span class="mw-page-title-main">2006 Liverpool City Council election</span>

    Elections to Liverpool City Council were held on 4 May 2006. One third of the council was up for election and the Liberal Democrat party kept overall control of the council. Overall turnout was 25%.

    <span class="mw-page-title-main">County (Liverpool ward)</span> Metropolitan borough council ward in England

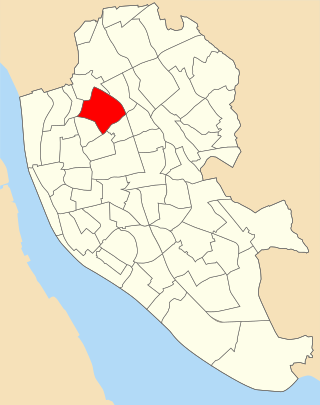
    County ward is an electoral division of Liverpool City Council. The ward is within the Liverpool Walton Parliamentary constituency.

    <span class="mw-page-title-main">Picton (ward)</span> Former metropolitan borough council ward in Liverpool, England

    Picton ward was an electoral division of Liverpool City Council centred on the Edge Hill, Liverpool district of Liverpool.

    <span class="mw-page-title-main">Princes Park (Liverpool ward)</span> Electoral district of Liverpool

    Princes Park ward is a Liverpool City Council Ward in the Liverpool Riverside Parliamentary constituency.

    <span class="mw-page-title-main">2007 Liverpool City Council election</span> 2007 UK local government election

    Elections to Liverpool City Council were held on 3 May 2007. One third of the council was up for election and the Liberal Democrat party kept overall control of the council. Overall turnout was 27.5%

    <span class="mw-page-title-main">2008 Liverpool City Council election</span>

    Elections to Liverpool City Council were held on 1 May 2008. One third of the council was up for election.

    <span class="mw-page-title-main">Wavertree (ward)</span> Former metropolitan borough council ward in Liverpool, England

    Wavertree ward was an electoral division of Liverpool City Council centred on the Wavertree, Liverpool district of Liverpool.

    <span class="mw-page-title-main">Old Swan (ward)</span> Former metropolitan borough council ward in Liverpool, England

    Old Swan ward was an electoral division of Liverpool City Council, centred on the Old Swan district of Liverpool.

    <span class="mw-page-title-main">Kirkdale (ward)</span> Former metropolitan borough council ward in Liverpool, England

    Kirkdale ward was an electoral division of Liverpool City Council centred on the Kirkdale and Vauxhall areas of Liverpool.

    <span class="mw-page-title-main">Croxteth (Liverpool ward)</span> Metropolitan borough council ward in Liverpool, England

    Croxteth ward is an electoral division of Liverpool City Council. Ward in the Liverpool West Derby Parliamentary constituency.

    <span class="mw-page-title-main">Clubmoor (ward)</span> Metropolitan borough council ward in Liverpool, England

    Clubmoor ward was an electoral division of Liverpool City Council in the Liverpool Walton Parliamentary constituency.

    <span class="mw-page-title-main">Anfield (Liverpool ward)</span> Metropolitan borough council ward in England

    Anfield ward is an electoral district of Liverpool City Council centred on the Anfield district of Liverpool. The ward is within the Liverpool Walton Parliamentary constituency.

    <span class="mw-page-title-main">1955 Liverpool City Council election</span> 1955 UK local election

    Elections to Liverpool City Council were held on Thursday 12 May 1955. After the election, the composition of the council was:

    <span class="mw-page-title-main">2016 Liverpool City Council election</span>

    The 2016 Liverpool City Council election took place on 5 May 2016 to elect members of Liverpool City Council in England. This was on the same day as the election for the Elected Mayor of Liverpool and the Police and Crime Commissioner for Merseyside.

    <span class="mw-page-title-main">2018 Liverpool City Council election</span>

    The 2018 Liverpool City Council election took place on 3 May 2018 to elect members of Liverpool City Council in England. This was on the same day as other local elections.

    <span class="mw-page-title-main">Ian Byrne</span> British Labour politician

    Ian Robert Byrne is a British Labour Party politician. He has been the Member of Parliament (MP) for Liverpool West Derby since the 2019 general election. He is a member of the Socialist Campaign Group parliamentary grouping.

    <span class="mw-page-title-main">2021 Liverpool City Council election</span>

    The 2021 Liverpool City Council election took place on 6 May 2021 to elect members of Liverpool City Council, alongside other elections across the United Kingdom. One third of the council were up for election, as well as the Mayor of Liverpool, the Metro Mayor of Liverpool City Region and Police and Crime Commissioner Merseyside Police, all covering Liverpool.

    <span class="mw-page-title-main">2023 Liverpool City Council election</span> Liverpool City Council elections 2023

    The 2023 Liverpool City Council election took place on 4 May 2023 to elect members of Liverpool City Council. Following a Boundary Review by The Local Government Boundary Commission for England, the size of the council was reduced from 90 to 85 seats with a change from three-member seats, elected in thirds, three years out of every four, following the British Government instigated Best Value Inspection Report which led to the appointment by the government of Commissioners and the subsequent boundary review for Council Wards in Liverpool which the government initiated with the proviso that the number of councillors be reduced and the predominant number of wards be reduced to single members with all-up elections every four years. The election also marked the end of Liverpool's directly-elected mayoralty. After the election the council reverted to having a leader of the council chosen from amongst the councillors instead. Labour retained control of the council and their group leader Liam Robinson became leader of the council after the election.

    References

    1. "Voting and elections". Liverpool City Council . Retrieved 31 October 2018.
    2. 1 2 3 4 Hubbard, Andrew. "Does that leave just Cressington left to select?". Twitter . Retrieved 31 October 2018.
    3. Thorp, Liam. "Tears and shouting in the street as ANOTHER Liverpool Labour Councillor loses position". Liverpool Echo . Retrieved 31 October 2018.
    4. 1 2 3 4 Thorp, Liam. "Sitting Liverpool Labour councillors OUT as Momentum takes charge in city". Liverpool Echo . Retrieved 31 October 2018.
    5. "Allerton and Hunts Cross". Liverpool City Council. Retrieved 3 May 2019.
    6. "Anfield". Liverpool City Council. Retrieved 3 May 2019.
    7. "Belle Vale". Liverpool City Council. Retrieved 3 May 2019.
    8. "Central". Liverpool City Council. Retrieved 3 May 2019.
    9. "Childwall". Liverpool City Council. Retrieved 3 May 2019.
    10. Thorp, Liam. "19-year-old student wins Labour nod - immediately makes surprise comments about Joe Anderson". Liverpool Echo . Retrieved 31 October 2018.
    11. "Church". Liverpool City Council. Retrieved 3 May 2019.
    12. "Clubmoor". Liverpool City Council. Retrieved 3 May 2019.
    13. "County". Liverpool City Council. Retrieved 3 May 2019.
    14. "Cressington". Liverpool City Council. Retrieved 3 May 2019.
    15. "Everton". Liverpool City Council. Retrieved 3 May 2019.
    16. "Everton". Liverpool City Council. Retrieved 3 May 2019.
    17. "Everton". Liverpool City Council. Retrieved 3 May 2019.
    18. "Greenbank". Liverpool City Council. Retrieved 3 May 2019.
    19. "Kensington and Fairfield". Liverpool City Council. Retrieved 4 May 2019.
    20. Last year, Roger stood for Trade Unionist and Socialist Coalition
    21. "Kirkdale". Liverpool City Council. Retrieved 4 May 2019.
    22. "Knotty Ash". Liverpool City Council. Retrieved 4 May 2019.
    23. "Mossley Hill". Liverpool City Council. Retrieved 4 May 2019.
    24. Thorp, Liam (7 November 2018). "Labour investigating Liverpool candidate after claims of antisemitic and homophobic slurs". Liverpool Echo . Retrieved 7 November 2018.
    25. Thorp, Liam (7 November 2018). "Liverpool Council Labour candidate steps down over 'antisemitic and homophobic' slurs". Liverpool Echo . Retrieved 8 November 2018.
    26. "Norris Green". Liverpool City Council. Retrieved 4 May 2019.
    27. "Old Swan". Liverpool City Council. Retrieved 4 May 2019.
    28. "Picton". Liverpool City Council. Retrieved 4 May 2019.
    29. "Princes Park". Liverpool City Council. Retrieved 4 May 2019.
    30. "Riverside". Liverpool City Council. Retrieved 4 May 2019.
    31. "SpekeGarston". Liverpool City Council. Retrieved 4 May 2019.
    32. "St Michaels". Liverpool City Council. Retrieved 4 May 2019.
    33. "Tuebrook and Stoneycroft". Liverpool City Council. Retrieved 4 May 2019.
    34. "Warbeck". Liverpool City Council. Retrieved 4 May 2019.
    35. "Wavertree". Liverpool City Council. Retrieved 4 May 2019.
    36. "West Derby". Liverpool City Council. Retrieved 4 May 2019.
    37. "Woolton". Liverpool City Council. Retrieved 4 May 2019.
    38. "Yew Tree". Liverpool City Council. Retrieved 4 May 2019.
    39. "Old Swan By Election cause". Liverpool Echo. Retrieved 16 September 2019.
    40. "Old Swan By Election 19 September 2019". Liverpool City Council. Retrieved 16 September 2019.
    41. "Princes Park By Election cause". Liverpool City Council. Retrieved 16 September 2019.
    42. "Princes Park By Election Statement of persons nominated". Liverpool City Council. Archived from the original on 21 September 2019. Retrieved 21 September 2019.
    43. "Princes Park By Election Results". Liverpool City Council. Retrieved 2 November 2019.
    44. "Clubmoor By Election cause". Liverpool City Council. Retrieved 30 March 2021.
    45. "Clubmoor 12 Dec 2019". Liverpool City Council. Retrieved 16 December 2019.
    46. "Picton By Election cause". Liverpool Echo. Retrieved 30 March 2021.
    47. "Picton By Election cause 2". Liverpool City Council. Retrieved 30 March 2021.
    48. "Picton 12 Dec 2019". Liverpool City Council. Retrieved 16 December 2019.