| |||||||||||||||||||||||||||||||||||||
All 61 seats to South Gloucestershire Council 31 seats needed for a majority | |||||||||||||||||||||||||||||||||||||
---|---|---|---|---|---|---|---|---|---|---|---|---|---|---|---|---|---|---|---|---|---|---|---|---|---|---|---|---|---|---|---|---|---|---|---|---|---|
| |||||||||||||||||||||||||||||||||||||
Winner of each seat at the 2019 South Gloucestershire Council election | |||||||||||||||||||||||||||||||||||||
|
The 2019 South Gloucestershire Council election took place on 2 May 2019 to elect members of South Gloucestershire Council in England as part of nationwide local elections. [1]
A 2018 boundary change meant that the total number of seats in the council was reduced from 70 to 61. [2] The Conservatives retained their control of the council, sliding from 40 seats to 33. The Liberal Democrats increased from 16 to 17 seats, and Labour lost three, going to 11. [3]
2019 South Gloucestershire Council election [4] | ||||||||||
---|---|---|---|---|---|---|---|---|---|---|
Party | Candidates | Seats | Gains | Losses | Net gain/loss | Seats % | Votes % | Votes | +/− | |
Conservative | 61 | 33 | 6 | 11 | 7 | 54.1 | 42.4 | 58,969 | +0.9 | |
Liberal Democrats | 61 | 17 | 2 | 1 | 1 | 27.9 | 33.2 | 46,202 | +11.3 | |
Labour | 54 | 11 | 3 | 6 | 3 | 18.0 | 19.1 | 26,572 | –4.9 | |
Green | 7 | 0 | 0 | 0 | 0.0 | 2.1 | 2,854 | +1.1 | ||
UKIP | 9 | 0 | 0 | 0 | 0.0 | 1.9 | 2,594 | –8.3 | ||
Independent | 8 | 0 | 0 | 0 | 0.0 | 1.4 | 1,921 | +0.3 |
In wards that are represented by more than one councillor, electors were given more than one vote each, hence the voter turnout may not match the number of votes cast.
Party | Candidate | Votes | % | ±% | |
---|---|---|---|---|---|
Conservative | Paul Robert Hughes | 979 | 47.0 | ||
Conservative | Erica Williams | 969 | 46.5 | ||
Labour | Neil Willmott | 530 | 25.4 | ||
Labour | Ben Gibbs | 516 | 24.8 | ||
Liberal Democrats | Paul Aidan Hulbert | 347 | 16.7 | ||
Green | Matthew Furey-King | 328 | 15.7 | ||
Liberal Democrats | Karl Dominic Tomasin | 288 | 13.8 | ||
Turnout | 3957 | 29.4 | |||
Conservative hold | Swing | ||||
Party | Candidate | Votes | % | ±% | |
---|---|---|---|---|---|
Conservative | Steve Reade | 1,305 | 52.6 | ||
Conservative | Ben Stokes | 1,300 | 52.4 | ||
Liberal Democrats | Philippa Emily Marsden | 982 | 39.6 | ||
Liberal Democrats | Nicholas Andrew Valentine | 822 | 33.1 | ||
Labour | Nigel Goldsmith | 281 | 11.3 | ||
Turnout | 4690 | 35.9 | |||
Conservative hold | Swing | ||||
Party | Candidate | Votes | % | ±% | |
---|---|---|---|---|---|
Conservative | Sarah Lynn Pomfret | 925 | 40.8 | ||
Conservative | Franklin Owusu-Antwi | 866 | 38.2 | ||
Liberal Democrats | Jon Williams | 503 | 22.2 | ||
Labour | David Michael Addison | 494 | 21.8 | ||
Labour | Fabrizio Fazzino | 485 | 21.4 | ||
Independent | Andy Ward | 456 | 20.1 | ||
Liberal Democrats | Ian Noel Joseph | 343 | 15.1 | ||
Independent | Daniel John Elliott | 297 | 13.1 | ||
Turnout | 4369 | 29.1 | |||
Conservative hold | Swing | ||||
†Increased to 2 seats
Party | Candidate | Votes | % | ±% | |
---|---|---|---|---|---|
Conservative | John Ashe | 753 | 43.1 | ||
Conservative | Roger Avenin | 744 | 42.6 | ||
Labour | Kulwinder Singh Sappal | 423 | 24.2 | ||
Labour | Ravi Kumar Vinjamuri | 364 | 20.8 | ||
Independent | Elaine Ann Hardwick | 293 | 16.8 | ||
Liberal Democrats | Sue Hope | 260 | 14.9 | ||
Independent | Marion Ward | 258 | 14.8 | ||
Liberal Democrats | Omar Aziz Beg | 213 | 12.2 | ||
Independent | Bex Ward | 93 | 5.3 | ||
Turnout | 3401 | 26.2 | |||
Conservative hold | Swing | ||||
Party | Candidate | Votes | % | ±% | |
---|---|---|---|---|---|
Liberal Democrats | John O`Neill | 869 | 73.3 | ||
Conservative | John Dudley Buxton | 250 | 21.1 | ||
Labour | Gary Raymond Clarke | 66 | 5.6 | ||
Turnout | 1185 | 36.9 | |||
Liberal Democrats hold | Swing | ||||
Party | Candidate | Votes | % | ±% | |
---|---|---|---|---|---|
Conservative | Sanjay Kumar Shambhu | 520 | 39.5 | ||
Conservative | Jo Buddharaju | 511 | 38.8 | ||
Conservative | Brian Hopkinson | 497 | 37.8 | ||
Labour | Elaine Mary Martin | 403 | 30.6 | ||
Labour | Keith Walker | 388 | 29.5 | ||
Labour | Mubashar Hussain Chaudhry | 349 | 26.5 | ||
Liberal Democrats | Brenda Mary Osyth Allen | 191 | 14.5 | ||
Liberal Democrats | Anne Penelope White | 190 | 14.4 | ||
Liberal Democrats | Matthew Stringer | 184 | 14.0 | ||
UKIP | George Pykov | 168 | 12.8 | ||
UKIP | Jocelyn Briffett | 162 | 12.3 | ||
UKIP | Tom Crawley | 157 | 11.9 | ||
Turnout | 3720 | 26.0 | |||
Conservative hold | Swing | ||||
Party | Candidate | Votes | % | ±% | |
---|---|---|---|---|---|
Liberal Democrats | Adrian Rush | 1,556 | 47.4 | ||
Liberal Democrats | Patricia Anne Trull | 1,539 | 46.9 | ||
Conservative | Rob Creer | 1527 | 46.5 | ||
Conservative | Becky Romaine | 1352 | 41.2 | ||
Labour | Ruth Mary Jahans-Price | 183 | 5.6 | ||
Labour | Roger Frederick Jahans-Price | 158 | 4.8 | ||
Turnout | 6315 | 43.1 | |||
Liberal Democrats hold | Swing | ||||
Liberal Democrats gain from Conservative | Swing | ||||
†Formerly 'Chipping Sodbury'
Party | Candidate | Votes | % | ±% | |
---|---|---|---|---|---|
Liberal Democrats | Tony Davis | 1,522 | 68.3 | ||
Liberal Democrats | Louise Anne Harris | 1,516 | 68.0 | ||
Conservative | Ian James Donovan Livermore | 649 | 29.1 | ||
Conservative | Simon Peter Schofield | 614 | 27.5 | ||
Turnout | 4301 | 30.0 | |||
Liberal Democrats hold | Swing | ||||
Party | Candidate | Votes | % | ±% | |
---|---|---|---|---|---|
Conservative | Judy Adams | 1,379 | 45.5 | ||
Conservative | Rachael Anne Hunt | 1,336 | 44.1 | ||
Conservative | Colin Hunt | 1,305 | 43.0 | ||
Labour | Sadik Adam Al-Hassan | 1037 | 34.2 | ||
Labour | Matthew Palmer | 978 | 32.3 | ||
Labour | Jonathan Maytham | 874 | 28.8 | ||
Liberal Democrats | Andrew Paul Riches | 610 | 20.1 | ||
Liberal Democrats | Rachel Claire Hathaway | 569 | 18.8 | ||
Liberal Democrats | Martin William Monk | 447 | 14.7 | ||
Turnout | 8535 | 28.2 | |||
Conservative hold | Swing | ||||
Party | Candidate | Votes | % | ±% | |
---|---|---|---|---|---|
Labour | Adam Paul Monk | 769 | 33.5 | ||
Conservative | Christopher John Wood | 739 | 32.2 | ||
Labour | Ian Keith Mark Scott | 738 | 32.2 | ||
Conservative | John Tucker | 587 | 25.6 | ||
UKIP | Keith Briffett | 345 | 15.0 | ||
Green | Diana Warner | 319 | 13.9 | ||
UKIP | Philip Winter | 280 | 12.2 | ||
Liberal Democrats | Lindsay Jane Gough | 242 | 10.6 | ||
Green | Murali Thoppil | 238 | 10.4 | ||
Liberal Democrats | Ayrden James Pocock | 163 | 7.1 | ||
Turnout | 4420 | 30.3 | |||
Labour hold | Swing | ||||
Conservative gain from Labour | Swing | ||||
†Reduced from 3 seats
Party | Candidate | Votes | % | ±% | |
---|---|---|---|---|---|
Liberal Democrats | Claire Louise Young | 2,174 | 53.3 | ||
Liberal Democrats | Tristan Adam Sutton Clark | 1,979 | 48.5 | ||
Liberal Democrats | Jon Lean | 1,855 | 45.5 | ||
Conservative | Tom Howell | 1590 | 39.0 | ||
Conservative | Marian Joy Gilpin | 1481 | 36.3 | ||
Conservative | Jenna Marie Hale | 1458 | 35.7 | ||
Independent | Linda Williams | 340 | 8.3 | ||
Labour | Roger Edward Millard | 268 | 6.6 | ||
Labour | Jonathan Terence Trollope | 226 | 5.5 | ||
Labour | Terry Trollope | 215 | 5.3 | ||
Turnout | 11586 | 40.8 | |||
Liberal Democrats hold | Swing | ||||
Party | Candidate | Votes | % | ±% | |
---|---|---|---|---|---|
Conservative | Benjamin Paul Burton | 1,818 | 48.4 | ||
Conservative | Jon Hunt | 1,755 | 46.7 | ||
Conservative | David James Griffiths | 1,637 | 43.6 | ||
Labour | AJ Coakham | 1017 | 27.1 | ||
Labour | Paul Harris | 886 | 23.6 | ||
Liberal Democrats | Andy Daer | 829 | 22.1 | ||
Labour | Theodore Jonathan Kent | 828 | 22.0 | ||
Liberal Democrats | Paul Andrew Sayers | 608 | 16.2 | ||
Liberal Democrats | Tim White | 569 | 15.1 | ||
UKIP | Trevor Crotch-Harvey | 444 | 11.8 | ||
Turnout | 10391 | 37.2 | |||
Conservative hold | Swing | ||||
Party | Candidate | Votes | % | ±% | |
---|---|---|---|---|---|
Conservative | June Patricia Bamford | 1,618 | 49.6 | ||
Conservative | Brenda Barbara Langley | 1,527 | 46.8 | ||
Conservative | Jason Pearce | 1,403 | 43.0 | ||
Labour | Caroline Louise White | 777 | 23.8 | ||
Labour | Andy Chubb | 773 | 23.7 | ||
Labour | Wayne Prewett | 712 | 21.8 | ||
Green | Jack Benjamin Cox | 644 | 19.8 | ||
Green | Jenny Vernon | 638 | 19.6 | ||
Green | Joseph Alexander Evans | 569 | 17.5 | ||
Liberal Democrats | Denise Christine Gawn | 246 | 7.5 | ||
Liberal Democrats | Peter Edmund Coley | 240 | 7.4 | ||
Liberal Democrats | Toby Andrew Jefferies | 214 | 6.6 | ||
Turnout | 9361 | 33.5 | |||
Conservative hold | Swing | ||||
Party | Candidate | Votes | % | ±% | |
---|---|---|---|---|---|
Labour | April Janet Lilian Clare Begley | 687 | 48.4 | ||
Labour | Andrea Jane Reid | 594 | 41.8 | ||
Conservative | Tony Griffiths | 500 | 35.2 | ||
Conservative | Andrew Mills | 494 | 34.8 | ||
Liberal Democrats | Sue Walker | 228 | 16.1 | ||
Liberal Democrats | Hossein Pirooz | 211 | 14.9 | ||
Turnout | 2714 | 23.6 | |||
Labour hold | Swing | ||||
Party | Candidate | Votes | % | ±% | |
---|---|---|---|---|---|
Conservative | Christine Price | 1,545 | 61.6 | ||
Conservative | Toby William Savage | 1,369 | 54.6 | ||
Labour | Ron Hardie | 677 | 27.0 | ||
Labour | Pat Penny | 605 | 24.1 | ||
Liberal Democrats | Cheryl Anne Kirby | 330 | 13.2 | ||
Liberal Democrats | Clive Parkinson | 293 | 11.7 | ||
Turnout | 4819 | 33.1 | |||
Conservative hold | Swing | ||||
Party | Candidate | Votes | % | ±% | |
---|---|---|---|---|---|
Labour | Sandie Davis | 785 | 43.6 | ||
Labour | Kim Scudamore | 756 | 42.0 | ||
Conservative | Stewart Hadley-Clarke | 740 | 41.1 | ||
Conservative | Gagan Deep Singh | 679 | 37.7 | ||
Liberal Democrats | Chris Willmore | 225 | 12.5 | ||
Liberal Democrats | Martin Braid Joinson | 217 | 12.0 | ||
Turnout | 3402 | 27.3 | |||
Labour hold | Swing | ||||
Party | Candidate | Votes | % | ±% | |
---|---|---|---|---|---|
Conservative | Elizabeth Bromiley | 923 | 46.9 | ||
Conservative | Samuel Karl Bromiley | 850 | 43.2 | ||
Labour | Pippa Gibbs | 670 | 34.0 | ||
Labour | Barry Malcolm West | 598 | 30.4 | ||
Independent | Nick Barrett | 210 | 10.7 | ||
Liberal Democrats | Kenton James Boon | 186 | 9.5 | ||
Liberal Democrats | Benj Emmerson | 151 | 7.7 | ||
Turnout | 3588 | 27.6 | |||
Conservative hold | Swing | ||||
Party | Candidate | Votes | % | ±% | |
---|---|---|---|---|---|
Labour | Sam William Scott | 328 | 36.4 | ||
UKIP | Ben Walker | 230 | 25.5 | ||
Conservative | Ken Dando | 228 | 25.3 | ||
Liberal Democrats | Dave Hockey | 115 | 12.8 | ||
Turnout | 901 | 24.8 | |||
Labour hold | Swing | ||||
Party | Candidate | Votes | % | ±% | |
---|---|---|---|---|---|
Conservative | Robert Charles Griffin | 483 | 41.7 | ||
Independent | Olga Taylor | 271 | 23.4 | ||
Labour | Alexander Francis Akerman | 206 | 17.8 | ||
Green | Tom Meadowcroft | 118 | 10.2 | ||
Liberal Democrats | Gabrielle Marie Davis | 79 | 6.8 | ||
Turnout | 1157 | 31.4 | |||
Conservative hold | Swing | ||||
Party | Candidate | Votes | % | ±% | |
---|---|---|---|---|---|
Conservative | Matthew Riddle | 1,740 | 54.6 | ||
Conservative | Keith John Burchell | 1,506 | 47.3 | ||
Liberal Democrats | Tony Williams | 1004 | 31.5 | ||
Liberal Democrats | Marion Christine Reeve | 1000 | 31.4 | ||
UKIP | Louis Crawley | 330 | 10.4 | ||
Labour | David Ward | 200 | 6.3 | ||
Labour | Gillian Foxton | 187 | 5.9 | ||
Turnout | 5967 | 41.9 | |||
Conservative hold | Swing | ||||
Party | Candidate | Votes | % | ±% | |
---|---|---|---|---|---|
Labour | Ian Michael Boulton | 1,936 | 58.4 | ||
Labour | Michael Bell | 1,742 | 52.6 | ||
Labour | Katie Morrison Cooper | 1,612 | 48.7 | ||
Conservative | Matt Pitts | 1062 | 32.1 | ||
Conservative | James Lee Hunt | 955 | 28.8 | ||
Conservative | Samson Akinbo | 820 | 24.8 | ||
Liberal Democrats | Guy William Rawlinson | 334 | 10.1 | ||
Liberal Democrats | Wully Perks | 330 | 10.0 | ||
Liberal Democrats | Crispin Toby John Allard | 328 | 9.9 | ||
Turnout | 9119 | 31.0 | |||
Labour hold | Swing | ||||
Party | Candidate | Votes | % | ±% | |
---|---|---|---|---|---|
Conservative | Brian John Allinson | 1,452 | 44.8 | ||
Conservative | Keith Edward Cranney | 1,371 | 42.3 | ||
Conservative | Ernest Derek Brown | 1,317 | 40.6 | ||
Labour | Jenny James | 926 | 28.6 | ||
Labour | Brian Peter Mead | 752 | 23.2 | ||
Labour | Tom Mewies | 733 | 22.6 | ||
Liberal Democrats | Pam Shipp | 628 | 19.4 | ||
Liberal Democrats | John Paul Ford | 590 | 18.2 | ||
Liberal Democrats | Bob Griffin | 575 | 17.7 | ||
UKIP | Fred Hillberg | 477 | 14.7 | ||
Turnout | 8821 | 30.8 | |||
Conservative hold | Swing | ||||
Party | Candidate | Votes | % | ±% | |
---|---|---|---|---|---|
Liberal Democrats | James Edward Arrowsmith | 364 | 50.7 | ||
Conservative | George William Pendrill Maggs | 227 | 31.6 | ||
Labour | Dayley Patrick Gerald Lawrence | 127 | 17.7 | ||
Turnout | 718 | 28.6 | |||
Liberal Democrats hold | Swing | ||||
Party | Candidate | Votes | % | ±% | |
---|---|---|---|---|---|
Liberal Democrats | Shirley Anne Holloway | 2,771 | 70.9 | ||
Liberal Democrats | Maggie Tyrrell | 2,766 | 70.8 | ||
Liberal Democrats | Jayne Stansfield | 2,652 | 67.9 | ||
Conservative | Sue Gillett | 1098 | 28.1 | ||
Conservative | Steve Chubb | 982 | 25.1 | ||
Conservative | Simon Martyn Begbey | 900 | 23.0 | ||
Turnout | 11169 | 39.2 | |||
Liberal Democrats hold | Swing | ||||
Party | Candidate | Votes | % | ±% | |
---|---|---|---|---|---|
Conservative | Nicholas Peter Labuschagne | 1,022 | 54.9 | ||
Conservative | Trevor John Jones | 935 | 50.2 | ||
Liberal Democrats | Peter Anthony Bruce | 529 | 28.4 | ||
Liberal Democrats | Kimberley Lauren Stansfield | 487 | 26.2 | ||
Labour | Anya Louise Hickman | 326 | 17.5 | ||
Labour | Rowan Francis | 316 | 17.0 | ||
Turnout | 3615 | 32.9 | |||
Conservative hold | Swing | ||||
Party | Candidate | Votes | % | ±% | |
---|---|---|---|---|---|
Labour | Pat Rooney | 787 | 44.9 | ||
Labour | Alison Evans | 781 | 44.6 | ||
Conservative | StJohn Timothy Cross | 648 | 37.0 | ||
Conservative | Charlotte Hartill | 585 | 33.4 | ||
Liberal Democrats | James Pringle Corrigan | 294 | 17.0 | ||
Liberal Democrats | Linda Ann Boon | 240 | 13.7 | ||
Turnout | 3335 | 23.7 | |||
Labour hold | Swing | ||||
†Reduced from 3 seats
Party | Candidate | Votes | % | ±% | |
---|---|---|---|---|---|
Liberal Democrats | Ruth Brenda Davis | 1,398 | 66.1 | ||
Liberal Democrats | John Henry Gawn | 1,345 | 63.6 | ||
Conservative | Jo Lewis | 546 | 25.8 | ||
Conservative | Amy Michelle McNeill | 544 | 25.7 | ||
Labour | Kathleen Langley | 157 | 7.4 | ||
Labour | Michael Paul McGrath | 155 | 7.3 | ||
Turnout | 4145 | 32.5 | |||
Liberal Democrats hold | Swing | ||||
Party | Candidate | Votes | % | ±% | |
---|---|---|---|---|---|
Liberal Democrats | Mike Drew | 1,898 | 61.6 | ||
Liberal Democrats | John Anthony Davis | 1,788 | 58.0 | ||
Liberal Democrats | Ben Nutland | 1,768 | 57.3 | ||
Conservative | Liz Brennan | 994 | 32.2 | ||
Conservative | Sonia Williams | 960 | 31.1 | ||
Conservative | Matt Lewis | 937 | 30.4 | ||
Labour | Clare Fiona Beasley | 241 | 7.8 | ||
Labour | Robert John Lomas | 240 | 7.8 | ||
Turnout | 8826 | 35.7 | |||
Liberal Democrats hold | Swing | ||||
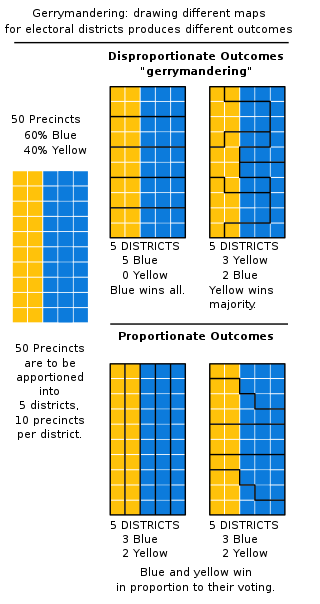
In representative electoral systems, gerrymandering is the political manipulation of electoral district boundaries with the intent to create undue advantage for a party, group, or socioeconomic class within the constituency. The manipulation may involve "cracking" or "packing". Gerrymandering can also be used to protect incumbents. Wayne Dawkins, a professor at Morgan State University, describes it as politicians picking their voters instead of voters picking their politicians.
Proportional representation (PR) refers to any type of electoral system under which subgroups of an electorate are reflected proportionately in the elected body. The concept applies mainly to political divisions among voters. The essence of such systems is that all votes cast – or almost all votes cast – contribute to the result and are effectively used to help elect someone – not just a bare plurality or (exclusively) the majority – and that the system produces mixed, balanced representation reflecting how votes are cast.
The D'Hondt method, also called the Jefferson method or the greatest divisors method, is an apportionment method for allocating seats in parliaments among federal states, or in proportional representation among political parties. It belongs to the class of highest-averages methods. Compared to ideal proportional representation, the D'Hondt method reduces somewhat the political fragmentation for smaller electoral district sizes, where it favors larger political parties over small parties.
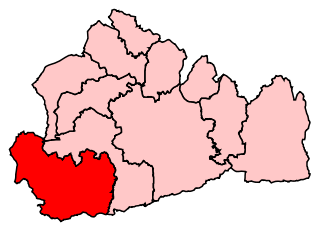
South West Surrey was a constituency in the House of Commons of the UK Parliament. Since its 1983 creation, South West Surrey has been represented only by members of the Conservative Party. From 2005, the seat's MP was Jeremy Hunt, the current chancellor of the Exchequer and the former Culture Secretary, Health Secretary and Foreign Secretary.
Spelthorne is a constituency in Surrey, most recently represented in the House of Commons of the UK Parliament since 2010 by Kwasi Kwarteng, a Conservative, who served as Chancellor of the Exchequer for 38 days in September and October 2022 - with his tenure in the role ending shortly after the mini-budget. Kwarteng did not stand for re-election in the 2024 United Kingdom general election.
East Surrey is a constituency represented in the House of Commons of the UK Parliament since 2019 by Claire Coutinho, a Conservative serving as Secretary of State for Energy Security and Net Zero. The seat covers an affluent area in the English county of Surrey.
A group voting ticket (GVT) is a shortcut for voters in a preferential voting system, where a voter can indicate support for a list of candidates instead of marking preferences for individual candidates. For multi-member electoral divisions with single transferable voting, a group or party registers a GVT before an election with the electoral commission. When a voter selects a group or party above the line on a ballot paper, their vote is distributed according to the registered GVT for that group.
North East Somerset was a constituency in the House of Commons of the UK Parliament. It was represented for the whole of its creation since the 2010 general election by Jacob Rees-Mogg of the Conservative Party.
Historically, the single transferable vote (STV) electoral system has seen a series of relatively modest periods of usage and disusage throughout the world; however, today it is seeing increasing popularity and proposed implementation as a method of proportional representation and a goal of electoral reform. STV has been used in many different local, regional and national electoral systems, as well as in various other types of bodies, around the world.
The Social Democratic Party (SDP) is a political party in the United Kingdom, established in 1990. The current party traces its origin to the Social Democratic Party, which was formed in 1981 by a group of dissident Labour Party Members of Parliament (MPs) and former Cabinet members Roy Jenkins, David Owen, Bill Rodgers and Shirley Williams, who became known as the Gang of Four. The original SDP merged with the Liberal Party in 1988 to form the Liberal Democrats, but Owen, two other MPs and a minority of party activists formed a breakaway group also called the Social Democratic Party immediately afterwards. That continuing party dissolved itself in the aftermath of a by-election in Bootle, in which the party's candidate received fewer votes than Screaming Lord Sutch's Official Monster Raving Loony Party. However, some SDP activists met and voted to continue the party in defiance of its National Executive, leading to the creation in 1990 of the current Social Democratic Party under the leadership of the candidate who lost that by-election. The party has been led since 2018 by William Clouston.
Thornbury and Yate is a constituency represented in the House of Commons of the UK Parliament since the 2024 election by Claire Young, a member of the Liberal Democrats. Encompassing an area to the north-east of Bristol, it is one of three constituencies that make up the South Gloucestershire Unitary Authority Area, along with Filton and Bradley Stoke and Kingswood.
Forest of Dean District Council is the local authority for the Forest of Dean in Gloucestershire, England. The council is elected every four years. Since the last boundary changes in 2019, 38 councillors are elected from 21 wards.
The second Guildford Borough Council full-council elections were held on 6 May 1976. The Conservatives retained control of the council with an increased majority, winning 35 of the 45 seats.
The 2013 elections to Shropshire Council were held on 2 May 2013 as part of the 2013 United Kingdom local elections. These were the second elections to the unitary authority created as part of local government restructuring in Shropshire, following on from the previous elections in 2009. All 74 seats in the 63 electoral divisions were up for election across Shropshire. At the same time, all town and parish council contested elections took place, most notably including Shrewsbury Town Council.
The Surrey County Council election, 2013 took place on 2 May 2013 as part of the 2013 United Kingdom local elections. 81 electoral divisions returned one county councillor each by first-past-the-post voting for a four-year term of office. Following a review, new electoral division boundaries were introduced for this election, increasing the number of councillors from 80 to 81.
Elections to Gloucestershire County Council took place on 2 May 2013 as part of the 2013 United Kingdom local elections. 53 electoral divisions elected one county councillor each by first-past-the-post voting for a four-year term of office. No elections were held in South Gloucestershire, which is a unitary authority outside the area covered by the County Council.
The electoral system of Turkey varies for general, presidential and local elections that take place in Turkey every five years. Turkey has been a multi-party democracy since 1950, with the first democratic election held on 14 May 1950 leading to the end of the single-party rule established in 1923. The current electoral system for electing Members of Parliament to the Grand National Assembly has a 7% election threshold.
The 2019 United Kingdom local elections took place on Thursday 2 May 2019, with 248 English local councils, six directly elected mayors in England, and all 11 local councils in Northern Ireland being contested.
District - District and Parish Elections 2019 - Thursday, 2nd May, 2019