2019 Mid Sussex District Council election

Last updated

2019 Mid Sussex District Council election
Flag of West Sussex.svg
  2015 2 May 2019 (2019-05-02) 2023  

All 54 seats to Mid Sussex District Council
28 seats needed for a majority
 First partySecond party
  No image wide.svg No image wide.svg
Party Conservative Liberal Democrats
Last election54 seats, 57.7%0 seats, 12.5%
Seats won3413
Seat changeDecrease2.svg 20Increase2.svg 13
Popular vote30,94223,356
Percentage40.0%30.2%
SwingDecrease2.svg 17.5%Increase2.svg 17.7%

 Third partyFourth party
  No image wide.svg No image wide.svg
Party Independent Green
Last election0 seats, 1.5%0 seats, 8.5%
Seats won43
Seat changeIncrease2.svg 4Increase2.svg 3
Popular vote6,3208,845
Percentage8.2%11.4%
SwingIncrease2.svg 6.7%Increase2.svg 2.9%

Mid Sussex UK ward map 2019.svg
Winner of each seat at the 2019 Mid Sussex District Council election

Council control before election


Conservative

Council control after election


Conservative

The 2019 Mid Sussex District Council election took place on Thursday 2 May 2019 to elect members of Mid Sussex District Council in West Sussex, England. [1]

Contents

After the election, the composition of the council was as follows:

Summary

Election result

2019 Mid Sussex District Council election
PartyCandidatesSeatsGainsLossesNet gain/lossSeats %Votes %Votes+/−
  Conservative 5434020Decrease2.svg 2063.040.030,942–17.5
  Liberal Democrats 3413130Increase2.svg 1324.130.223,356+17.7
  Independent 8440Increase2.svg 47.28.26,320+6.7
  Green 18330Increase2.svg 35.611.48,845+2.9
  Labour 27000Steady2.svg0.09.16,999–2.8
  UKIP 5000Steady2.svg0.01.1826–6.7

Ward results

Ardingly and Balcombe

Ardingly and Balcombe
PartyCandidateVotes%±%
Conservative Gary Marsh 684 44.4
Conservative Andrew MacNaughton 642 41.7
Liberal Democrats Henry Le Fleming47030.5
Green Gillian Maher40926.5
Liberal Democrats Peter Cox40426.2
Labour Micah Roberts19212.5
Turnout 1,56733.8
Conservative hold
Conservative hold

Ashurst Wood

Ashurst Wood
PartyCandidateVotes%±%
Conservative John Belsey 546 69.9 -2.1
Liberal Democrats James Thompson23530.1+30.1
Majority
Turnout 80637.9
Conservative hold Swing

Bolney

Bolney
PartyCandidateVotes%±%
Conservative Judith Llewellyn-Burke 420 49.4 -2.8
Liberal Democrats Nigel Cook16219.1-9.3
Green Susan Kelly11513.5+13.5
UKIP Peter Hopgood9811.5-7.9
Labour David Jones556.5+6.5
Majority
Turnout 85439.0
Conservative hold Swing

Burgess Hill Dunstall

Burgess Hill Dunstall
PartyCandidateVotes%±%
Conservative Emma Coe-Gunnell White 550 41.6
Conservative Samantha Smith 503 38.0
Green John Fernandez50238.0
Liberal Democrats Stuart Condie47535.9
Labour Simon Hayward20215.3
Labour Pamela Haigh16812.7
Majority
Turnout 1,34333.8
Conservative hold
Conservative hold

Burgess Hill Franklands

Burgess Hill Franklands
PartyCandidateVotes%±%
Liberal Democrats Janice Henwood 1,054 60.9
Liberal Democrats Graham Allen 1,021 59.0
Conservative Richard Cherry52830.5
Conservative Andrew Landriani50729.3
Labour Gemma Bolton17810.3
Labour David Chalkley1156.6
Turnout 1,76943.9
Liberal Democrats gain from Conservative

Burgess Hill Leylands

Burgess Hill Leylands
PartyCandidateVotes%±%
Liberal Democrats Simon Hicks 800 54.6
Green Anne Miles-Eves 745 50.8
Conservative Prudence Moore41528.3
Conservative Elizabeth Kelly33422.8
UKIP Stephen Curryer18112.3
Labour Tara Greatorex1359.2
Labour Linda Greatorex1258.5
Turnout 1,47239.9
Liberal Democrats gain from Conservative
Green gain from Conservative

Burgess Hill Meeds

Burgess Hill Meeds
PartyCandidateVotes%±%
Liberal Democrats Robert Eggleston 818 52.2
Liberal Democrats Tofojjul Hussain 657 42.0
Conservative Anne Jones43527.8
Conservative Adam White36923.6
Labour Elaine Bolton24915.9
UKIP Christopher French19412.4
Labour Ian Greatorex17010.9
Turnout 1,58141.4
Liberal Democrats gain from Conservative

Burgess Hill St. Andrew's

Burgess Hill St. Andrew's
PartyCandidateVotes%±%
Green Matthew Cornish 686 46.2
Liberal Democrats Roger Cartwright 673 45.4
Conservative Colin Holden47632.1
Labour Tony Balsdon44229.8
Conservative Raymond Smith40227.1
Turnout 1,51134.7
Green gain from Conservative
Liberal Democrats gain from Conservative

Burgess Hill Victoria

Burgess Hill Victoria
PartyCandidateVotes%±%
Independent Peter Chapman 950 62.3
Liberal Democrats Lee Gibbs 686 45.0
Conservative Mandy Thomas-Atkin34622.7
Conservative Christopher Thomas-Atkin33722.1
Labour Richard Neville26717.5
Turnout 1,54134.9
Independent gain from Conservative
Liberal Democrats gain from Conservative

Copthorne and Worth

Copthorne and Worth
PartyCandidateVotes%±%
Independent Paul Budgen 903 64.9
Independent Christopher Phillips 671 48.2
Conservative Anthony Dorey48534.9
Conservative Trevor Hodsdon44532.0
Turnout 1,41035.9
Independent gain from Conservative

Crawley Down and Turners Hill

Crawley Down and Turners Hill
PartyCandidateVotes%±%
Independent Ian Gibson 1,552 72.2
Conservative Roger Webb 831 38.6
Conservative Philip Coote 647 30.1
Green Sean Betts62329.0
Conservative Bruce Forbes52924.6
Turnout 2,17037.5
Independent gain from Conservative
Conservative hold
Conservative hold

Cuckfield

Cuckfield
PartyCandidateVotes%±%
Conservative Peter Bradbury 720 44.1
Conservative Robert Salisbury 674 41.2
Liberal Democrats Josephine Notaras57134.9
Liberal Democrats Stephen Blanch53632.8
Green Catherine Edminson40224.6
Independent Benedict White1629.9
Turnout 1,65237.6
Conservative hold
Conservative hold

East Grinstead Ashplats

East Grinstead Ashplats
PartyCandidateVotes%±%
Conservative Elizabeth Bennett 894 71.9
Conservative Margaret Belsey 807 64.9
Labour Alice Tyrrell29924.1
Labour Martin Jeremiah29223.5
Turnout 1,33529.7
Conservative hold
Conservative hold

East Grinstead Baldwins

East Grinstead Baldwins
PartyCandidateVotes%±%
Conservative Julie Mockford 679 56.5
Conservative Norman Webster 506 42.1
Independent Norman Mockford42435.3
Liberal Democrats Fathi Tarada39032.5
Turnout 1,22030.4
Conservative hold
Conservative hold

East Grinstead Herontye

East Grinstead Herontye
PartyCandidateVotes%±%
Conservative Adam PeacockUnopposed
Conservative Dick SweatmanUnopposed
Majority
Turnout
Conservative hold
Conservative hold

East Grinstead Imberhorne

East Grinstead Imberhorne
PartyCandidateVotes%±%
Conservative Heidi BrunsdonUnopposed
Conservative Rex WhittakerUnopposed
Majority
Turnout
Conservative hold
Conservative hold

East Grinstead Town

East Grinstead Town
PartyCandidateVotes%±%
Conservative Neville Walker 574 47.6
Conservative John Dabell 537 44.5
Independent Stuart Pilbrow39032.3
Labour Tess Fensterheim26622.0
Labour David Wilbraham25521.1
UKIP Ian Simcock16713.8
Turnout 1,22929.1
Conservative hold
Conservative hold

Hassocks

Hassocks
PartyCandidateVotes%±%
Liberal Democrats Susan Hatton 2,170 65.2
Liberal Democrats Benedict Dempsey 1,721 51.7
Liberal Democrats Alexander Sparasci 1,606 48.2
Conservative Michelle Binks86826.1
Conservative Alexander Simmons71721.5
Conservative Helen Bedford68320.5
Labour Victoria Standfast51015.3
Green Moira Monteith44913.5
Labour Nicholas Owens42312.7
Labour David Hammond40612.2
Turnout 3,35253.0
Liberal Democrats gain from Conservative

Haywards Heath Ashenground

Haywards Heath Ashenground
PartyCandidateVotes%±%
Liberal Democrats Richard Bates 568 38.4
Conservative Anne Bourtup 521 35.2
Liberal Democrats Stephanie Inglesfield50534.1
Conservative Howard Mundin47131.8
Green Matthew Brewin34223.1
Labour Dean Finch32521.9
Turnout 1,51136.4
Liberal Democrats gain from Conservative
Conservative hold

Haywards Heath Bentswood

Haywards Heath Bentswood
PartyCandidateVotes%±%
Conservative Stephen Hillier 588 43.3
Conservative Rachel Cromie 546 40.2
Liberal Democrats Leila Wilson41930.9
Liberal Democrats Hugh Faithfull37227.4
Green Jack Langley36326.8
UKIP Howard Burrell18613.7
Turnout 1,38231.1
Conservative hold
Conservative hold

Haywards Heath Heath

Haywards Heath Heath
PartyCandidateVotes%±%
Conservative Sandra Ellis 718 47.0
Conservative Clive Laband 612 40.0
Green Richard Nicholson50132.8
Liberal Democrats Susan Knight37624.6
Labour Sarah Greenslade33021.6
Liberal Democrats Riikka Jokelainen32621.3
Turnout 1,58436.0
Conservative hold
Conservative hold

Haywards Heath Franklands

Haywards Heath Franklands
PartyCandidateVotes%±%
Conservative Roderick Clarke 598 51.2
Conservative Michael Pulfer 514 44.0
Liberal Democrats James France31026.6
Green David Woolley29925.6
Liberal Democrats Tristan Inglesfield26422.6
Labour Thomas Martyn19316.5
Turnout 1,20629.5
Conservative hold
Conservative hold

Haywards Heath Lucastes

Haywards Heath Lucastes
PartyCandidateVotes%±%
Conservative Dana De Mierre 808 47.6
Conservative James Knight 762 44.9
Liberal Democrats Alison Rees51230.2
Liberal Democrats Nicholas Chapman47427.9
Green Allan Murray41024.2
Labour Paul Kenny27516.2
Turnout 1,72733.6
Conservative hold
Conservative hold

High Weald

High Weald
PartyCandidateVotes%±%
Green Paul Brown 751 49.8
Conservative Linda Stockwell 576 38.2
Conservative Lorraine Nunes-Carvalho51934.4
Independent Christopher Hersey48332.1
Green Jonathan Lewis46330.7
Turnout 1,51739.2
Green gain from Conservative
Conservative hold

Hurstpierpoint and Downs

Hurstpierpoint and Downs
PartyCandidateVotes%±%
Liberal Democrats Alison Bennett 1,215 47.8
Liberal Democrats Rodney Jackson 967 38.0
Conservative Colin Trumble 933 36.7
Conservative John Wilkinson92836.5
Conservative Anthony Watts Williams79531.3
Liberal Democrats Paul Herve73929.1
Green Lesley Burdett60823.9
Green Nicholas Dearden42416.7
Labour Norah O'Hare34913.7
Labour Fred Bor Burns2399.4
Turnout 2,58540.6
Liberal Democrats gain from Conservative
Conservative hold

Lindfield

Lindfield
PartyCandidateVotes%±%
Conservative Andrew Lea 1,011 39.8
Conservative Jonathan Ash-Edwards 985 38.8
Conservative Anthea Lea 967 38.1
Independent Margaret Hersey78530.9
Liberal Democrats Anne-Marie Lucraft75329.7
Green Peter Wemyss-Gorman75329.7
Liberal Democrats Paul Lucraft62424.6
Liberal Democrats Cavan Wood48319.0
Labour Linda Grace28511.2
Labour Lisa Desbruslais25410.0
Turnout 2,55142.2
Conservative hold
Conservative hold
Conservative hold

By-elections

Copthorne and Worth

Copthorne and Worth: 6 May 2021
PartyCandidateVotes%±%
Conservative Bruce Forbes 810 61.6
Green Matthew Brewin28421.6
Independent Norman Mockford22116.8
Majority52640.0
Turnout 1,32333.2
Registered electors 3,982
Conservative gain from Independent Swing

Ardingly and Balcombe

Ardingly and Balcombe: 8 July 2021
PartyCandidateVotes%±%
Green Jenny Edwards 452 36.9
Conservative Lorraine Nunes-Carvalho40933.4
Liberal Democrats Ben Jerrit34027.8
Independent Carole Steggles231.9
Majority433.5
Turnout 1,22524.8
Registered electors 4,942
Green gain from Conservative Swing

Bolney

Bolney: 12 September 2022
PartyCandidateVotes%±%
Conservative Kristy Adams 301 50.6
Liberal Democrats Fiona Jackson16327.4
Labour Andrew Foster6611.1
Monster Raving Loony Baron von Thunerclap305.0
Green Sue Kelly284.7
Independent Norman Mockford71.2
Majority13823.2
Turnout 73026.5
Registered electors 2,248
Conservative hold Swing

Related Research Articles

<span class="mw-page-title-main">Mid Sussex District</span> Non-metropolitan district in England

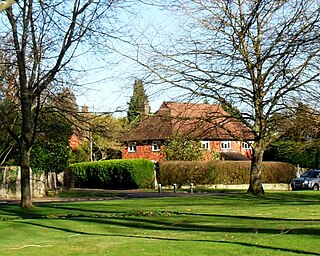
Mid Sussex is a local government district in West Sussex, England. The largest town is Haywards Heath, where the council is based. The district also contains the towns of Burgess Hill and East Grinstead plus surrounding rural areas, including many villages. The district includes part of the South Downs National Park and part of the designated Area of Outstanding Natural Beauty of High Weald, including sections of Ashdown Forest. The district contains most headwaters of the River Ouse. Its largest body of water is Ardingly reservoir which is used by watersports clubs. At the 2021 census the district had a population of 152,949.

<span class="mw-page-title-main">Wealden District</span> District in East Sussex, England

Wealden is a local government district in East Sussex, England. Its council is based in Hailsham, the district's largest town. The district also includes the towns of Crowborough, Polegate and Uckfield, along with numerous villages and surrounding rural areas. The district's name comes from the Weald, the landscape and ancient woodland which occupies much of the centre and north of the area.

<span class="mw-page-title-main">Tandridge District</span> Non-metropolitan district in England

Tandridge is a local government district in east Surrey, England. Its council is based in Oxted, although the largest settlement is Caterham; other notable settlements include Warlingham, Godstone and Lingfield. In mid-2019, the district had an estimated population of 88,129.

<span class="mw-page-title-main">Rother District</span> Non-metropolitan district in England

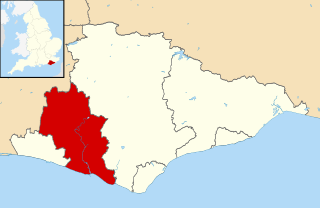
Rother is a local government district in East Sussex, England. Its council is based in Bexhill-on-Sea. The district is named after the River Rother which flows within its boundaries.

<span class="mw-page-title-main">Lewes District</span> Non-metropolitan district in England

Lewes is a local government district in East Sussex, England. The district is named after the town of Lewes. The largest town is Seaford. The district also includes the towns of Newhaven, Peacehaven and Telscombe and numerous villages and surrounding rural areas. The Council is based at Marine Workshops a former industrial building in Newhaven which it shares with East Sussex Colleges Group.

<span class="mw-page-title-main">Horsham District</span> Local government district in West Sussex, England

Horsham is a local government district in West Sussex, England. It is named after the town of Horsham, which is its largest settlement and where the council is based. The district also includes the surrounding rural area and contains many villages, the largest of which are Southwater and Billingshurst. The district includes part of the South Downs National Park and part of the designated Area of Outstanding Natural Beauty of High Weald. At the 2021 census the district had a population of 147,487.

<span class="mw-page-title-main">Mid Sussex (UK Parliament constituency)</span> Parliamentary constituency in the United Kingdom

Mid Sussex is a constituency represented in the House of Commons of the UK Parliament from 2019 by Mims Davies, a Conservative. She is currently a minister in the Department for Work and Pensions.

West Sussex County Council in England is elected every four years.

Mid Sussex District Council is elected every four years.

The 1999 Mid Sussex District Council election took place on 6 May 1999 to elect members of Mid Sussex District Council in West Sussex, England. One third of the council was up for election and the Conservative Party gained overall control of the council from no overall control.

<span class="mw-page-title-main">East Sussex County Council</span>

East Sussex County Council is the upper tier local authority for the non-metropolitan county of East Sussex in England.

<span class="mw-page-title-main">Horsham District Council elections</span>

Horsham District Council in West Sussex, England, is elected every four years.

<span class="mw-page-title-main">West Sussex County Council</span> British administrative authority

West Sussex County Council is the upper tier local authority for the non-metropolitan county of West Sussex in England.

<span class="mw-page-title-main">Haywards Heath East (electoral division)</span>

Haywards Heath East is an electoral division of West Sussex in the United Kingdom, and returns one member to sit on West Sussex County Council.

Elections to West Sussex County Council were held on 7 June 2001, alongside a parliamentary general election. The whole council was up for election, and the Conservative Party remained in control of the council. Turnout across the county ranged from 42.7% in Broadfield to 69.6% in Midhurst, with the county average standing at 60.8%.

<span class="mw-page-title-main">2013 West Sussex County Council election</span>

The West Sussex County Council election, 2013 took place on 2 May 2013, as part of the 2013 United Kingdom local elections. All 71 electoral divisions were up for election, which returned one county councillor each by first-past-the-post voting for a four-year term of office. At this election, the Conservative Party was seeking to retain overall control of the council, and the Liberal Democrats to maintain their position as the main opposition party.

<span class="mw-page-title-main">2015 Mid Sussex District Council election</span> 2015 UK local government election

The 2015 Mid Sussex District Council election took place on 7 May 2015 to elect members of the Mid Sussex District Council in England. It was held on the same day as other local elections.

<span class="mw-page-title-main">2017 West Sussex County Council election</span>

The 2017 West Sussex County Council election took place as part of the 2017 local elections in the UK. All councillors were elected for single-member electoral divisions for a four-year term. The voting system used was first-past-the-post.

<span class="mw-page-title-main">2003 Mid Sussex District Council election</span>

The 2003 Mid Sussex District Council election took place on 1 May 2003 to elect members of Mid Sussex District Council in England. It was held on the same day as other local elections. The Conservatives won a majority of one on the council.

<span class="mw-page-title-main">2007 Mid Sussex District Council election</span>

The 2007 Mid Sussex District Council election took place on 3 May 2007 to elect members of Mid Sussex District Council in England. It was held on the same day as other local elections.

References

  1. "Mid Sussex District Council election results: live updates". www.midsussextimes.co.uk. Retrieved 5 June 2019.