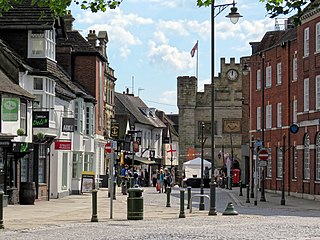
1999 Horsham District Council election

Last updated

The 1999 Horsham District Council election took place on 6 May 1999 to elect members of Horsham District Council in England. [1] It was held on the same day as other local elections. The Conservatives won a majority of 3 on the council, gaining from the Liberal Democrats.

Contents

1999 Horsham District Council election
Flag of England.svg
  1995 6 May 1999 2003  

All 36 seats to Horsham District Council
19 seats needed for a majority
 First partySecond partyThird party
 
Party Conservative Liberal Democrats Independent
Seats won21123
Seat changeIncrease2.svg4Decrease2.svg12Increase2.svg1

Council Composition

Prior to the election, the composition of the council was:

24172
LDemConInd

After the election, the composition of the council was:

21123
ConLDemInd

Results summary

1999 Horsham District Council election
PartySeatsGainsLossesNet gain/lossSeats %Votes %Votes+/−
  Conservative 21Increase2.svg458.350.530,342+8.9
  Liberal Democrats 12Decrease2.svg1233.337.722,640-8.5
  Independent 3Increase2.svg18.34.82,881+0.2
  Labour 0Steady2.svg00.07.14,257-0.6

Ward results

Billingshurst

Billingshurst
PartyCandidateVotes%±%
Conservative Van De Bergh S. Ms. 637 40.8 +10.4
Liberal Democrats Lawes G. 617 39.5 -5.6
Liberal Democrats Baczkowski A. Ms.584
Conservative Hollins J.570
Independent Longhurst K.15810.1-14.4
Labour Scott P.1509.6+9.6
Turnout 31.5
Conservative gain from Liberal Democrats Swing
Liberal Democrats hold Swing

Bramber & Upper Beeding

Bramber & Upper Beeding
PartyCandidateVotes%±%
Conservative Williams S. 549 34.7
Independent Sanford L. 459 29.1
Liberal Democrats Deedman D.41826.5
Labour Neves M.1549.7
Labour Bonsey A. Ms.147
Turnout 32.9
Conservative gain from Liberal Democrats Swing
Independent gain from Conservative Swing

Broadbridge Heath

Broadbridge Heath
PartyCandidateVotes%±%
Liberal Democrats Horner S. Ms. 321 50.6 -26.7
Conservative Bradnum A.20732.6+9.9
Labour Goddard K. Ms.10716.9+16.9
Turnout 29.2
Liberal Democrats hold Swing

Chanctonbury

Chanctonbury
PartyCandidateVotes%±%
Conservative Harris A. 978 67.0 +15.9
Conservative Jenkins E. 880
Liberal Democrats Cooper N.48133.0-15.9
Turnout 34.5
Conservative hold Swing
Conservative gain from Liberal Democrats Swing

Cowfold

Cowfold
PartyCandidateVotes%±%
Conservative Baldwin B. 523 73.9 +10.1
Liberal Democrats Price L.10314.5-21.7
Labour Canham T.8211.6+11.6
Turnout 32.9
Conservative hold Swing

Denne

Denne
PartyCandidateVotes%±%
Conservative Nye R. 1,023 47.6 +5.2
Conservative Charles J. 1,017
Conservative Tobutt P. 1,002
Liberal Democrats Sheldon D.86740.3+1.5
Liberal Democrats Mullarky P.838
Liberal Democrats Yarlett J.741
Labour Thurston J. Ms.26012.1-6.7
Turnout 36.0
Conservative hold Swing

Forest

Forest
PartyCandidateVotes%±%
Liberal Democrats Newman D. 909 52.7 +4.1
Liberal Democrats Rutherford P. Ms. 902
Liberal Democrats Paffett P. 846
Conservative Collins M.63636.9+1.4
Conservative Scott I. Ms.612
Conservative Wilkinson F.598
Labour Skipton-Carter L. Ms.17910.4-5.5
Turnout 30.6
Liberal Democrats hold Swing

Henfield

Henfield
PartyCandidateVotes%±%
Conservative Marsh J. 1,015 39.6 +2.4
Independent Matthews S. Ms. 941 36.8 -10.1
Conservative Cook A. Ms.850
Liberal Democrats Pierce A.31012.1-3.8
Labour Hanford R.29411.5+11.5
Turnout 40.3
Conservative hold Swing
Independent hold Swing

Holbrook

Holbrook
PartyCandidateVotes%±%
Liberal Democrats Millson A. 1,019 45.4 +2.0
Conservative Baldwin A. 1,002 44.7 +7.6
Liberal Democrats Lickiss M.979
Conservative Pratt M.958
Labour Hugl L. Ms.2239.9-9.7
Labour Brown R.211
Turnout 30.3
Liberal Democrats hold Swing
Conservative gain from Liberal Democrats Swing

Itchingfield & Shipley

Itchingfield & Shipley
PartyCandidateVotes%±%
Conservative Vickers C. Ms. 577 69.9 +7.7
Liberal Democrats Bryant M.17521.2-16.6
Labour McGarvey G.749.0+9.0
Turnout 39.2
Conservative hold Swing

Nuthurst

Nuthurst
PartyCandidateVotes%±%
Conservative Ashwell S. Ms. 446 76.8 +13.0
Liberal Democrats Clausen R. Ms.10117.4-18.8
Labour Chapman R.345.9+5.9
Turnout 43.3
Conservative hold Swing

Pulborough & Coldwatham

Pulborough & Coldwatham
PartyCandidateVotes%±%
Conservative Downes M. Ms. 1,066 67.7 +5.4
Conservative Paterson R. 1,023
Liberal Democrats French M.30519.4-18.3
Liberal Democrats Raja S.228
Labour Britz J.20312.9+12.9
Turnout 54.5
Conservative hold Swing

Riverside

Riverside
PartyCandidateVotes%±%
Liberal Democrats Bevis A. 1,061 55.6 +5.0
Liberal Democrats Sully C. Ms. 1,057
Liberal Democrats Clarke P. Ms. 1,052
Conservative Palmer B. Ms.62232.6+0.1
Conservative Mitchell C.566
Conservative Wilkinson R. Ms.537
Labour Nasskau L.22411.7-5.2
Turnout 29.1
Liberal Democrats hold Swing

Roffey North

Roffey North
PartyCandidateVotes%±%
Liberal Democrats Price B. Ms. 806 47.5 +0.9
Liberal Democrats Paffett F. Ms. 731
Conservative Hilliard D.70341.4+6.9
Conservative Watson B.604
Labour Thomas J.18811.1-7.3
Turnout 32.9
Liberal Democrats hold Swing

Rudgwick

Rudgwick
PartyCandidateVotes%±%
Conservative Bargman E. Ms. 514 78.1 +10.4
Liberal Democrats Horner P.10315.7-16.6
Labour Mainwaring E.416.2+6.2
Turnout 32.6
Conservative hold Swing

Rusper

Rusper
PartyCandidateVotes%±%
Conservative Kitchen E. Ms. 475 78.0 +6.3
Labour Street M.6811.2+11.2
Liberal Democrats Brundish D.6610.8-17.5
Turnout 33.1
Conservative hold Swing

Slinfold

Slinfold
PartyCandidateVotes%±%
Liberal Democrats Wright D. 324 50.6 -20.1
Conservative Mawer A.29245.6+16.3
Labour Corthine R.243.8+3.8
Turnout 47.9
Liberal Democrats hold Swing

Southwater

Southwater
PartyCandidateVotes%±%
Conservative Howard I. 1,266 54.6 +12.1
Conservative Dye G. 1,178
Liberal Democrats Stainton J. Ms.82935.7-21.8
Liberal Democrats Stainton P.775
Labour Allen D.2249.7+9.7
Labour Spencer J.171
Turnout 34.4
Conservative gain from Liberal Democrats Swing

Steyning

Steyning
PartyCandidateVotes%±%
Independent Cockman G. 1,011 39.1 +1.5
Conservative Lyth M. Ms. 774 29.9 -1.4
Liberal Democrats Deedman R. Ms.55821.6-9.5
Conservative Galaud M.511
Labour Neves V. Ms.2449.4+9.4
Labour Wheeler D.159
Turnout 37.9
Independent hold Swing
Conservative hold Swing

Storrington

Storrington
PartyCandidateVotes%±%
Conservative Read P. 799 42.6 +7.7
Conservative Butler N. 736
Liberal Democrats Girard M. Ms.50927.1-21.4
Labour Banks P. Ms.25713.7+13.7
Independent Brain J. Ms.20811.1+11.1
Independent Bates K.1045.5+5.5
Turnout 37.8
Conservative gain from Liberal Democrats Swing

Brain J. Ms. was elected in Storrington as a Liberal Democrat in 1995, when this seat was last contested.

Sullington

Sullington
PartyCandidateVotes%±%
Liberal Democrats Banks D. 378 51.8 -18.9
Conservative Urry S.30742.1+12.8
Labour Walter B.456.2+6.2
Turnout 41.6
Liberal Democrats hold Swing

Trafalgar

Trafalgar
PartyCandidateVotes%±%
Liberal Democrats Chapman N. 1,192 54.9 +4.4
Liberal Democrats Costin C. Ms. 1,114
Liberal Democrats Crosbie L. 1,002
Conservative Toubutt V. Ms.75934.9-0.9
Conservative Smith J. Ms.755
Conservative Alder M.737
Labour Dumbrill D. Ms.22110.2-3.5
Turnout 44.8
Liberal Democrats hold Swing

Warnham

Warnham
PartyCandidateVotes%±%
Conservative Burnham J. Ms. 482 77.1 +18.1
Liberal Democrats Pearce T.8914.2+0.3
Labour McDonald K.548.6-18.6
Turnout 42.0
Conservative hold Swing

West Chiltington

West Chiltington
PartyCandidateVotes%±%
Conservative Jackson M. 910 81.5 +8.3
Liberal Democrats Hughes A.12210.9-15.9
Labour Pitt E.847.5+7.5
Turnout 38.6
Conservative hold Swing

West Grinstead

West Grinstead
PartyCandidateVotes%±%
Conservative Howard J. Ms. 646 71.7 +12.6
Labour Taylor C.13514.9-11.5
Liberal Democrats Duke M.12814.1-0.4
Turnout 42.7
Conservative hold Swing

Related Research Articles

<span class="mw-page-title-main">Arun District</span> A local government district in West Sussex, England

Arun is a local government district in West Sussex, England. It contains the towns of Arundel, Bognor Regis and Littlehampton, and takes its name from the River Arun, which runs through the centre of the district.

The 1999 Adur District Council election took place on 6 May 1999 to elect members of Adur District Council in West Sussex, England. One third of the council was up for election and the Liberal Democrat party lost overall control of the council to no overall control.

The 1999 Craven District Council election took place on 6 May 1999 to elect members of Craven District Council in North Yorkshire, England. One third of the council was up for election and the Conservative Party gained overall control of the council from no overall control.

<span class="mw-page-title-main">1999 Harlow District Council election</span>

The 1999 Harlow District Council election took place on 6 May 1999 to elect members of Harlow District Council in Essex, England. One third of the council was up for election and the Labour party stayed in overall control of the council.

<span class="mw-page-title-main">Horsham District Council elections</span>

Horsham District Council in West Sussex, England, is elected every four years.

The 1999 Tandridge District Council election took place on 6 May 1999 to elect members of Tandridge District Council in Surrey, England. One third of the council was up for election and the council stayed under no overall control.

The 1999 Cherwell District Council election took place on 6 May 1999 to elect members of Cherwell District Council in Oxfordshire, England. One third of the council was up for election and the council stayed under no overall control.

The 1999 Winchester Council election took place on 6 May 1999 to elect members of Winchester District Council in Hampshire, England. One third of the council was up for election and the Liberal Democrats stayed in overall control of the council.

The 1999 Stratford-on-Avon District Council election took place on 6 May 1999 to elect members of Stratford-on-Avon District Council in Warwickshire, England. One third of the council was up for election and the council stayed under no overall control.

The 1999 Hart District Council election took place on 6 May 1999 to elect members of Hart District Council in Hampshire, England. One third of the council was up for election and the council stayed under no overall control.

The 1999 Harrogate Borough Council election took place on 6 May 1999 to elect members of Harrogate Borough Council in North Yorkshire, England. One third of the council was up for election and the Liberal Democrats stayed in overall control of the council.

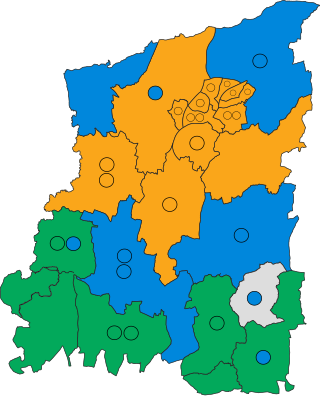
The 2015 Horsham District Council election took place on 7 May 2015 to elect members of Horsham District Council in England. It was held on the same day as other local elections and the 2015 United Kingdom general election. The Conservatives secured a majority of 17, which was the largest majority any party has ever achieved at a Horsham District Council election.

<span class="mw-page-title-main">2019 Horsham District Council election</span>

The 2019 Horsham District Council election took place on 2 May 2019 to elect members of Horsham District Council in England. It was held on the same day as other local elections. Every seat was contested and the Conservatives retained control of the council with a majority of 8.

The 1973 Horsham District Council election was the first ever for the council and took place on 7 June 1973 to elect members of Horsham District Council in England. It was held on the same day as other local elections. Independent councillors secured a majority of two with 23 seats, the Conservatives won 17 and the Liberal Party won 2. Labour also took part in the elections, fielding candidates in Horsham South & Horsham North only. The Liberal Party were successful in Broadbridge Heath and they were able to secure a seat in Storrington. The Conservative Party achieved good results in some rural areas but they were able to win the vast amount of their seats in the town. Independent councillors won a majority of seats in the villages in the district, sometimes unopposed, some later stood as a Conservative candidate three years later in the next set of elections for the Council.

The 1976 Horsham District Council election took place on 6 May 1976 to elect members of Horsham District Council in England. It was held on the same day as other local elections. The Conservatives won a majority of 9 on the council, gaining from Independent. In a number of seats, candidates who stood as an Independent in 1973, when these seats were last contested, stood again as a Conservative Party candidate. Residents' association won their first seat to the council, winning a seat in Henfield. The Liberal Party lost both of their seats from the previous election three years ago.

The 1979 Horsham District Council election took place on 3 May 1979 to elect members of Horsham District Council in England. It was held on the same day as other local elections and the 1979 United Kingdom general election. The Conservatives retained control of the council with 33 seats, a majority of 12. The Independents had eight councillors elected, a decrease of three from last time. The Liberals gained a seat in Bramber & Upper Beeding and the Residents' association held on to their Henfield seat.

The 1983 Horsham District Council election took place on 5 May 1983 to elect members of Horsham District Council in England. It was held on the same day as other local elections. The Conservatives retained control of the council with 35 seats, a majority of 14, Independent candidates won 5 seats and the SDP–Liberal Alliance won 2.

The 1987 Horsham District Council election took place on 7 May 1987 to elect members of Horsham District Council in England. It was held on the same day as other local elections. The Conservatives retained control of the council with 33 seats, a majority of 12. The SDP–Liberal Alliance won 6 seats and Independents won 4.

The 1991 Horsham District Council election took place on 2 May 1991 to elect members of Horsham District Council in England. It was held on the same day as other local elections. The Conservatives retained control of the council with a reduced majority. The Liberal Democrats gained a net total of 7 and Independent candidates had 2 councillors elected.

The 1995 Horsham District Council election took place on 4 May 1995 to elect members of Horsham District Council in England. It was held on the same day as other local elections. The Liberal Democrats gained control of the council from the Conservatives with a 3 seat majority. This was the first time ever the Conservative Party lost control of Horsham District Council since they first won overall control in 1976.

References

  1. Colin Rallings; Michael Thrasher (26 February 2013). "Horsham District Council Election Results 1973-2011" (PDF). Retrieved 9 June 2020.