| ||||||||||||||||||||||
| ||||||||||||||||||||||
All 50 seats to Chichester District Council 26 seats needed for a majority | ||||||||||||||||||||||
---|---|---|---|---|---|---|---|---|---|---|---|---|---|---|---|---|---|---|---|---|---|---|
| ||||||||||||||||||||||
|
Elections to Chichester District Council in West Sussex, United Kingdom were held on 5 May 1983.
The whole council was up for election and resulted in a Conservative majority.
Party | Seats | Gains | Losses | Net gain/loss | Seats % | Votes % | Votes | +/− | |
---|---|---|---|---|---|---|---|---|---|
Conservative | 27 | 3 | 3 | 54.0 | 40.6 | 18,522 | +0.6 | ||
Alliance | 12 | 2 | 1 | 1 | 24.0 | 30.9 | 14,112 | +2.8 | |
Independent | 8 | 1 | 0 | 1 | 16.0 | 15.4 | 7,011 | +3.9 | |
Residents | 2 | 0 | 1 | 1 | 4.0 | 5.7 | 2,597 | –3.9 | |
Independent Liberal | 1 | 1 | 0 | 1 | 2.0 | 0.0 | 0 | N/A | |
Labour | 0 | 0 | 0 | 0.0 | 3.7 | 1,674 | –1.0 | ||
Ind. Conservative | 0 | 0 | 2 | 2 | 0.00 | 2.8 | 1,274 | –0.8 |
27 | 12 | 8 | 2 | 1 |
Conservative | Alliance | Independent | Res. | I.L. |
Party | Candidate | Votes | % | ±% | |
---|---|---|---|---|---|
Conservative | J. Darley | 638 | 82.6 | N/A | |
Alliance | M. D'Arcy | 134 | 17.4 | N/A | |
Turnout | 772 | 52.7 | N/A | ||
Registered electors | 1,456 | ||||
Conservative hold | Swing | ||||
Party | Candidate | Votes | % | ±% | |
---|---|---|---|---|---|
Conservative | J. Stocker | 828 | 34.1 | –2.7 | |
Independent | D. Yden | 666 | 27.4 | –7.2 | |
Independent | J. Lillywhite | 570 | 23.4 | –5.2 | |
Alliance | Q. Cox | 367 | 15.1 | N/A | |
Turnout | 2,431 | 56.0 | –19.3 | ||
Registered electors | 3,148 | ||||
Conservative hold | Swing | ||||
Independent hold | Swing | ||||
Party | Candidate | Votes | % | ±% | |
---|---|---|---|---|---|
Conservative | E. Kirkby-Bott | 414 | 30.9 | N/A | |
Alliance | N. Brooks | 250 | 18.7 | N/A | |
Independent | D. Deans | 140 | 17.4 | N/A | |
Turnout | 804 | 60.0 | N/A | ||
Registered electors | 1,339 | ||||
Conservative hold | Swing | ||||
Party | Candidate | Votes | % | ±% | |
---|---|---|---|---|---|
Conservative | I. Hyde | 433 | 71.0 | N/A | |
Labour | C. Townroe | 177 | 29.0 | N/A | |
Turnout | 610 | 52.0 | N/A | ||
Registered electors | 1,173 | ||||
Conservative hold | Swing | ||||
Party | Candidate | Votes | % | ±% | |
---|---|---|---|---|---|
Alliance | M. French | 870 | 49.3 | –8.4 | |
Alliance | A. French | 819 | |||
Alliance | C. Tupper | 814 | |||
Conservative | P. Combes | 790 | 40.6 | +5.2 | |
Conservative | I. Mays | 657 | |||
Conservative | A. Missen | 614 | |||
Labour | D. Morrison | 269 | 10.1 | –13.6 | |
Labour | P. Norris | 247 | |||
Turnout | 5,080 | 39.9 | –32.0 | ||
Registered electors | 4,954 | ||||
Alliance hold | Swing | ||||
Alliance gain from Conservative | Swing | ||||
Alliance hold | Swing | ||||
Party | Candidate | Votes | % | ±% | |
---|---|---|---|---|---|
Conservative | H. Carlton | 963 | 49.5 | +0.5 | |
Conservative | A. Hue | 913 | |||
Alliance | J. Rankin | 860 | 31.8 | –19.2 | |
Alliance | L. Eyles | 831 | |||
Conservative | A. Smith | 754 | |||
Ind. Conservative | E. Craig | 644 | 12.1 | N/A | |
Independent | M. Bell | 352 | 6.6 | N/A | |
Turnout | 5,317 | 45.9 | –28.2 | ||
Registered electors | 4,543 | ||||
Conservative gain from Alliance | Swing | ||||
Conservative hold | Swing | ||||
Alliance hold | Swing | ||||
Party | Candidate | Votes | % | ±% | |
---|---|---|---|---|---|
Alliance | P. Weston | 937 | 67.8 | –4.2 | |
Alliance | A. Scicluna | 893 | |||
Alliance | K. Smith | 870 | |||
Conservative | D. Clark | 850 | 21.4 | –15.0 | |
Labour | J. Kennett | 167 | 10.8 | N/A | |
Labour | G. Jacobs | 139 | |||
Labour | J. Moran | 123 | |||
Turnout | 3,979 | 44.9 | –26.9 | ||
Registered electors | 4,046 | ||||
Alliance hold | Swing | ||||
Party | Candidate | Votes | % | ±% | |
---|---|---|---|---|---|
Alliance | T. Siggs | 1,020 | 53.8 | +0.6 | |
Alliance | L. Holden | 998 | |||
Alliance | M. Clough | 949 | |||
Conservative | C. Spawton | 898 | 30.8 | –16.0 | |
Conservative | G. Thomas | 802 | |||
Ind. Conservative | F. Craig | 498 | 9.0 | N/A | |
Independent | H. Bell | 347 | 6.3 | N/A | |
Turnout | 5,512 | 49.3 | –23.2 | ||
Registered electors | 4,753 | ||||
Alliance hold | Swing | ||||
Party | Candidate | Votes | % | ±% | |
---|---|---|---|---|---|
Conservative | B. Manicom | 390 | 53.4 | N/A | |
Alliance | T. Wheeler | 341 | 46.6 | N/A | |
Turnout | 731 | 50.5 | N/A | ||
Registered electors | 1,460 | ||||
Conservative hold | Swing | ||||
Party | Candidate | Votes | % | ±% | |
---|---|---|---|---|---|
Conservative | J. Wood | 383 | 65.1 | +1.0 | |
Independent | E. Knight | 205 | 34.9 | N/A | |
Turnout | 588 | 37.0 | –34.8 | ||
Registered electors | 1,584 | ||||
Conservative hold | Swing | ||||
Party | Candidate | Votes | % | ±% | |
---|---|---|---|---|---|
Conservative | C. Craven | 644 | 64.6 | N/A | |
Alliance | J. Matthews | 353 | 35.4 | N/A | |
Turnout | 997 | 38.9 | N/A | ||
Registered electors | 2,589 | ||||
Conservative hold | Swing | ||||
Party | Candidate | Votes | % | ±% | |
---|---|---|---|---|---|
Conservative | S. Hamilton | 835 | 43.6 | +13.1 | |
Independent | M. Gilbert | 614 | 32.1 | –8.2 | |
Independent | M. Jenkins | 466 | 24.3 | N/A | |
Turnout | 1,915 | 59.6 | –12.5 | ||
Registered electors | 2,431 | ||||
Conservative hold | Swing | ||||
Independent hold | Swing | ||||
Party | Candidate | Votes | % | ± | |
---|---|---|---|---|---|
Independent | D. Gauntlett | Unopposed | |||
Turnout | 0 | 0.0 | N/A | ||
Registered electors | 1,902 | ||||
Independent hold |
Party | Candidate | Votes | % | ± | |
---|---|---|---|---|---|
Independent | K. Murray | Unopposed | |||
Turnout | 0 | 0.0 | N/A | ||
Registered electors | 1,502 | ||||
Independent hold |
Party | Candidate | Votes | % | ± | |
---|---|---|---|---|---|
Independent Liberal | M. Stuart Parker | Unopposed | |||
Turnout | 0 | 0.0 | N/A | ||
Registered electors | 1,374 | ||||
Independent Liberal gain from Conservative |
Party | Candidate | Votes | % | ±% | |
---|---|---|---|---|---|
Conservative | P. Cheesman | 541 | 67.7 | +8.1 | |
Alliance | F. Wilton | 258 | 32.3 | –8.1 | |
Turnout | 799 | 43.0 | –31.3 | ||
Registered electors | 1,844 | ||||
Conservative hold | Swing | ||||
Party | Candidate | Votes | % | ±% | |
---|---|---|---|---|---|
Alliance | F. Heald | 317 | 50.1 | –4.4 | |
Conservative | F. Longmore | 316 | 49.9 | +4.4 | |
Turnout | 633 | 45.0 | –28.0 | ||
Registered electors | 1,470 | ||||
Alliance hold | Swing | ||||
Party | Candidate | Votes | % | ±% | |
---|---|---|---|---|---|
Conservative | R. Gibson | 380 | 69.2 | N/A | |
Alliance | S. Schlich | 169 | 30.8 | N/A | |
Turnout | 549 | 43.0 | N/A | ||
Registered electors | 1,205 | ||||
Conservative hold | Swing | ||||
Party | Candidate | Votes | % | ±% | |
---|---|---|---|---|---|
Conservative | R. Hancock | 488 | 78.7 | N/A | |
Ind. Conservative | C. Walsh | 132 | 21.3 | N/A | |
Turnout | 620 | 42.0 | N/A | ||
Registered electors | 1,509 | ||||
Conservative hold | Swing | ||||
Party | Candidate | Votes | % | ±% | |
---|---|---|---|---|---|
Independent | P. Burne | 880 | 36.3 | +1.6 | |
Conservative | J. Boulton | 836 | 34.5 | +8.2 | |
Independent | D. Mott | 706 | 29.1 | N/A | |
Turnout | 2,422 | 43.5 | –31.3 | ||
Registered electors | 3,545 | ||||
Independent hold | Swing | ||||
Conservative gain from Ind. Conservative | Swing | ||||
Party | Candidate | Votes | % | ±% | |
---|---|---|---|---|---|
Conservative | N. Best | 522 | 72.3 | +9.4 | |
Alliance | O. Evans | 126 | 17.5 | N/A | |
Labour | B. Morrison | 124 | 17.2 | N/A | |
Turnout | 722 | 47.0 | –24.3 | ||
Registered electors | 1,644 | ||||
Conservative hold | Swing | ||||
Party | Candidate | Votes | % | ±% | |
---|---|---|---|---|---|
Independent | J. Duncton | 636 | 40.7 | N/A | |
Conservative | R. Bill | 465 | 59.3 | N/A | |
Conservative | W. Mills | 460 | |||
Turnout | 1,561 | 36.7 | N/A | ||
Registered electors | 2,949 | ||||
Independent gain from Conservative | Swing | ||||
Conservative hold | Swing | ||||
Party | Candidate | Votes | % | ± | |
---|---|---|---|---|---|
Conservative | P. Luttman-Johnson | Unopposed | |||
Conservative | T. Micklem | Unopposed | |||
Turnout | 0 | 0.0 | N/A | ||
Registered electors | 3,100 | ||||
Conservative hold | |||||
Conservative hold |
Party | Candidate | Votes | % | ±% | |
---|---|---|---|---|---|
Conservative | P. Janes | 433 | 52.6 | –23.1 | |
Alliance | K. Campbell | 319 | 38.8 | N/A | |
Independent | A. Jackson | 71 | 8.6 | –15.7 | |
Turnout | 823 | 53.3 | –21.8 | ||
Registered electors | 1,468 | ||||
Conservative hold | Swing | ||||
Party | Candidate | Votes | % | ±% | |
---|---|---|---|---|---|
Conservative | M. Cox | 557 | 62.9 | N/A | |
Conservative | I. Gibbons | 543 | |||
Alliance | J. Ratcliff | 405 | 23.2 | N/A | |
Independent | D. Hammond | 243 | 13.9 | N/A | |
Turnout | 1,748 | 31.0 | N/A | ||
Registered electors | 3,477 | ||||
Conservative hold | Swing | ||||
Party | Candidate | Votes | % | ±% | |
---|---|---|---|---|---|
Conservative | J. Whiteman | 640 | 52.5 | +3.3 | |
Conservative | F. Bavister | 593 | |||
Independent | A. Ogden | 400 | 17.0 | N/A | |
Independent | P. Hammond | 360 | 15.3 | N/A | |
Independent | H. Van Raat | 355 | 15.1 | N/A | |
Turnout | 2,348 | 39.0 | –35.9 | ||
Registered electors | 3,314 | ||||
Conservative gain from Ind. Conservative | Swing | ||||
Conservative hold | Swing | ||||
Party | Candidate | Votes | % | ± | |
---|---|---|---|---|---|
Independent | A. Petrie-Hay | Unopposed | |||
Turnout | 0 | 0.0 | N/A | ||
Registered electors | 950 | ||||
Independent hold |
Party | Candidate | Votes | % | ±% | |
---|---|---|---|---|---|
Residents | I. Sutherland | 1,341 | 67.4 | +5.0 | |
Residents | C. Teece | 1,256 | |||
Alliance | A. Moss | 827 | 21.5 | N/A | |
Labour | R. Marsh | 238 | 11.1 | N/A | |
Labour | R. Morris | 190 | |||
Turnout | 3,852 | 34.0 | |||
Registered electors | 4,862 | ||||
Residents hold | Swing | ||||
Alliance gain from Residents | Swing | ||||
Party | Candidate | Votes | % | ± | |
---|---|---|---|---|---|
Conservative | A. Burdett | Unopposed | |||
Turnout | 0 | 0.0 | N/A | ||
Registered electors | 1,576 | ||||
Conservative hold |
Party | Candidate | Votes | % | ± | |
---|---|---|---|---|---|
Independent | J. Mann | Unopposed | |||
Turnout | 0 | 0.0 | N/A | ||
Registered electors | 1,324 | ||||
Independent hold |
Party | Candidate | Votes | % | ± | |
---|---|---|---|---|---|
Conservative | H. Allen | Unopposed | |||
Turnout | 0 | 0.0 | N/A | ||
Registered electors | 2,429 | ||||
Conservative hold |
Party | Candidate | Votes | % | ±% | |
---|---|---|---|---|---|
Conservative | S. Bray | 402 | 51.0 | –3.6 | |
Alliance | C. Jones | 386 | 49.0 | +3.6 | |
Turnout | 788 | 52.0 | –21.7 | ||
Registered electors | 1,504 | ||||
Conservative hold | Swing | ||||
Party | Candidate | Votes | % | ± | |
---|---|---|---|---|---|
Conservative | J. Illius | Unopposed | |||
Turnout | 0 | 0.0 | N/A | ||
Registered electors | 1,945 | ||||
Conservative hold |
Chichester is a local government district in West Sussex, England. It is named after the city of Chichester, which is its largest settlement and where the council is based. The district includes the towns of Midhurst, Petworth and Selsey and surrounding rural areas, including many villages. The district includes part of the South Downs National Park, and Chichester Harbour is a designated Area of Outstanding Natural Beauty. At the 2021 census the district had a population of 124,531.
Frederick Walter Scott Craig was a Scottish psephologist and compiler of the standard reference books covering United Kingdom Parliamentary election results. He originally worked in public relations, compiling election results in his spare time which were published by the Scottish Unionist Party. In the late 1960s he launched his own business as a publisher of reference books, and also compiled various other statistics concerning British politics.
Chichester District Council in West Sussex, England is elected every four years. Since the last boundary changes in 2019, 36 councillors have been elected from 21 wards.
Elections to Chichester District Council in West Sussex, United Kingdom were held on 3 May 2007. The whole council was up for election and the Conservative Party held overall control with an increased majority.
Elections to Chichester District Council in West Sussex, United Kingdom were held on 1 May 2003. The whole council was up for election and the Conservative Party held overall control.
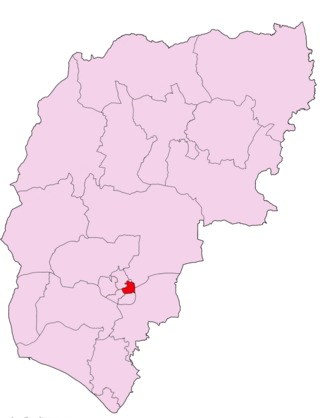
Chichester East is an electoral ward of Chichester District, West Sussex, England and returns two members to sit on Chichester District Council.
Chichester North is an electoral ward of Chichester District, West Sussex, England and returns two members to sit on Chichester District Council.
Chichester South is an electoral ward of Chichester District, West Sussex, England and returns two members to sit on Chichester District Council.
Chichester West is an electoral ward of Chichester District, West Sussex, England and returns two members to sit on Chichester District Council.
Easebourne is an electoral ward of Chichester District, West Sussex, England and returns one member to sit on Chichester District Council.
Fernhurst is an electoral ward of Chichester District, West Sussex, England and returns two members to sit on Chichester District Council.
Harting is an electoral ward of Chichester District, West Sussex, England and returns one member to sit on Chichester District Council.
Petworth is an electoral ward of Chichester District, West Sussex, England and returns one member to sit on Chichester District Council.
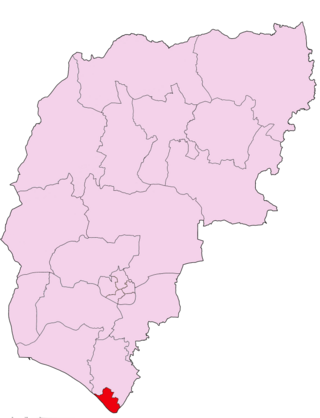
Selsey South is an electoral ward of Chichester District, West Sussex, England and returns two members to sit on Chichester District Council.
Elections to Chichester District Council in West Sussex, United Kingdom were held on 2 May 2019. The whole council was up for election and the Conservative Party had its majority wiped out.
Elections to Chichester District Council in West Sussex, United Kingdom were held on 7 June 1973.
Elections to Chichester District Council in West Sussex, United Kingdom were held on 6 May 1976.
Elections to Chichester District Council in West Sussex, United Kingdom were held on 3 May 1979, the same day as the general election.
The Local Alliance is a political party based in Chichester, England. The party was founded in 2019 and has successfully contested local elections to Chichester District Council and West Sussex County Council.
Elections to Chichester District Council in West Sussex, United Kingdom were held on 4 May 2023. The election took place on the same day as other local elections.