Vale Royal was, from 1974 to 2009, a local government district with borough status in Cheshire, England. It contained the towns of Northwich, Winsford and Frodsham.

Macclesfield was, from 1974 to 2009, a local government district with borough status in Cheshire, England. It included the towns of Bollington, Knutsford, Macclesfield and Wilmslow and within its wider area the villages and hamlets of Adlington, Disley, Gawsworth, Kerridge, Pott Shrigley, Poynton, Prestbury, Rainow, Styal, Sutton and Tytherington.

Lambeth London Borough Council is elected every four years.

Worthing Borough Council is the local authority for Worthing in West Sussex, England. Worthing is a non-metropolitan district with borough status. It forms the lower tier of local government in Worthing, responsible for local services such as housing, planning, leisure and tourism. The council is currently led by the Labour Party. It is based at Worthing Town Hall.
One third of Worthing Borough Council in Worthing, West Sussex, England is elected each year, followed by one year without election. Since the last boundary changes in 2004, 37 councillors are elected from 13 wards.
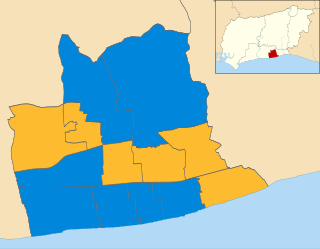
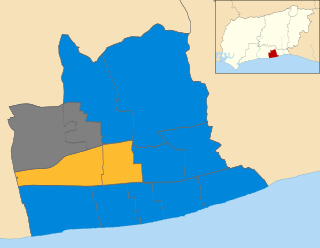
The 2002 Worthing Borough Council election took place on 2 May 2002 to elect members of Worthing Borough Council in West Sussex, England. One third of the council was up for election and the Liberal Democrats gained overall control of the council from the Conservative Party. Overall turnout was 30.67%.
The 2003 Worthing Borough Council election took place on 1 May 2003 to elect members of Worthing Borough Council in West Sussex, England. One third of the council was up for election and the Liberal Democrats lost overall control of the council to no overall control. Overall turnout was 28.61%.

The 2004 Worthing Borough Council election took place on 10 June 2004 to elect members of Worthing Borough Council in West Sussex, England. The whole council was up for election with boundary changes since the last election 2003 increasing the number of seats by 1. The Conservative Party gained overall control of the council from no overall control. Overall turnout was 38.23%.

The 2006 Worthing Borough Council election took place on 4 May 2006 to elect members of Worthing Borough Council in West Sussex, England. One third of the council was up for election and the Conservative Party stayed in overall control of the council.

The 2007 Worthing Borough Council election took place on 3 May 2007 to elect members of Worthing Borough Council in West Sussex, England. One third of the council was up for election and the Conservative Party stayed in overall control of the council.

The 2008 Worthing Borough Council election took place on 1 May 2008 to elect members of Worthing Borough Council in West Sussex, England. One third of the council was up for election and the Conservative Party stayed in overall control of the council. Overall turnout was 35%.

The 2010 Worthing Borough Council election took place on 6 May 2010 to elect members of Worthing Borough Council in West Sussex, England. One third of the council was up for election and the Conservative Party stayed in overall control of the council.

The 2011 Worthing Borough Council election took place on 5 May 2011 to elect members of Worthing Borough Council in West Sussex, England. One third of the council was up for election, with the exception of the two member wards of Durrington and Northbrook. The Conservative Party retained overall control of the council.

The 2014 Worthing Borough Council election took place on 22 May 2014 to elect members of Worthing Borough Council in West Sussex, England. The election took place on the same day as elections to the European Parliament, and saw one third of the council up for election. The Conservative Party retained overall control of the council, gaining four seats, but losing one to the UK Independence Party. The Liberal Democrats suffered five losses, including one to the Green Party, who gaining their first elected seats on the Council.

The 2015 Worthing Borough Council election took place on 7 May 2015 to elect members of Worthing Borough Council in England. It was held on the same day as other local elections and the 2015 general election. The Conservative Party retained its control of the council, winning every seat that was up for election.

The 2016 Worthing Borough Council election took place on 5 May 2016 to elect members of Worthing Borough Council in England. This was on the same day as other local elections.

The 2018 Worthing Borough Council election took place on 3 May 2018 to elect members of Worthing Borough Council. This was on the same day as other local elections. A third of the council was up for election, meaning a total of 13 councillors were elected from all of the council's wards.

The 2019 Worthing Borough Council election took place on 2 May 2019 to elect members of Worthing Borough Council. This was on the same day as other local elections. A third of the council was up for election, meaning a total of 11 councillors were elected from council's wards, there being no election in Durrington and Northbrook in this cycle.

The 2021 Worthing Borough Council election took place on 6 May 2021 to elect members of Worthing Borough Council, on the same day as other UK local elections. This election was originally scheduled to take place on 7 May 2020, but was delayed a year due to the COVID-19 pandemic; 2021 was originally scheduled to be an off-year for Worthing Borough Council elections. A third of the council was up for election, a total of 13 councillors. Candidates elected in 2016 had their term expire at this election.

The 2022 Worthing Borough Council election took place on 5 May 2022 to elect members of Worthing Borough Council, on the same day as other UK local elections.


