| |||||||||||||||||||||||||||||||||||||||||||||||||||||
All 47 seats to Wansdyke District Council 24 seats needed for a majority | |||||||||||||||||||||||||||||||||||||||||||||||||||||
---|---|---|---|---|---|---|---|---|---|---|---|---|---|---|---|---|---|---|---|---|---|---|---|---|---|---|---|---|---|---|---|---|---|---|---|---|---|---|---|---|---|---|---|---|---|---|---|---|---|---|---|---|---|
| |||||||||||||||||||||||||||||||||||||||||||||||||||||
![]() Map showing the composition of Wansdyke District Council following the election. Blue showing Conservative, Red showing Labour, Yellow showing Liberal Democrats and Grey showing Independents. Striped wards have mixed representation. | |||||||||||||||||||||||||||||||||||||||||||||||||||||
|
The 1991 Wansdyke Council election was held on Thursday 2 May 1991 to elect councillors to Wansdyke District Council in England. It took place on the same day as other district council elections in the United Kingdom.
These were the final elections of the district council, before its abolition on 1 April 1996 when it was merged with Bath City Council to form Bath and North East Somerset Council.
The 1991 election saw the Conservatives win the largest number of seats but lose their overall majority.
Wansdyke District Council election, 1991 | |||||||||||||||
---|---|---|---|---|---|---|---|---|---|---|---|---|---|---|---|
Party | Candidates | Votes | |||||||||||||
Stood | Elected | Gained | Unseated | Net | % of total | % | No. | Net % | |||||||
Conservative | 41 | 23 | 2 | 7 | ![]() | 48.9% | 39.7% | 20,674 | ![]() | ||||||
Labour | 39 | 19 | 4 | 1 | ![]() | 42.6% | 39.0% | 20,316 | ![]() | ||||||
Independent | 11 | 4 | 3 | 2 | ![]() | 8.5% | 7.0% | 3,648 | ![]() | ||||||
Liberal Democrats | 17 | 1 | 1 | 0 | ![]() | 2.1% | 13.1% | 6,832 | ![]() | ||||||
Independent Labour | 1 | 0 | 0 | 0 | ![]() | 0% | 0.6% | 327 | N/A | ||||||
Green | 1 | 0 | 0 | 0 | ![]() | 0% | 0.5% | 259 | N/A |
The ward results listed below are based on the changes from the 1987 elections, not taking into account any party defections or by-elections. Sitting councillors are marked with an asterisk (*).
Party | Candidate | Votes | % | ±% | |
---|---|---|---|---|---|
Conservative | S. Andrews | 416 | 56.0 | –8.7 | |
Liberal Democrats | E. Banks | 190 | 25.6 | –9.7 | |
Labour | D. Taylor | 137 | 18.4 | N/A | |
Majority | 226 | 30.4 | –1.0 | ||
Turnout | 55.4 | +3.2 | |||
Registered electors | 1,342 | ||||
Conservative hold | Swing | ||||
Party | Candidate | Votes | % | ±% | |
---|---|---|---|---|---|
Conservative | W. Cox * | 530 | 46.1 | –5.6 | |
Conservative | R. Holder | 467 | – | ||
Liberal Democrats | R. Hidalgo * | 451 | 39.2 | +8.1 | |
Liberal Democrats | R. Davis | 406 | – | ||
Labour | G. White | 169 | 14.7 | –2.5 | |
Labour | J. Hooker | 166 | – | ||
Turnout | 47.8 | ||||
Registered electors | 2,293 | ||||
Conservative hold | Swing | ||||
Party | Candidate | Votes | % | ±% | |
---|---|---|---|---|---|
Conservative | K. Akin-Flenley * | 429 | 54.2 | –15.5 | |
Liberal Democrats | P. Davis | 229 | 29.0 | –1.3 | |
Independent | J. Kent | 133 | 16.8 | N/A | |
Majority | 200 | 25.3 | –14.1 | ||
Turnout | 52.9 | –1.1 | |||
Registered electors | 1,494 | ||||
Conservative hold | Swing | ||||
Party | Candidate | Votes | % | ±% | |
---|---|---|---|---|---|
Conservative | T. Deacon * | 479 | 59.5 | –3.0 | |
Labour | J. Beckerley-Martin | 326 | 40.5 | +3.0 | |
Majority | 153 | 19.0 | |||
Turnout | 45.7 | ||||
Registered electors | 1,760 | ||||
Conservative hold | Swing | ||||
Party | Candidate | Votes | % | ±% | |
---|---|---|---|---|---|
Conservative | L. Bedborough * | 263 | 42.0 | N/A | |
Liberal Democrats | B. Wilson | 174 | 27.8 | +8.3 | |
Labour | C. Wyatt | 122 | 19.5 | +1.1 | |
Independent | B. Stockley | 67 | 10.7 | N/A | |
Majority | 89 | 14.2 | |||
Turnout | 55.4 | ||||
Registered electors | 1,129 | ||||
Conservative gain from Independent | Swing | ||||
Party | Candidate | Votes | % | ±% | |
---|---|---|---|---|---|
Conservative | R. Bentley * | 190 | 50.8 | –11.2 | |
Liberal Democrats | W. Dobson-Smythe | 184 | 49.2 | +11.2 | |
Majority | 6 | 1.6 | |||
Turnout | 51.9 | ||||
Registered electors | 721 | ||||
Conservative hold | Swing | ||||
Party | Candidate | Votes | % | ±% | |
---|---|---|---|---|---|
Independent | B. Symons | 245 | 33.7 | N/A | |
Independent | N. Reed * | 228 | 31.4 | N/A | |
Conservative | A. Telling | 207 | 28.5 | N/A | |
Labour | R. Delaney | 47 | 6.5 | N/A | |
Majority | 17 | 2.3 | |||
Turnout | 64.4 | ||||
Registered electors | 1,129 | ||||
Independent gain from Conservative | Swing | ||||
Party | Candidate | Votes | % | ±% | |
---|---|---|---|---|---|
Conservative | R. Powell * | 331 | 72.1 | N/A | |
Labour | A. Hawkins | 128 | 27.9 | N/A | |
Majority | 203 | 44.2 | |||
Turnout | 42.3 | ||||
Registered electors | 1,086 | ||||
Conservative hold | Swing | ||||
Party | Candidate | Votes | % | ±% | |
---|---|---|---|---|---|
Conservative | T. Rees-Mogg | 352 | 54.2 | –6.1 | |
Labour | M. Whitton | 298 | 45.8 | +6.1 | |
Majority | 54 | 8.3 | |||
Turnout | 50.9 | ||||
Registered electors | 1,276 | ||||
Conservative hold | Swing | ||||
Party | Candidate | Votes | % | ±% | |
---|---|---|---|---|---|
Conservative | D. Miles * | 307 | 42.8 | N/A | |
Independent | P. Britten | 225 | 31.3 | N/A | |
Labour | J. Lingard | 186 | 25.9 | N/A | |
Majority | 82 | 11.4 | |||
Turnout | 51.5 | ||||
Registered electors | 1,394 | ||||
Conservative hold | Swing | ||||
Party | Candidate | Votes | % | ±% | |
---|---|---|---|---|---|
Conservative | S. Davis | 318 | 61.7 | N/A | |
Labour | S. Britton | 197 | 38.3 | N/A | |
Majority | 121 | 23.5 | |||
Turnout | 58.6 | ||||
Registered electors | 879 | ||||
Conservative hold | Swing | ||||
Party | Candidate | Votes | % | ±% | |
---|---|---|---|---|---|
Conservative | B. Cowley * | 309 | 48.4 | –13.8 | |
Liberal Democrats | J. Davies | 250 | 39.1 | +13.7 | |
Labour | A. Davies | 80 | 12.5 | +0.1 | |
Majority | 59 | 9.2 | |||
Turnout | 51.5 | ||||
Registered electors | 1,240 | ||||
Conservative hold | Swing | ||||
Party | Candidate | Votes | % | ±% | |
---|---|---|---|---|---|
Conservative | H. Taviner * | 441 | 81.8 | N/A | |
Labour | E. Titshall | 98 | 18.2 | N/A | |
Majority | 343 | 63.6 | |||
Turnout | 45.9 | ||||
Registered electors | 1,174 | ||||
Conservative hold | Swing | ||||
Party | Candidate | Votes | % | ±% | |
---|---|---|---|---|---|
Independent | J. Hotter * | 342 | 52.1 | N/A | |
Liberal Democrats | S. Ledbetter | 240 | 36.5 | N/A | |
Labour | D. Chalk | 75 | 11.4 | N/A | |
Majority | 102 | 15.5 | |||
Turnout | 44.6 | ||||
Registered electors | 1,474 | ||||
Independent hold | Swing | ||||
Party | Candidate | Votes | % | ±% | |
---|---|---|---|---|---|
Liberal Democrats | E. Flower | 433 | 61.9 | +19.4 | |
Conservative | M. Purse | 267 | 38.1 | –7.6 | |
Majority | 166 | 23.7 | |||
Turnout | 57.8 | ||||
Registered electors | 1,174 | ||||
Liberal Democrats gain from Conservative | Swing | ||||
Party | Candidate | Votes | % | ±% | |
---|---|---|---|---|---|
Conservative | B. Organ * | 1,250 | 44.2 | –7.9 | |
Conservative | J. Neville-Dove * | 1,194 | – | ||
Conservative | L. Sell * | 1,171 | – | ||
Liberal Democrats | G. Roberts | 1,063 | 37.6 | +2.2 | |
Labour | P. Knight | 515 | 18.2 | +5.7 | |
Turnout | 64.3 | ||||
Registered electors | 4,401 | ||||
Conservative hold | Swing | ||||
Party | Candidate | Votes | % | ±% | |
---|---|---|---|---|---|
Independent | T. Evans | 557 | 29.2 | –4.2 | |
Labour | C. Davis | 520 | 27.3 | +2.1 | |
Conservative | M. Pope * | 472 | 24.8 | –16.6 | |
Conservative | T. Skipp | 433 | – | ||
Liberal Democrats | L. Roberts | 358 | 18.8 | N/A | |
Turnout | 68.3 | ||||
Registered electors | 2,794 | ||||
Independent gain from Conservative | Swing | ||||
Labour gain from Conservative | Swing | ||||
Party | Candidate | Votes | % | ±% | |
---|---|---|---|---|---|
Labour | S. Bateman * | 842 | 45.2 | +4.8 | |
Labour | A. Inker | 814 | – | ||
Labour | M. Zamir | 667 | – | ||
Conservative | R. Beech * | 650 | 34.9 | +4.4 | |
Conservative | S. Gill | 585 | – | ||
Conservative | G. Pountain | 578 | – | ||
Liberal Democrats | C. Connett | 371 | 19.9 | –9.1 | |
Turnout | 56.9 | ||||
Registered electors | 3,277 | ||||
Labour hold | Swing | ||||
Labour gain from Conservative | Swing | ||||
Party | Candidate | Votes | % | ±% | |
---|---|---|---|---|---|
Labour | J. Stiddard | 449 | 35.6 | –15.3 | |
Labour | G. Derrick | 432 | – | ||
Conservative | E. Bryant * | 430 | 34.1 | –15.0 | |
Conservative | R. Abram | 423 | – | ||
Liberal Democrats | A. Crouch | 383 | 30.3 | N/A | |
Turnout | 55.1 | ||||
Registered electors | 2,292 | ||||
Labour gain from Conservative | Swing | ||||
Labour hold | Swing | ||||
Party | Candidate | Votes | % | ±% | |
---|---|---|---|---|---|
Labour | M. Collins | 799 | 52.3 | +12.5 | |
Conservative | S. Steel * | 730 | 47.7 | +12.9 | |
Labour | L. Carruthers | 699 | – | ||
Conservative | A. Nash | 631 | – | ||
Turnout | 38.9 | ||||
Registered electors | 3,672 | ||||
Labour hold | Swing | ||||
Conservative hold | Swing | ||||
Party | Candidate | Votes | % | ±% | |
---|---|---|---|---|---|
Labour | B. Perry * | 1,046 | 64.8 | +24.3 | |
Labour | A. French | 849 | – | ||
Conservative | W. Carey | 567 | 35.2 | –3.4 | |
Conservative | S. Green | 564 | – | ||
Turnout | 47.8 | ||||
Registered electors | 3,170 | ||||
Labour hold | Swing | ||||
Labour gain from Conservative | Swing | ||||
Party | Candidate | Votes | % | ±% | |
---|---|---|---|---|---|
Conservative | R. Gay * | 361 | 52.4 | N/A | |
Liberal Democrats | R. Bradbury | 212 | 30.8 | N/A | |
Labour | V. Burton | 116 | 16.8 | N/A | |
Majority | 149 | 21.6 | |||
Turnout | 40.0 | ||||
Registered electors | 1,722 | ||||
Conservative hold | Swing | ||||
Party | Candidate | Votes | % | ±% | |
---|---|---|---|---|---|
Labour | A. Curtis | 850 | 72.2 | +38.9 | |
Labour | D. Hamblin * | 741 | – | ||
Labour | J. Hamblin * | 690 | – | ||
Independent Labour | W. Martin | 327 | 27.8 | N/A | |
Turnout | 31.7 | ||||
Registered electors | 3,714 | ||||
Labour hold | Swing | ||||
Party | Candidate | Votes | % | ±% | |
---|---|---|---|---|---|
Labour | E. Latchem * | 779 | 72.5 | +25.1 | |
Labour | E. Derrick | 736 | – | ||
Conservative | H. Collier | 296 | 27.5 | –11.5 | |
Conservative | L. Perrott | 246 | – | ||
Turnout | 35.9 | ||||
Registered electors | 2,870 | ||||
Labour hold | Swing | ||||
Party | Candidate | Votes | % | ±% | |
---|---|---|---|---|---|
Conservative | A. Webb * | 616 | 72.3 | N/A | |
Labour | B. Parish | 236 | 27.7 | N/A | |
Majority | 380 | 44.6 | |||
Turnout | 57.2 | ||||
Registered electors | 1,490 | ||||
Conservative hold | Swing | ||||
Party | Candidate | Votes | % | ±% | |
---|---|---|---|---|---|
Labour | P. Gay * | 1,292 | 36.6 | –9.0 | |
Independent | B. Shearn * | 1,032 | – | ||
Labour | D. Wyatt | 910 | – | ||
Liberal Democrats | R. Inchley | 655 | 18.6 | +2.1 | |
Independent | M. Whittock | 330 | – | ||
Conservative | A. Curtis | 288 | 8.2 | –4.7 | |
Conservative | D. Jones | 271 | – | ||
Conservative | K. Overmont | 269 | – | ||
Green | M. Boulton | 259 | 7.3 | N/A | |
Turnout | 57.8 | ||||
Registered electors | 3,940 | ||||
Labour hold | Swing | ||||
Independent gain from Labour | Swing | ||||
Labour hold | Swing | ||||
Party | Candidate | Votes | % | ±% | |
---|---|---|---|---|---|
Conservative | G. Wood | 930 | 51.1 | –28.5 | |
Conservative | M. Horler * | 884 | – | ||
Liberal Democrats | D. Hounsell | 641 | 35.2 | N/A | |
Liberal Democrats | M. Davies | 592 | – | ||
Labour | P. Hogg | 249 | 13.7 | –6.7 | |
Turnout | 52.7 | ||||
Registered electors | 3,454 | ||||
Conservative hold | Swing | ||||
Party | Candidate | Votes | % | ±% | |
---|---|---|---|---|---|
Conservative | V. Pritchard * | 261 | 52.7 | +6.0 | |
Independent | E. Harvey | 165 | 33.3 | N/A | |
Labour | C. Stanaway | 69 | 13.9 | N/A | |
Majority | 96 | 19.4 | |||
Turnout | 52.6 | ||||
Registered electors | 941 | ||||
Conservative gain from Independent | Swing | ||||
Party | Candidate | Votes | % | ±% | |
---|---|---|---|---|---|
Conservative | W. Brown | 491 | 42.4 | –8.1 | |
Labour | J. Carter | 343 | 29.6 | –19.9 | |
Independent | E. Potter | 324 | 28.0 | N/A | |
Majority | 148 | 12.8 | |||
Turnout | 59.5 | ||||
Registered electors | 1,946 | ||||
Conservative hold | Swing | ||||
Party | Candidate | Votes | % | ±% | |
---|---|---|---|---|---|
Labour | W. Reakes * | 1,252 | 61.7 | +11.9 | |
Labour | C. Jones * | 1,252 | – | ||
Labour | P. Sas | 1,140 | – | ||
Conservative | N. Silcox | 777 | 38.3 | +12.1 | |
Turnout | 38.7 | ||||
Registered electors | 5,244 | ||||
Labour hold | Swing | ||||
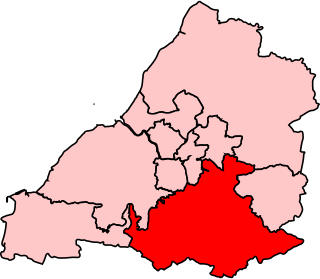
Wansdyke was a county constituency represented in the House of Commons of the Parliament of the United Kingdom. It elected one Member of Parliament (MP) by the first past the post system of election.
Wansdyke was a non-metropolitan district within the County of Avon west of England from 1974 to 1996.
Bath and North East Somerset Council is the local authority for the unitary authority of Bath and North East Somerset, England. The council is elected every four years by the first past the post system of election and currently consists of 59 councillors, representing 33 electoral wards. The Liberal Democrats are currently the largest party on the council, having gained majority control in the 2019 local elections. The council meets at The Guildhall in Bath.
Bath and North East Somerset Council is the local council for the district of Bath and North East Somerset in Somerset, England.
Norton Malreward is a small Somerset village and civil parish 4 miles (6.4 km) south of Bristol, England at the northern edge of the Chew Valley. In 1895 Norton Malreward was combined with the neighbouring hamlet of Norton Hawkfield into a single parish, which has a population of 246.
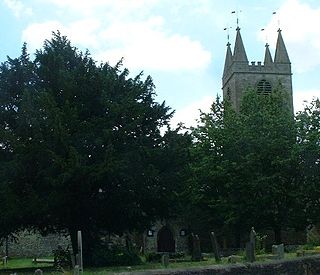
Marksbury is a small village and civil parish on the eastern edge of the affluent Chew Valley in Somerset, about 4 miles (6.4 km) from Keynsham and 7 miles (11.3 km) from Bath on the A39 where it meets the A368. The parish, which includes the villages of Hunstrete and Stanton Prior, has a population of 397.
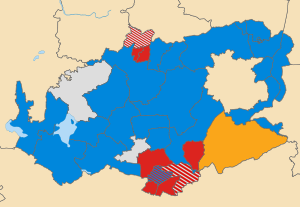
The 1991 United Kingdom local elections were held on Thursday 2 May 1991. The results were a setback for the governing Conservative Party, who were left with their lowest number of councillors since 1973, though their popular vote was an improvement from the 1990 local elections.
Bath City Council was a non-metropolitan district in Avon, England, that administered the city of Bath, Somerset, from 1974 until 1996. The district council replaced the pre-1974 county borough council.
Wansdyke was a non-metropolitan district in Avon, England. It was abolished on 1 April 1996 and replaced by Bath and North East Somerset.
The 2019 Bath and North East Somerset Council election was held on 2 May 2019 to elect members of Bath and North East Somerset Council in England.
The 1995 Bath and North East Somerset Council election was held on Thursday 4 May 1995 to elect councillors to the new Bath and North East Somerset Council in England. It took place on the same day as other district council elections in the United Kingdom.
The 1994 Bath City Council election was held on Thursday 5 May 1994 to elect councillors to Bath City Council in England. It took place on the same day as other district council elections in the United Kingdom. One third of seats were up for election. Two seats were contested in Lambridge and Lansdown due to extra vacancies occurring.
The 1992 Bath City Council election was held on Thursday 7 May 1992 to elect councillors to Bath City Council in England. It took place on the same day as other district council elections in the United Kingdom. One third of seats were up for election. Two seats were contested in Kingsmead due to an extra vacancy occurring.
The 1991 Bath City Council election was held on Thursday 2 May 1991 to elect councillors to Bath City Council in England. It took place on the same day as other district council elections in the United Kingdom. One third of seats were up for election. Two seats were contested in Bathwick due to an extra vacancy occurring.
The 1990 Bath City Council election was held on Thursday 3 May 1990 to elect councillors to Bath City Council in England. It took place on the same day as other district council elections in the United Kingdom. One-third of seats were up for election.
The 1986 Bath City Council election was held on Thursday 8 May 1986 to elect councillors to Bath City Council in England. It took place on the same day as other district council elections in the United Kingdom. One third of seats were up for election.
The 1982 Bath City Council election was held on Thursday 6 May 1982 to elect councillors to Bath City Council in England. It took place on the same day as other district council elections in the United Kingdom. One third of seats were up for election. Two seats were contested in Lambridge due to an extra vacancy occurring.
The 1978 Bath City Council election was held on Thursday 4 May 1978 to elect councillors to Bath City Council in England. It took place on the same day as other district council elections in the United Kingdom. One third of seats were up for election.
The 1976 Bath City Council election was held on Thursday 6 May 1976 to elect councillors to Bath City Council in England. It took place on the same day as other district council elections in the United Kingdom. The entire council was up for election. Following boundary changes the number of wards was increased by one, and the number of seats increased from 45 to 48. This was the second election to the district council, the election saw terms of councillors extended from three to four years. Subsequent elections for the council would be elected by thirds following the passing a resolution under section 7 (4) (b) of the Local Government Act 1972.
The 1987 Wansdyke Council election was held on Thursday 7 May 1987 to elect councillors to Wansdyke District Council in England. It took place on the same day as other district council elections in the United Kingdom.