| |||||||||||||||||||||||||||||||||||||||||||||||||||||
All 65 seats to Bath and North East Somerset Council 33 seats needed for a majority | |||||||||||||||||||||||||||||||||||||||||||||||||||||
---|---|---|---|---|---|---|---|---|---|---|---|---|---|---|---|---|---|---|---|---|---|---|---|---|---|---|---|---|---|---|---|---|---|---|---|---|---|---|---|---|---|---|---|---|---|---|---|---|---|---|---|---|---|
| |||||||||||||||||||||||||||||||||||||||||||||||||||||
Map showing the composition of Bath and North East Somerset Council following the election. Blue showing Conservative, Red showing Labour, Yellow showing Liberal Democrats, and Grey showing Independents. Striped wards have mixed representation. | |||||||||||||||||||||||||||||||||||||||||||||||||||||
|
Elections were held on 1 May 2003 to elect 65 local councillors for Bath and North East Somerset Council. The results are shown below. Following the election, a coalition was formed between the Liberal Democrats and Conservative councillors. Cllr Paul Crossley became leader of the council.
Bath and North East Somerset Council election, 2003 | |||||||||||||||
---|---|---|---|---|---|---|---|---|---|---|---|---|---|---|---|
Party | Candidates | Votes | |||||||||||||
Stood | Elected | Gained | Unseated | Net | % of total | % | No. | Net % | |||||||
Liberal Democrats | 59 | 29 | 4 | 5 | 1 | 44.6% | 36.5% | 29,759 | 3.8% | ||||||
Conservative | 64 | 26 | 10 | 0 | 10 | 40% | 41.9% | 34,167 | 12.1% | ||||||
Labour | 34 | 6 | 0 | 11 | 11 | 9.2% | 13.6% | 11,122 | 13.7% | ||||||
Independent | 15 | 4 | 4 | 0 | 4 | 6.2% | 5.4% | 4,375 | 4.7% | ||||||
Green | 9 | 0 | 0 | 0 | 0% | 2.5% | 2,067 | 2% |
The ward results listed below are based on the changes from the 1999 elections, not taking into account any party defections or by-elections. Sitting councillors are marked with an asterisk (*).
Party | Candidate | Votes | % | ±% | |
---|---|---|---|---|---|
Conservative | Sarah Elizabeth Webb | 680 | 47.5 | +11.9 | |
Conservative | Brian Webber | 613 | – | ||
Liberal Democrats | Jane Marilyn Tapper * | 587 | 41.0 | –7.3 | |
Liberal Democrats | Graham Richard Peter Smith | 561 | – | ||
Independent | Andrew Richard Edwards | 166 | – | ||
Independent | Graham Paul Walker | 82 | – | ||
Turnout | 34.6 | ||||
Registered electors | 4,105 | ||||
Conservative gain from Liberal Democrats | Swing | ||||
Party | Candidate | Votes | % | ±% | |
---|---|---|---|---|---|
Conservative | William Anthony Cox * | 1,280 | 53.2 | –0.2 | |
Conservative | Ian Dewey * | 1,265 | – | ||
Conservative | Martin Veal * | 1,239 | – | ||
Labour | David Walter Lavington | 363 | 15.1 | –2.1 | |
Liberal Democrats | Shirley Ann Wilkins | 346 | 14.4 | –14.7 | |
Liberal Democrats | Lawrence Aggleton | 330 | – | ||
Liberal Democrats | Courtney Dale Lane | 317 | – | ||
Labour | Derek William Brown | 293 | – | ||
Labour | Hendrik Bebber | 290 | – | ||
Green | Michael Boulton | 223 | 9.3 | N/A | |
Independent | Adrian Philip Shute | 195 | 8.1 | N/A | |
Turnout | 39.7 | ||||
Registered electors | 5,539 | ||||
Conservative hold | Swing | ||||
Party | Candidate | Votes | % | ±% | |
---|---|---|---|---|---|
Liberal Democrats | Gitte Dawson * | 660 | 63.5 | +1.4 | |
Conservative | John Doran | 379 | 36.5 | +7.9 | |
Majority | 281 | 27.0 | |||
Turnout | 49.3 | ||||
Registered electors | 2,131 | ||||
Liberal Democrats hold | Swing | ||||
Party | Candidate | Votes | % | ±% | |
---|---|---|---|---|---|
Liberal Democrats | Rosemary Rea Todd * | 434 | 64.2 | +5.6 | |
Conservative | Paul Baines | 242 | 35.8 | –9.3 | |
Majority | 190 | 28.4 | |||
Turnout | 35.1 | ||||
Registered electors | 1,944 | ||||
Liberal Democrats hold | Swing | ||||
Party | Candidate | Votes | % | ±% | |
---|---|---|---|---|---|
Conservative | John Anthony Bailey * | 687 | 53.1 | –6.2 | |
Conservative | Sir Elgar Jenkins | 645 | – | ||
Liberal Democrats | Nicolette Helen Marie Rattle | 529 | 40.9 | +7.4 | |
Liberal Democrats | Kenneth David Drain | 506 | – | ||
Labour | Ryan Thomas Jones | 78 | 6.0 | –1.2 | |
Turnout | 35.9 | ||||
Registered electors | 3,520 | ||||
Conservative hold | Swing | ||||
Party | Candidate | Votes | % | ±% | |
---|---|---|---|---|---|
Conservative | Malcolm Hanney * | 675 | 85.1 | +12.5 | |
Liberal Democrats | Anne Ledbetter | 118 | 14.9 | +4.1 | |
Majority | 557 | 70.2 | |||
Turnout | 43.6 | ||||
Registered electors | 1,820 | ||||
Conservative hold | Swing | ||||
Party | Candidate | Votes | % | ±% | |
---|---|---|---|---|---|
Conservative | Vic Pritchard * | 447 | 65.0 | +6.2 | |
Liberal Democrats | Adrian Mark Usher | 241 | 35.0 | +16.1 | |
Majority | 206 | 30.0 | |||
Turnout | 40.1 | ||||
Registered electors | 1,729 | ||||
Conservative hold | Swing | ||||
Party | Candidate | Votes | % | ±% | |
---|---|---|---|---|---|
Conservative | Stephen Willcox | 405 | 54.0 | +14.2 | |
Labour | Keith Hallett | 212 | 28.3 | –18.5 | |
Liberal Democrats | Gillian Dorothy Dunkerley | 133 | 17.7 | +4.3 | |
Majority | 193 | 25.7 | |||
Turnout | 39.6 | ||||
Registered electors | 1,900 | ||||
Conservative gain from Labour | Swing | ||||
Party | Candidate | Votes | % | ±% | |
---|---|---|---|---|---|
Conservative | Leila Wishart | 765 | 41.3 | +9.4 | |
Liberal Democrats | Roger Symonds * | 698 | 37.7 | –11.8 | |
Conservative | Alan Robert Garrett | 581 | – | ||
Liberal Democrats | Michael James Walter Senior | 525 | – | ||
Independent | Jill Attwood | 390 | – | ||
Independent | Debra Elaine Shute | 114 | – | ||
Turnout | 44.2 | ||||
Registered electors | 3,791 | ||||
Conservative gain from Liberal Democrats | Swing | ||||
Liberal Democrats hold | Swing | ||||
Party | Candidate | Votes | % | ±% | |
---|---|---|---|---|---|
Conservative | Sally Davis * | 623 | 76.9 | +20.4 | |
Liberal Democrats | William Gordon Melling | 187 | 23.1 | +12.0 | |
Majority | 436 | 53.8 | |||
Turnout | 40.1 | ||||
Registered electors | 2,025 | ||||
Conservative hold | Swing | ||||
Party | Candidate | Votes | % | ±% | |
---|---|---|---|---|---|
Conservative | Les Kew * | 569 | 77.1 | +28.4 | |
Liberal Democrats | Jean Rose Elizabeth Vine | 169 | 22.9 | +11.1 | |
Majority | 400 | 54.2 | |||
Turnout | 33.4 | ||||
Registered electors | 2,226 | ||||
Conservative hold | Swing | ||||
Party | Candidate | Votes | % | ±% | |
---|---|---|---|---|---|
Conservative | Bryan Organ * | 1,026 | 51.8 | +7.3 | |
Conservative | Marie Brewer | 1,004 | – | ||
Liberal Democrats | Roger Martin Clark | 755 | 38.1 | –2.9 | |
Liberal Democrats | Jeanne Barbara Pinkerton | 706 | – | ||
Labour | Beverley Michaela Hunt | 201 | 10.1 | –4.4 | |
Turnout | 44.5 | ||||
Registered electors | 4,388 | ||||
Conservative hold | Swing | ||||
Party | Candidate | Votes | % | ±% | |
---|---|---|---|---|---|
Conservative | Charles Gerrish | 586 | 35.6 | +14.0 | |
Liberal Democrats | Keith Kirwan | 578 | 35.1 | –1.7 | |
Conservative | Brian Simmons | 504 | – | ||
Liberal Democrats | John Hudson | 495 | – | ||
Labour | Patricia Ann Hogg * | 482 | 29.3 | –12.3 | |
Labour | Gordon Arthur Derrick * | 463 | – | ||
Turnout | 42.1 | ||||
Registered electors | 3,875 | ||||
Conservative gain from Labour | Swing | ||||
Liberal Democrats gain from Labour | Swing | ||||
Party | Candidate | Votes | % | ±% | |
---|---|---|---|---|---|
Labour | Adrian Inker * | 603 | 46.6 | –20.6 | |
Labour | Hilary Fraser | 485 | – | ||
Conservative | Edward Gough | 357 | 27.6 | +15.4 | |
Liberal Democrats | Andrew Bryce Halliday | 334 | 25.8 | +5.2 | |
Liberal Democrats | Christine Helen Kirwan | 318 | – | ||
Conservative | Harvey Nicholas Haeberling | 309 | – | ||
Turnout | 33.4 | ||||
Registered electors | 3,847 | ||||
Labour hold | Swing | ||||
Party | Candidate | Votes | % | ±% | |
---|---|---|---|---|---|
Liberal Democrats | Andrew Furse * | 615 | 44.3 | –2.4 | |
Liberal Democrats | Carol Paradise | 548 | – | ||
Conservative | Christopher John Butt | 537 | 38.7 | +0.9 | |
Conservative | Andrew Gordon Borland | 532 | – | ||
Green | Eric Lucas | 235 | 16.9 | N/A | |
Turnout | 33.9 | ||||
Registered electors | 3,975 | ||||
Liberal Democrats hold | Swing | ||||
Party | Candidate | Votes | % | ±% | |
---|---|---|---|---|---|
Liberal Democrats | Michael James Kelleher * | 630 | 40.9 | –7.6 | |
Conservative | Bryan Chalker | 615 | 39.9 | +6.2 | |
Conservative | Glenys Chalker | 581 | – | ||
Liberal Democrats | Philip Christopher James | 565 | – | ||
Green | Michael Gordon | 296 | 19.2 | N/A | |
Turnout | 37.4 | ||||
Registered electors | 3,938 | ||||
Liberal Democrats hold | Swing | ||||
Conservative gain from Liberal Democrats | Swing | ||||
Party | Candidate | Votes | % | ±% | |
---|---|---|---|---|---|
Conservative | David Hawkins * | 849 | 63.7 | +6.4 | |
Conservative | Michael John Ringham * | 833 | – | ||
Liberal Democrats | Susan Frances Traill | 484 | 36.3 | +4.4 | |
Liberal Democrats | Robin Steven Fenwick | 480 | – | ||
Turnout | 39.9 | ||||
Registered electors | 3,505 | ||||
Conservative hold | Swing | ||||
Party | Candidate | Votes | % | ±% | |
---|---|---|---|---|---|
Liberal Democrats | David Bellotti | 848 | 44.4 | –16.0 | |
Liberal Democrats | Marian McNeir * | 827 | – | ||
Conservative | Elizabeth Marie Dodgson | 767 | 40.2 | +9.5 | |
Conservative | Zena Gay Tulyholowycz | 680 | – | ||
Green | Wendy Blackman | 293 | 15.4 | N/A | |
Green | Thelma Vivian Grimes | 214 | – | ||
Turnout | 47.8 | ||||
Registered electors | 3,984 | ||||
Liberal Democrats hold | Swing | ||||
Party | Candidate | Votes | % | ±% | |
---|---|---|---|---|---|
Conservative | Tim Warren | 418 | 62.1 | +15.1 | |
Labour | Nicholas John Simon Ajderian | 153 | 22.7 | –16.9 | |
Liberal Democrats | Andrew John Wait | 102 | 15.2 | +1.9 | |
Majority | 265 | 39.4 | |||
Turnout | 33.3 | ||||
Registered electors | 2,032 | ||||
Conservative hold | Swing | ||||
Party | Candidate | Votes | % | ±% | |
---|---|---|---|---|---|
Liberal Democrats | Jane Margaret Lewis | 464 | 31.7 | +14.2 | |
Conservative | Shirley Steel | 396 | 27.0 | +8.2 | |
Conservative | Robin John Maggs | 379 | – | ||
Labour | Matthew Robert Livsey | 366 | 25.0 | –38.7 | |
Liberal Democrats | David Alexander Knapton | 296 | – | ||
Labour | Anne Marie Jovic Sas | 285 | – | ||
Independent | Julie Mary Moorshead | 238 | 16.3 | N/A | |
Turnout | 32.0 | ||||
Registered electors | 4,085 | ||||
Liberal Democrats gain from Labour | Swing | ||||
Conservative gain from Labour | Swing | ||||
Party | Candidate | Votes | % | ±% | |
---|---|---|---|---|---|
Conservative | Chris Watt | 627 | 36.4 | +10.5 | |
Independent | Betty May Perry | 601 | 34.9 | N/A | |
Conservative | Barry James Gillett | 559 | – | ||
Labour Co-op | Fflyff McLaren | 493 | 28.6 | –30.3 | |
Labour Co-op | Stewart Edward Weston | 270 | – | ||
Turnout | 35.8 | ||||
Registered electors | 3,961 | ||||
Conservative gain from Labour | Swing | ||||
Independent gain from Labour | Swing | ||||
Party | Candidate | Votes | % | ±% | |
---|---|---|---|---|---|
Liberal Democrats | Loraine Brinkhurst * | 888 | 57.0 | –4.7 | |
Liberal Democrats | Caroline Roberts * | 780 | – | ||
Conservative | Robert Peter Baker | 669 | 43.0 | +15.7 | |
Conservative | David Elkington | 618 | – | ||
Turnout | 37.7 | ||||
Registered electors | 4,210 | ||||
Liberal Democrats hold | Swing | ||||
Party | Candidate | Votes | % | ±% | |
---|---|---|---|---|---|
Liberal Democrats | Steve Hedges * | 674 | 48.2 | –12.8 | |
Liberal Democrats | Nigel Roberts * | 574 | – | ||
Conservative | Janet Elizabeth McPherson | 523 | 37.4 | +22.6 | |
Conservative | Donald Albert Alfons Spearman | 442 | – | ||
Labour Co-op | Timothy Edwin Pearce | 202 | 14.4 | –9.7 | |
Turnout | 35.7 | ||||
Registered electors | 3,784 | ||||
Liberal Democrats hold | Swing | ||||
Party | Candidate | Votes | % | ±% | |
---|---|---|---|---|---|
Liberal Democrats | Ruth Griffiths * | 714 | 54.7 | –2.1 | |
Liberal Democrats | Shaun McGall * | 689 | – | ||
Conservative | Audrey Archer | 333 | 25.5 | +10.7 | |
Conservative | Colin Frederick Evans | 298 | – | ||
Labour Co-op | Karen Ruth Weston | 258 | 19.8 | –13.5 | |
Turnout | 34.1 | ||||
Registered electors | 3,767 | ||||
Liberal Democrats hold | Swing | ||||
Party | Candidate | Votes | % | ±% | |
---|---|---|---|---|---|
Labour | Harriet Joy Ajderian | 548 | 55.1 | –16.6 | |
Labour | Brian Colin Barrett * | 509 | – | ||
Conservative | William Alan Brown | 280 | 28.1 | N/A | |
Conservative | Joseph Jefferies | 202 | – | ||
Liberal Democrats | David Matthews | 167 | 16.8 | –2.5 | |
Liberal Democrats | William Gordon Melling | 131 | – | ||
Turnout | 25.8 | ||||
Registered electors | 3,883 | ||||
Labour hold | Swing | ||||
Party | Candidate | Votes | % | ±% | |
---|---|---|---|---|---|
Liberal Democrats | Sarah Bevan | 606 | 45.2 | +15.8 | |
Liberal Democrats | Gail Coleshill | 597 | – | ||
Labour | Robert Butt | 498 | 37.2 | –12.1 | |
Labour | Gael Doswell | 356 | – | ||
Conservative | Brian Harbour | 236 | 17.6 | –3.7 | |
Conservative | Colleen Patricia Curtis Jefferies | 222 | – | ||
Turnout | 28.1 | ||||
Registered electors | 4,600 | ||||
Liberal Democrats gain from Labour | Swing | ||||
Party | Candidate | Votes | % | ±% | |
---|---|---|---|---|---|
Conservative | Peter Edwards | 360 | 59.6 | +17.6 | |
Labour | Lawrence Hunt | 164 | 27.2 | –18.7 | |
Liberal Democrats | Rosalind Dawn Smallwood | 80 | 13.2 | +1.1 | |
Majority | 196 | 32.5 | |||
Turnout | 32.2 | ||||
Registered electors | 1,883 | ||||
Conservative gain from Labour | Swing | ||||
Party | Candidate | Votes | % | ±% | |
---|---|---|---|---|---|
Independent | Phyllis Gay * | 658 | – | ||
Independent | Jonathan Jeffrey Gay * | 461 | – | ||
Labour Co-op | Peter Jovic-Sas * | 370 | 32.1 | +0.7 | |
Independent | Allan Brian George Hall | 298 | – | ||
Conservative | Gabriel Batt | 124 | 10.8 | N/A | |
Conservative | Sebastien Long | 109 | – | ||
Turnout | 29.8 | ||||
Registered electors | 3,810 | ||||
Independent gain from Independent Labour | Swing | ||||
Party | Candidate | Votes | % | ±% | |
---|---|---|---|---|---|
Conservative | Francine Haeberling * | 792 | 66.3 | +15.3 | |
Conservative | Gordon Wood * | 724 | – | ||
Liberal Democrats | Raymond Buchanan | 402 | 33.7 | +20.1 | |
Liberal Democrats | Tony Crouch | 334 | – | ||
Turnout | 37.0 | ||||
Registered electors | 3,307 | ||||
Conservative hold | Swing | ||||
Party | Candidate | Votes | % | ±% | |
---|---|---|---|---|---|
Liberal Democrats | Paul Crossley * | 619 | 56.4 | –15.7 | |
Liberal Democrats | Dine Romero | 618 | – | ||
Conservative | Kenneth Philip Cragg | 253 | 23.0 | +11.9 | |
Labour | Grenville Malcolm John Young | 226 | 20.6 | +3.8 | |
Conservative | John Grant Ferrie | 213 | – | ||
Turnout | 30.1 | ||||
Registered electors | 4,052 | ||||
Liberal Democrats hold | Swing | ||||
Party | Candidate | Votes | % | ±% | |
---|---|---|---|---|---|
Labour | Matthew Neal Davis | 485 | 56.4 | –2.6 | |
Conservative | John Kenyon Knibbs | 278 | 32.3 | +0.9 | |
Liberal Democrats | Gwendoline Rose Matthews | 97 | 11.3 | +1.7 | |
Majority | 207 | 24.1 | |||
Turnout | 42.7 | ||||
Registered electors | 2,029 | ||||
Labour hold | Swing | ||||
Party | Candidate | Votes | % | ±% | |
---|---|---|---|---|---|
Liberal Democrats | Tim Ball * | 530 | 61.5 | –10.6 | |
Liberal Democrats | Gerry Curran * | 404 | – | ||
Labour Co-op | Margaret Ann Pearce | 186 | 21.6 | +1.2 | |
Conservative | Maureen Veronica Bailey | 146 | 16.9 | +9.4 | |
Conservative | Roger Smith | 125 | – | ||
Turnout | 23.5 | ||||
Registered electors | 3,531 | ||||
Liberal Democrats hold | Swing | ||||
Party | Candidate | Votes | % | ±% | |
---|---|---|---|---|---|
Liberal Democrats | David Dixon * | 556 | 34.9 | –3.9 | |
Liberal Democrats | Colin Darracott | 546 | – | ||
Conservative | Susan Elizabeth Francesca Yuille | 488 | 30.7 | +5.1 | |
Conservative | William John Yuille | 457 | – | ||
Green | Richard Scrase | 206 | 12.9 | N/A | |
Labour | Peter John Robert Norris | 198 | 12.4 | –19.2 | |
Labour | Bernard William Morgan | 189 | – | ||
Green | Gavin Withers | 152 | – | ||
Independent | Andrew Benedict Tanner | 143 | – | ||
Independent | Nicholas Hales | 50 | – | ||
Turnout | 38.2 | ||||
Registered electors | 4,025 | ||||
Liberal Democrats hold | Swing | ||||
Party | Candidate | Votes | % | ±% | |
---|---|---|---|---|---|
Independent | Chris Cray | 507 | – | ||
Labour | Christopher John Dando | 437 | 40.4 | –35.1 | |
Labour | Wayne Teall | 432 | – | ||
Independent | Mike Collins | 352 | – | ||
Conservative | Mark Terence Davey | 138 | 12.8 | N/A | |
Independent | Barbara Hawking | 120 | – | ||
Turnout | 25.6 | ||||
Registered electors | 4,097 | ||||
Independent gain from Labour | Swing | ||||
Labour hold | Swing | ||||
Party | Candidate | Votes | % | ±% | |
---|---|---|---|---|---|
Liberal Democrats | Sharon Grace Ball * | 543 | 47.1 | –6.5 | |
Liberal Democrats | Lynda Hedges * | 509 | – | ||
Labour | Gillian Wendy Pitman | 373 | 32.3 | –2.1 | |
Labour | Christopher Jones | 356 | – | ||
Conservative | Susan Gillian Henley Green | 238 | 20.6 | +8.6 | |
Conservative | Gervase Antony Manfred O'Donovan | 201 | – | ||
Turnout | 31.3 | ||||
Registered electors | 3,870 | ||||
Liberal Democrats hold | Swing | ||||
Party | Candidate | Votes | % | ±% | |
---|---|---|---|---|---|
Liberal Democrats | Timothy John Bullamore * | 1,068 | 50.2 | +3.5 | |
Conservative | Colin Barrett | 1,061 | 49.8 | +4.5 | |
Liberal Democrats | Peter Andrews | 974 | – | ||
Conservative | Malcolm Lees | 955 | – | ||
Turnout | 50.7 | ||||
Registered electors | 4,030 | ||||
Liberal Democrats hold | Swing | ||||
Conservative gain from Liberal Democrats | Swing | ||||
Party | Candidate | Votes | % | ±% | |
---|---|---|---|---|---|
Liberal Democrats | Peter John Metcalfe * | 653 | 41.8 | –13.3 | |
Liberal Democrats | Nicole Mauricette O'Flaherty * | 628 | – | ||
Conservative | Martin Robert Sykes | 532 | 34.0 | +9.5 | |
Conservative | Brook Whelan | 496 | – | ||
Green | Susan Patricia Bradley | 229 | 14.7 | +4.5 | |
Green | Thelma Vivian Grimes | 219 | – | ||
Labour | Jean Adamson Campbell | 149 | 9.5 | –0.7 | |
Labour | Mary Elizabeth Young | 149 | |||
Turnout | 36.5 | ||||
Registered electors | 4,029 | ||||
Liberal Democrats hold | Swing | ||||
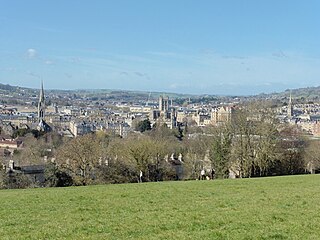
Bath and North East Somerset (B&NES) is a unitary authority district in Somerset, South West England. Bath and North East Somerset Council was created on 1 April 1996 following the abolition of the county of Avon. It is part of the ceremonial county of Somerset.
Norton Radstock is a former civil parish in the Bath and North East Somerset district, in the ceremonial county of Somerset, England, which covered the conurbation of Midsomer Norton, Radstock and Westfield. Created in 1933, the parish was abolished in 2011 and replaced by three smaller parishes.
Wansdyke was a county constituency represented in the House of Commons of the Parliament of the United Kingdom. It elected one Member of Parliament (MP) by the first past the post system of election.
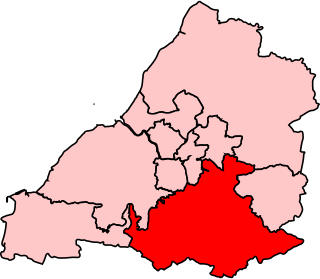
North East Somerset is a constituency represented in the House of Commons of the UK Parliament, since it was created for the 2010 general election, by Jacob Rees-Mogg of the Conservative Party.
North Somerset is a constituency represented in the House of Commons of the UK Parliament since 2010 by Liam Fox, a Conservative who served as Secretary of State for International Trade, a new position in the Cabinet, from 2016 to 2019.
The Chew Valley is an affluent area in North Somerset, England, named after the River Chew, which rises at Chewton Mendip, and joins the River Avon at Keynsham. Technically, the area of the valley is bounded by the water catchment area of the Chew and its tributaries; however, the name Chew Valley is often used less formally to cover other nearby areas, for example, Blagdon Lake and its environs, which by a stricter definition are part of the Yeo Valley. The valley is an area of rich arable and dairy farmland, interspersed with a number of villages.
Bath and North East Somerset Council is the local council for the district of Bath and North East Somerset in Somerset, England.
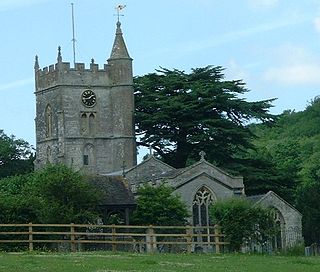
Compton Dando is a small village and civil parish on the River Chew in the affluent Chew Valley in England. It is in the Bath and North East Somerset council area and ceremonial county of Somerset, and lies 7 miles (11.3 km) from Bristol, 8 miles (12.9 km) from Bath, and 3 miles (4.8 km) from Keynsham.
Somerset Premier is an English rugby union league which sits at the eighth level of league rugby union in England involving teams based in the county of Somerset as well as some teams based in Bristol. Originally a single division called Gloucestershire/Somerset, in 2000 the division split into two county leagues called Gloucester Premier and Somerset Premier.
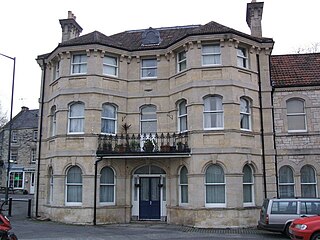
Westfield is a village and civil parish in Bath and North East Somerset in the ceremonial county of Somerset, England. The village lies on the Fosse Way between the towns of Radstock and Midsomer Norton.
Elections were held on 6 May 1999 to elect 65 local councillors for Bath and North East Somerset Council, the second election for the council. The results are show below. After the election, a minority Liberal Democrat administration was formed.
Elections were held on 3 May 2007 to elect 65 local councillors for Bath and North East Somerset Council. The results are show below. Following the elections, a Conservative minority administration was formed. Cllr Francine Haeberling became leader of the council. This replaced the previous Liberal Democrat and Conservative coalition.
The Bath and North East Somerset Council election was held on 5 May 2011 to elect 65 local councillors for Bath and North East Somerset Council. Following the election, a minority Liberal Democrat administration was formed. Cllr Paul Crossley became leader of the council.
The 2015 Bath and North East Somerset Council election took place on 7 May 2015 to elect members of Bath and North East Somerset Council in England. This coincided with other local elections and the 2015 general election.
The 2019 Bath and North East Somerset Council election was held on 2 May 2019 to elect members of Bath and North East Somerset Council in England.
The 2023 Bath and North East Somerset Council election was held on 4 May 2023 to elect members of Bath and North East Somerset Council in England
Frome and East Somerset is a proposed constituency of the House of Commons in the UK Parliament. Further to the completion of the 2023 Periodic Review of Westminster constituencies, it will first be contested at the next general election.