| |||||||||||||||||||||||||||||||||||||||||||||||||||||||||||
21 out of 60 seats to Chester City Council 31 seats needed for a majority | |||||||||||||||||||||||||||||||||||||||||||||||||||||||||||
---|---|---|---|---|---|---|---|---|---|---|---|---|---|---|---|---|---|---|---|---|---|---|---|---|---|---|---|---|---|---|---|---|---|---|---|---|---|---|---|---|---|---|---|---|---|---|---|---|---|---|---|---|---|---|---|---|---|---|---|
| |||||||||||||||||||||||||||||||||||||||||||||||||||||||||||
Winner of each seat at the 2003 Chester City Council election | |||||||||||||||||||||||||||||||||||||||||||||||||||||||||||
|
The 2003 Chester City Council election took place on 1 May 2003 to elect members of Chester City Council in Cheshire, England. [1] This was on the same day as other local elections.
2003 Chester City Council election | ||||||||||
---|---|---|---|---|---|---|---|---|---|---|
Party | This election | Full council | This election | |||||||
Seats | Net | Seats % | Other | Total | Total % | Votes | Votes % | +/− | ||
Liberal Democrats | 8 | 1 | 38.1 | 13 | 21 | 35.0 | 6,765 | 30.3 | +5.0 | |
Labour | 7 | 33.3 | 13 | 20 | 33.3 | 6,334 | 28.4 | –6.0 | ||
Conservative | 5 | 1 | 23.8 | 13 | 18 | 30.0 | 7,423 | 33.2 | –6.1 | |
Independent | 1 | 2 | 4.8 | 0 | 1 | 1.7 | 1,211 | 5.4 | +4.3 | |
UKIP | 0 | 0.0 | 0 | 0 | 0.0 | 328 | 1.5 | N/A | ||
Green | 0 | 0.0 | 0 | 0 | 0.0 | 204 | 0.9 | N/A | ||
CPA | 0 | 0.0 | 0 | 0 | 0.0 | 75 | 0.3 | N/A | ||
Party | Candidate | Votes | % | ±% | |
---|---|---|---|---|---|
Conservative | Eleanor Johnson* | 465 | 78.0 | +6.0 | |
Labour | Benjamin Page | 68 | 11.4 | –6.0 | |
Liberal Democrats | Barry Lockwood | 63 | 10.6 | ±0.0 | |
Majority | 397 | 66.6 | +12.0 | ||
Turnout | 596 | 41.3 | –2.0 | ||
Registered electors | 1,442 | ||||
Conservative hold | Swing | 6.0 | |||
Party | Candidate | Votes | % | ±% | |
---|---|---|---|---|---|
Labour | John Price* | 758 | 66.0 | –8.8 | |
UKIP | Desmond Dodd | 164 | 14.3 | N/A | |
Conservative | Charles Isaac | 150 | 13.1 | –12.1 | |
Liberal Democrats | David Simpson | 76 | 6.6 | N/A | |
Majority | 594 | 51.7 | +2.1 | ||
Turnout | 1,148 | 21.3 | –0.9 | ||
Registered electors | 5,401 | ||||
Labour hold | |||||
Party | Candidate | Votes | % | ±% | |
---|---|---|---|---|---|
Labour | Reginald Jones* | 557 | 73.7 | –5.1 | |
UKIP | Leslie Ingram | 113 | 14.9 | N/A | |
Liberal Democrats | Barbara Yakan | 86 | 11.4 | N/A | |
Majority | 444 | 58.7 | +1.1 | ||
Turnout | 756 | 19.4 | –4.5 | ||
Registered electors | 3,892 | ||||
Labour hold | |||||
Party | Candidate | Votes | % | ±% | |
---|---|---|---|---|---|
Labour | Robert Rudd* | 449 | 52.8 | –6.9 | |
Conservative | Michael Drinkwater | 243 | 28.6 | +1.0 | |
Liberal Democrats | James McCabe | 94 | 11.0 | –1.7 | |
Green | Helen Counsell | 65 | 7.6 | N/A | |
Majority | 206 | 24.2 | –7.8 | ||
Turnout | 851 | 30.9 | –4.5 | ||
Registered electors | 2,757 | ||||
Labour hold | Swing | 4.0 | |||
Party | Candidate | Votes | % | ±% | |
---|---|---|---|---|---|
Liberal Democrats | Ann Farrell* | 713 | 53.2 | +6.7 | |
Conservative | Paul Stewart | 500 | 37.3 | –1.4 | |
Labour | Ethel Price | 126 | 9.4 | –5.4 | |
Majority | 213 | 15.9 | +8.1 | ||
Turnout | 1,339 | 43.6 | +7.7 | ||
Registered electors | 3,071 | ||||
Liberal Democrats hold | Swing | 4.1 | |||
Party | Candidate | Votes | % | ±% | |
---|---|---|---|---|---|
Conservative | John Boughton* | 691 | 56.0 | +1.9 | |
Liberal Democrats | Katrina Hughes | 378 | 30.6 | ±0.0 | |
Labour | Christine Davies | 165 | 13.4 | –1.9 | |
Majority | 313 | 25.4 | +1.9 | ||
Turnout | 1,234 | 36.7 | –4.1 | ||
Registered electors | 3,071 | ||||
Conservative hold | Swing | 1.0 | |||
Party | Candidate | Votes | % | ±% | |
---|---|---|---|---|---|
Labour | Janet Black* | 385 | 43.0 | –9.0 | |
Liberal Democrats | David Mead | 223 | 24.9 | ±0.0 | |
Conservative | Trudy Ryall-Harvey | 200 | 22.3 | –0.8 | |
Green | Stephen Dorrans | 87 | 9.7 | N/A | |
Majority | 162 | 18.1 | –9.0 | ||
Turnout | 895 | 19.2 | –0.8 | ||
Registered electors | 4,659 | ||||
Labour hold | Swing | 4.5 | |||
Party | Candidate | Votes | % | ±% | |
---|---|---|---|---|---|
Conservative | Richard Short* | 927 | 64.9 | +0.9 | |
Labour | Zoe Langmead | 260 | 18.2 | –6.1 | |
Liberal Democrats | Trevor Jones | 241 | 16.9 | +5.3 | |
Majority | 667 | 46.7 | +7.0 | ||
Turnout | 1,428 | 42.1 | –1.4 | ||
Registered electors | 3,390 | ||||
Conservative hold | Swing | 3.5 | |||
Party | Candidate | Votes | % | ||
---|---|---|---|---|---|
Labour | Barry Cowper* | 519 | 80.3 | ||
Labour | Mark Peterson | 452 | 70.0 | ||
Conservative | Andrew Merrill | 321 | 49.7 | ||
Turnout | 1,292 | 39.1 | |||
Registered electors | 3,304 | ||||
Labour hold | |||||
Labour hold | |||||
Party | Candidate | Votes | % | ±% | |
---|---|---|---|---|---|
Liberal Democrats | Jean Nuttall* | 459 | 59.8 | +6.7 | |
Labour | Hilary Harrison | 171 | 22.3 | +0.6 | |
Conservative | John Burke | 66 | 8.6 | N/A | |
CPA | Peter Fabian | 47 | 6.1 | N/A | |
UKIP | Jill Pears | 25 | 3.3 | N/A | |
Majority | 288 | 37.5 | +9.6 | ||
Turnout | 768 | 30.4 | –11.5 | ||
Registered electors | 2,525 | ||||
Liberal Democrats hold | Swing | 3.1 | |||
Party | Candidate | Votes | % | ±% | |
---|---|---|---|---|---|
Liberal Democrats | Beverly Eaton | 658 | 43.7 | –14.4 | |
Labour | Alexander Black | 606 | 40.3 | +10.8 | |
Conservative | Christina Alexander | 161 | 10.7 | –0.8 | |
Green | Helen Trask | 52 | 3.5 | N/A | |
CPA | Stephen Allen | 28 | 1.9 | N/A | |
Majority | 52 | 3.5 | –25.1 | ||
Turnout | 1,505 | 48.9 | +4.9 | ||
Registered electors | 3,080 | ||||
Liberal Democrats hold | Swing | 12.6 | |||
Party | Candidate | Votes | % | ±% | |
---|---|---|---|---|---|
Liberal Democrats | John Moore* | 250 | 33.3 | –9.7 | |
Independent | Mark Williams | 194 | 25.9 | N/A | |
Conservative | Alexandra van der Zwan | 190 | 25.3 | –6.6 | |
Labour | Ann Treloar | 90 | 12.0 | –13.1 | |
UKIP | Allan Weddell | 26 | 3.5 | N/A | |
Majority | 56 | 7.5 | –3.6 | ||
Turnout | 750 | 49.3 | +6.1 | ||
Registered electors | 1,520 | ||||
Liberal Democrats hold | |||||
Party | Candidate | Votes | % | ±% | |
---|---|---|---|---|---|
Liberal Democrats | Joan Fairhurst | 767 | 52.0 | +4.7 | |
Conservative | Pauline Tilley* | 624 | 42.3 | –3.6 | |
Labour | Paul Cornwell | 85 | 5.8 | –1.0 | |
Majority | 143 | 9.7 | +8.4 | ||
Turnout | 1,476 | 51.8 | –0.2 | ||
Registered electors | 2,850 | ||||
Liberal Democrats gain from Independent | Swing | 4.2 | |||
Party | Candidate | Votes | % | ±% | |
---|---|---|---|---|---|
Labour | David Challen* | 712 | 56.9 | –3.7 | |
Conservative | Max Drury | 291 | 23.3 | –16.1 | |
Independent | Arthur Harada | 143 | 11.4 | N/A | |
Liberal Democrats | Pauline McCabe | 105 | 8.4 | N/A | |
Majority | 421 | 33.7 | +12.5 | ||
Turnout | 1,251 | 28.6 | +0.1 | ||
Registered electors | 4,366 | ||||
Labour hold | Swing | 6.3 | |||
Party | Candidate | Votes | % | ±% | |
---|---|---|---|---|---|
Conservative | Keith Ebben | 628 | 58.9 | –14.9 | |
Liberal Democrats | Robert Flannery | 348 | 32.6 | +18.3 | |
Labour | Margaret Violet | 90 | 8.4 | –3.6 | |
Majority | 280 | 26.3 | –33.2 | ||
Turnout | 1,066 | 33.3 | +3.2 | ||
Registered electors | 3,198 | ||||
Conservative gain from Independent | Swing | 16.6 | |||
Party | Candidate | Votes | % | ±% | |
---|---|---|---|---|---|
Conservative | Margaret Parker* | 512 | 79.1 | +4.7 | |
Labour | Brian Roberts | 80 | 12.4 | –13.2 | |
Liberal Democrats | Vera Roberts | 55 | 8.5 | N/A | |
Majority | 432 | 66.8 | +17.9 | ||
Turnout | 647 | 37.3 | +3.0 | ||
Registered electors | 1,736 | ||||
Conservative hold | Swing | 9.0 | |||
Party | Candidate | Votes | % | ±% | |
---|---|---|---|---|---|
Liberal Democrats | Robert Jordan* | 526 | 47.7 | +3.8 | |
Conservative | Karen Bardsley | 381 | 34.5 | –9.7 | |
Labour | Peter Griffiths | 196 | 17.8 | +5.9 | |
Majority | 145 | 13.1 | N/A | ||
Turnout | 1,103 | 36.4 | –2.7 | ||
Registered electors | 3,031 | ||||
Liberal Democrats hold | Swing | 6.8 | |||
Party | Candidate | Votes | % | ±% | |
---|---|---|---|---|---|
Independent | James Haynes* | 874 | 87.8 | N/A | |
Labour | Anthony Pegrum | 121 | 12.2 | –0.9 | |
Majority | 753 | 75.7 | N/A | ||
Turnout | 995 | 32.8 | –4.1 | ||
Registered electors | 3,035 | ||||
Independent hold | |||||
Party | Candidate | Votes | % | ±% | |
---|---|---|---|---|---|
Liberal Democrats | Colin Bain* | 864 | 51.6 | +1.6 | |
Conservative | Gerald Roose | 547 | 32.7 | +1.6 | |
Labour | Brenda Southward | 264 | 15.8 | –3.2 | |
Majority | 317 | 18.9 | ±0.0 | ||
Turnout | 1,675 | 33.6 | –5.5 | ||
Registered electors | 4,984 | ||||
Liberal Democrats hold | Swing | 0.0 | |||
Party | Candidate | Votes | % | ±% | |
---|---|---|---|---|---|
Liberal Democrats | Graham Proctor* | 859 | 54.9 | +2.8 | |
Conservative | Peter Moore-Dutton | 526 | 33.6 | –7.0 | |
Labour | Sara Barnsley | 180 | 11.5 | +4.2 | |
Majority | 333 | 21.3 | N/A | ||
Turnout | 1,726 | 34.9 | –3.6 | ||
Registered electors | 4,483 | ||||
Liberal Democrats hold | Swing | 4.9 | |||
Delaware County, colloquially referred to as Delco, is a county in the Commonwealth of Pennsylvania. With a population of 576,830 as of the 2020 census, it is the fifth-most populous county in Pennsylvania and the third-smallest in area. The county was created on September 26, 1789, from part of Chester County and named for the Delaware River.
Chester is a city in Delaware County, Pennsylvania, United States. It is located in the Delaware Valley on the western bank of the Delaware River between Philadelphia and Wilmington, Delaware. The population of Chester was 32,605 at the 2020 census.
Chester is a cathedral city and the county town of Cheshire, England, on the River Dee, close to the England-Wales border. With a built up area population of 92,400 in 2021, it is the most populous settlement of Cheshire West and Chester and serves as its administrative headquarters. It is also the historic county town of Cheshire and the second-largest settlement in Cheshire after Warrington.
Ellesmere Port and Neston was, from 1974 to 2009, a local government district with borough status in Cheshire, England. It covered the southern part of the Wirral Peninsula, namely that part which is not included in the Metropolitan Borough of Wirral.
Chester was a non-metropolitan local government district of Cheshire, England from 1974 to 2009. It had the status of a city and a borough, and the local authority was called Chester City Council.
The City of Chester is a constituency represented in the House of Commons of the UK Parliament since 2 December 2022 by Samantha Dixon of the Labour Party. She was elected in the by-election held following the resignation of Chris Matheson MP on 21 October 2022.
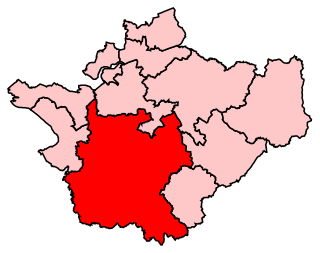
Eddisbury is a constituency in Cheshire represented in the House of Commons of the UK Parliament since 2019 by Edward Timpson, a Conservative.
Ellesmere Port and Neston is a constituency represented in the House of Commons of the UK Parliament since 2015 by Justin Madders of the Labour Party.
Guilden Sutton is a civil parish and village in the unitary authority of Cheshire West and Chester and the ceremonial county of Cheshire, England. The village lies approximately 3 miles (5 km) to the east of Chester and is south of the village of Mickle Trafford. The community consists of a church, a primary school, a post office, a pub, a village hall and several local businesses.
Sir Owen Trevor Jones was a British Liberal Democrat politician and member of the Liverpool City Council.
Chestler-le-Street District Council elections were generally held every four years between the council's creation in 1974 and its abolition in 2009. Chester-le-Street was a non-metropolitan district in County Durham, England. On 1 April 2009 the council's functions passed to Durham County Council, which became a unitary authority.
Cheshire County Council was the county council of Cheshire. Founded on 1 April 1889, it was officially dissolved on 31 March 2009, when it and its districts were superseded by two unitary authorities; Cheshire West and Chester and Cheshire East.
Cheshire West and Chester is a unitary authority area with borough status in Cheshire, England. It was established on 1 April 2009 as part of the 2009 local government changes, by virtue of an order under the Local Government and Public Involvement in Health Act 2007. It superseded the boroughs of Ellesmere Port and Neston, Vale Royal and the City of Chester; its council assumed the functions and responsibilities of the former Cheshire County Council within its area. The remainder of ceremonial Cheshire is composed of Cheshire East, Halton and Warrington. Cheshire West and Chester has three key urban areas: Chester, Ellesmere Port and Northwich/Winsford.
Cheshire West and Chester Council elections are held every four years. Cheshire West and Chester Council is the local authority for the unitary authority of Cheshire West and Chester in Cheshire, England. Since the last boundary changes in 2019, 70 councillors have been elected from 45 wards.
Cheshire West and Chester Council is the local authority for Cheshire West and Chester. It is a unitary authority created on 1 April 2009, succeeding the non-metropolitan districts of Chester City Council, Ellesmere Port and Neston Borough Council, and Vale Royal Borough Council, and the non-metropolitan county of Cheshire County Council. The council was first elected on 1 May 2008, a year before coming into its legal powers on 1 April 2009.
The 2015 Cheshire West and Chester Council election took place on 7 May 2015, electing members of Cheshire West and Chester Council in England. This was on the same day as other local elections across the country as well as the general election.
The 2019 Cheshire West and Chester Council election took place on 2 May 2019 to elect members of Cheshire West and Chester Council in England. This was on the same day as other local elections. Five fewer seats were contested because of boundary changes. No party gained overall control. The Labour Party gained a seat but lost control of the council; the Conservatives lost 8 seats, while the Independents gained 4, the Liberal Democrats gained 2, and the Green Party gained one.
A by-election for the United Kingdom parliamentary constituency of the City of Chester was held on 1 December 2022. It followed the resignation of incumbent member of Parliament Chris Matheson as on 21 October 2022 after accusations of sexual misconduct and a recommendation from the Independent Expert Panel that he be suspended from the House of Commons for four weeks.
Samantha Kate Dixon is a British politician serving as Member of Parliament (MP) for the City of Chester since 2022. A member of the Labour Party, she was Leader of Cheshire West and Chester Council from 2015 to 2019.