2003 Norwich City Council election

Last updated

The 2003 Norwich City Council election took place on 1 May 2003 to elect members of Norwich City Council in England. This was on the same day as other local elections. 16 of 48 seats (one-third) were up for election, with an additional seat up in Henderson ward due to a by-election.

Contents

Result summary

2003 Norwich City Council election [1]
PartyThis electionFull councilThis election
SeatsNetSeats %OtherTotalTotal %VotesVotes %+/−
  Liberal Democrats 10Increase2.svg 458.8203062.513,97839.0-5.1
  Labour 5Decrease2.svg 429.4101531.311,17631.2-2.0
  Green 2Steady2.svg11.8024.15,68915.9+6.5
  Conservative 0Steady2.svg0.0112.04,53912.7+0.1
  Independent 0Steady2.svg0.0000.04881.4+0.9

Ward results

Bowthorpe

Bowthorpe
PartyCandidateVotes%±%
Labour Ronald Borrett 1,102 43.6 -5.1
Liberal Democrats Helen Arundell61724.4-7.1
Conservative Antony Little60323.8+8.8
Green Beth Brockett2088.2+3.3
Majority48519.2+1.9
Turnout 2,53029.1+2.5
Labour hold Swing Increase2.svg1.0

Catton Grove

Catton Grove
PartyCandidateVotes%±%
Labour Bernard Smith 630 38.3 -4.5
Conservative Colin Barker49129.9+1.2
Liberal Democrats Paul Kendrick33720.5-3.0
Green Janet Bearman18611.3+6.3
Majority1398.5-5.6
Turnout 1,64428.9-1.1
Labour hold Swing Decrease2.svg2.9

Coslany

Coslany
PartyCandidateVotes%±%
Labour H. Watson 846 42.9 +0.7
Liberal Democrats Alan Strong43422.0-8.7
Conservative Ernest Horth33116.8-3.1
Green Adrian Holmes23111.7+3.5
Independent David Bethell1316.6N/A
Majority41227.3+15.8
Turnout 1,97335.8+3.3
Labour hold Swing Increase2.svg4.7

Crome

Crome
PartyCandidateVotes%±%
Labour Alan Waters 920 50.7 -0.3
Conservative D. Lovewell42523.4-1.7
Liberal Democrats Roger Smith37520.7-0.9
Green Fiona Dowson945.2+2.9
Majority49527.3+1.5
Turnout 1,81435.8+0.4
Labour hold Swing Increase2.svg0.7

Eaton

Eaton
PartyCandidateVotes%±%
Liberal Democrats Judith Lubbock 2,164 62.9 +0.3
Conservative Ian Mackie78222.7-2.3
Labour J. Bremner3389.8-0.4
Green Neville Bartlett1594.6+2.4
Majority1,38240.1+2.5
Turnout 3,44355.2+1.3
Liberal Democrats hold Swing Increase2.svg1.3

Heigham

Heigham
PartyCandidateVotes%±%
Liberal Democrats M. Verran 860 45.6 -5.2
Labour Carol Morrey64434.1-1.0
Green Rupert Read 38220.3+14.9
Majority21611.5-4.2
Turnout 1,88633.7-2.2
Liberal Democrats hold Swing Decrease2.svg2.1

Henderson

Henderson (2 seats due to by-election)
PartyCandidateVotes%±%
Green Jessica Goldfinch 1,011 47.5 +6.1
Green Adrian Ramsay 991
Labour H. Panting63830.0-0.4
Labour John Sheridan473
Liberal Democrats Phillip Bazley35516.7-5.7
Liberal Democrats Anne Stairs305
Conservative C. Page1245.8±0.0
Conservative F. Leatherdale112
Turnout 35.7-1.3
Green hold
Green hold

Lakenham

Lakenham
PartyCandidateVotes%±%
Liberal Democrats Linda Harper 938 48.2 -0.9
Labour Charles Sanderson65733.7-4.4
Conservative Christine Munroe22411.5+2.3
Green Andrew Knighton1296.6+2.9
Majority28114.4+3.4
Turnout 1,94836.4-0.6
Liberal Democrats gain from Labour Swing Increase2.svg1.8

Mancroft

Mancroft
PartyCandidateVotes%±%
Liberal Democrats Diane Lowe 1,058 40.5 -1.2
Labour P. Harris88233.7-5.6
Conservative Trevor Ivory38814.8+2.4
Green R. House28711.0+4.4
Majority1766.7+4.3
Turnout 2,61538.3+4.6
Liberal Democrats gain from Labour Swing Increase2.svg2.2

Mile Cross

Mile Cross
PartyCandidateVotes%±%
Liberal Democrats Victor Elvin 802 49.5 +2.3
Labour B. Simpson71043.9-4.6
Green Jennifer Parkhouse1046.4+2.2
Majority925.7
Turnout 1,61629.9-2.0
Liberal Democrats gain from Labour Swing Increase2.svg3.5

Mousehold

Mousehold
PartyCandidateVotes%±%
Labour Nicholas Williams 778 41.3 +2.2
Liberal Democrats Graham Hopkins57930.7-8.7
Independent Paul Scruton35718.9+9.4
Green L. Freaney1719.1+5.7
Majority19910.6
Turnout 1,88530.8-1.9
Labour hold Swing Increase2.svg5.5

Nelson

Nelson
PartyCandidateVotes%±%
Liberal Democrats P. McAlenan 1,000 42.7 -9.4
Green Robert Gledhill83535.6+21.2
Labour Stephen Cook34514.7-12.2
Conservative Victor Hopes1647.0+0.3
Majority1657.0-18.2
Turnout 2,34442.4+4.4
Liberal Democrats hold Swing Decrease2.svg15.3

St. Stephen

St. Stephen
PartyCandidateVotes%±%
Liberal Democrats Thomas Wells 1,082 49.1 -2.3
Labour S. Wright53424.2-5.6
Green Stephen Little30213.7+7.5
Conservative Richard Wells28713.0+0.5
Majority54824.9+3.3
Turnout 2,20539.5-2.5
Liberal Democrats gain from Labour Swing Increase2.svg1.7

Thorpe Hamlet

Thorpe Hamlet
PartyCandidateVotes%±%
Liberal Democrats Joyce Divers 1,106 57.3 -3.8
Labour Julie Westmacott38419.9-2.6
Conservative M. Ivory23312.1+3.4
Green R. Farrington20610.7+2.9
Majority72237.4-1.2
Turnout 1,92930.7+3.0
Liberal Democrats hold Swing Decrease2.svg0.6

Town Close

Town Close
PartyCandidateVotes%±%
Liberal Democrats Derek Wood 1,031 47.3 -13.1
Labour Keith Driver70932.5+6.8
Conservative John Wyatt24011.0+1.3
Green Christopher Webb1999.1+4.9
Majority32214.8-19.8
Turnout 2,17941.0+1.8
Liberal Democrats hold Swing Decrease2.svg10.0

University

University
PartyCandidateVotes%±%
Liberal Democrats Ian Williams 935 50.5 -12.2
Labour Roy Blower58631.7+8.0
Green Katharine Willett19410.5+5.0
Conservative Dipesh Palana1357.3-0.8
Majority34918.9-20.1
Turnout 1,85035.0-0.8
Liberal Democrats hold Swing Decrease2.svg10.1

Related Research Articles

<span class="mw-page-title-main">Norwich City Council elections</span> Elections for Norwich City councillors

One third of the Norwich City Council in Norfolk, England is elected each year. Since the last boundary changes in 2019, 39 councillors have been elected from 13 wards.

<span class="mw-page-title-main">Adrian Ramsay</span> Co-Leader of the Green Party of England and Wales

Adrian Philip Ramsay is a British politician and co-leader of the Green Party of England and Wales alongside Carla Denyer since 1 October 2021. He was previously the deputy leader of the Green Party of England and Wales from 2008 to 2012. He served as a Norwich City Councillor from 2003 to 2011.

<span class="mw-page-title-main">2010 United Kingdom local elections</span>

The 2010 United Kingdom local elections were held on Thursday 6 May 2010, concurrently with the 2010 general election. Direct elections were held to all 32 London boroughs, all 36 metropolitan boroughs, 76 second-tier district authorities, 20 unitary authorities and various Mayoral posts, all in England. For those authorities elected "all out" these were the first elections since 2006. The results provided some comfort to the Labour Party, losing the general election on the same day, as it was the first time Conservative councillor numbers declined since 1996.
<span class="mw-page-title-main">2008 Norwich City Council election</span> 2008 city council election for Norwich, England

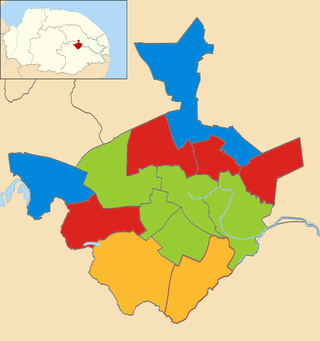
The 2008 Norwich City Council election took place on 1 May 2008 to elect members of Norwich City Council in England. One third of seats were up for election. This was on the same day as other local elections.

<span class="mw-page-title-main">2011 Norwich City Council election</span> 2011 city council election for Norwich, England

The 2011 Norwich City Council election took place on 5 May 2011 to elect members of Norwich City Council in England. One third of seats were up for election. This was on the same day as other local elections and the nationwide referendum on the Alternative Vote.

<span class="mw-page-title-main">2014 Norwich City Council election</span> 2014 city council election for Norwich, England

Council elections for the Norwich City Council were held on 22 May 2014 as part of the 2014 United Kingdom local elections. The elections were moved from earlier on in May to coincide with the East of England 2014 European Parliament election.
<span class="mw-page-title-main">2015 Norwich City Council election</span> 2015 city council election for Norwich, England

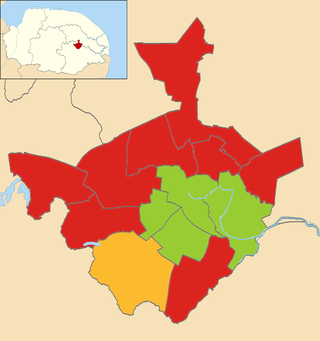
The 2015 Norwich City Council election took place on 7 May 2015 to elect approximately one third of the members of Norwich City Council in England. This was on the same day as other local elections and the UK general election. Thirteen seats were due to be contested, with a further two seats up for election where casual vacancies had arisen. Labour won ten of the available seats, the Green Party won four, and the Liberal Democrats one. The Conservatives gained their highest ever vote in many city wards including Town Close and Thorpe Hamlet, and across Norwich came within almost 2000 votes of the Green Party, however failed to gain any seats. Just one seat changed hands - Wensum - which Labour gained from the Greens. Labour retained overall control of the council with 22 seats out of 39, the Greens continue to form the main opposition with 14 seats, and the Liberal Democrats have 3.

<span class="mw-page-title-main">2016 Norwich City Council election</span> 2016 city council election for Norwich, England

The 2016 Norwich City Council election took place on 5 May 2016 to elect members of Norwich City Council in England. This was on the same day as other local elections. The Labour Party increased their majority at the expense of the Green Party, capturing 4 previously Green-held seats; the Greens retained only Thorpe Hamlet ward, by a margin of 31 votes.

<span class="mw-page-title-main">2018 Norwich City Council election</span> 2018 city council election for Norwich, England

The 2018 Norwich City Council election took on 3 May 2018 to elect members of Norwich City Council in England. This was on the same day as other local elections. 13 of 39 seats (one-third) were up for election.
<span class="mw-page-title-main">2019 Norwich City Council election</span> Elections in Norwhich

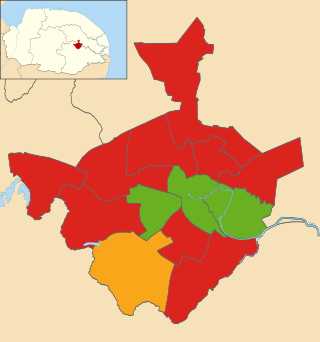
Elections to Norwich City Council were held on 2 May 2019. Following boundary changes, all 39 seats were put up for election, with three councillors being elected per ward using the block vote system. The election saw the Green Party reclaim five seats from the Labour Party, while losing one to Labour in Town Close. The Labour Party retained its majority on the council.
<span class="mw-page-title-main">2004 Norwich City Council election</span> 2004 city council election for Norwich, England

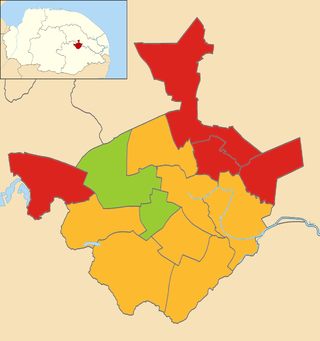
The 2004 Norwich City Council election took place on 10 June 2004 to elect members of Norwich City Council in England. This was on the same day as other local elections. This was the first election to be held under new ward boundaries, which reduced the number of seats from 48 to 39. As a result, all seats were up for election. The Liberal Democrats lost overall control of the council, which fell under no overall control.

<span class="mw-page-title-main">2021 Norwich City Council election</span> 2021 UK local government election

The 2021 Norwich City Council election took place on 6 May 2021 to elect members of Norwich City Council in England. This was on the same day as other local elections. 13 of 39 seats (one-third) were up for election.

The 1991 Norwich City Council election took place on 2 May 1991 to elect members of Norwich City Council in England. This was on the same day as other local elections. 16 of 48 seats (one-third) were up for election, with one additional seat up due to a by-election in Catton Grove ward.

'The 1992 Norwich City Council election' took place on 7 May 1992 to elect members of Norwich City Council in England. This was on the same day as other local elections. 16 of 48 seats (one-third) were up for election, with one additional seat up due to the UK parliamentary by-elections in Henderson ward.

The 1994 Norwich City Council election took place on 5 May 1994 to elect members of Norwich City Council in England. This was on the same day as other local elections. 16 of 48 seats (one-third) were up for election, with one additional seat up due to a by-election in Lakenham ward.

The 1996 Norwich City Council election took place on 2 May 1996 to elect members of Norwich City Council in England. This was on the same day as other local elections. 16 of 48 seats (one-third) were up for election, with three additional seats up due to by-elections in Coslany, St. Stephen and Thorpe Hamlet wards.

The 1998 Norwich City Council election took place on 7 May 1998 to elect members of Norwich City Council in England. This was on the same day as other local elections. 16 of 48 seats (one-third) were up for election, with two additional seats up in Catton Grove and University wards due to by-elections.

The 1999 Norwich City Council election took place on 6 May 1999 to elect members of Norwich City Council in England. This was on the same day as other local elections. 16 of 48 seats (one-third) were up for election, with an additional seat up in Coslany ward due to a by-election.

The 2002 Norwich City Council election took place on 2 May 2002 to elect members of Norwich City Council in England. This was on the same day as other local elections. 16 of 48 seats (one-third) were up for election, with an additional seat up in Henderson ward due to a by-election.

<span class="mw-page-title-main">2022 Norwich City Council election</span> 2022 UK local government election

The 2022 Norwich City Council election took place on 5 May 2022 to elect members of Norwich City Council in England. This was on the same day as other local elections. 13 of 39 seats (one-third) were up for election.

References

  1. "Norwich City Council Election Results 1973-2012" (PDF). Colin Rallings and Michael Thrasher. Retrieved 17 July 2021.