| |||||||||||||||||||||||||||||||||||||
13 of 39 seats (One Third) to Norwich City Council 20 seats needed for a majority | |||||||||||||||||||||||||||||||||||||
---|---|---|---|---|---|---|---|---|---|---|---|---|---|---|---|---|---|---|---|---|---|---|---|---|---|---|---|---|---|---|---|---|---|---|---|---|---|
| |||||||||||||||||||||||||||||||||||||
Map showing the 2016 local election results in Norwich. †As only one-third of seats were up for election, this figure indicates the total number of seats held by the party following the election to allow for year-on-year comparison. | |||||||||||||||||||||||||||||||||||||
|
The 2018 Norwich City Council election took on 3 May 2018 to elect members of Norwich City Council in England. This was on the same day as other local elections. 13 of 39 seats (one-third) were up for election.
The Labour Party retained overall control of the council, winning 12 out of 13 seats up for election and 49% of the vote, their best result in over 20 years. The Greens lost every seat they were defending, whilst the Liberal Democrats retained their single seat in Eaton ward. [1] The Conservatives once again failed to elect any councillors, although they did increase their share of the vote by 3 percentage points. As of the 2018 election, the Conservatives have not won a seat on Norwich City Council for over 10 years.
All changes in vote share are calculated with reference to the 2014 election, the last time these seats were contested.
In the 2016 election, the Labour Party achieved its best result in the city since 1998, winning 44% of the vote and 11 of 13 seats up for election, with the Greens dropping to their worst percentage result since 2005 (21%) and losing 4 of the 5 seats they were defending. The scale of the Labour victory was reported to have surprised both Labour and the Green Party and was partly attributed to Jeremy Corbyn's leadership of the Labour Party bringing "some voters who had previously switched to the Greens back to Labour". [2]
The following year, in the Norfolk County Council election, Labour bucked its national trend of poor results and gained 4 seats in Norwich, all from the Green Party, leaving the Greens with no representation on the County Council for the first time since 2001. This was followed by a general election on 8 June, which saw Labour win Norwich South with 61% of the vote, with the Green Party candidate achieving a total of 3%. Labour also came within 507 votes of winning Norwich North from the Conservative Party.
Party | Seats | Gains | Losses | Net gain/loss | Seats % | Votes % | Votes | +/− | |
---|---|---|---|---|---|---|---|---|---|
Labour | 12 | 5 | 0 | +5 | 92.3 | 49.2 | 17,094 | +13.8 | |
Conservative | 0 | 0 | 0 | 0 | 19.7 | 6,841 | +3.2 | ||
Green | 0 | 0 | 5 | -5 | 19.4 | 6,735 | -10.9 | ||
Liberal Democrats | 1 | 0 | 0 | 0 | 7.7 | 11.5 | 3,987 | +1.5 | |
Independent | 0 | 0 | 0 | 0 | 0.3 | 116 | New | ||
Total | 13 | 34,773 |
Changes in vote share are relative to the last time these seats were contested in 2014.
Prior to the election the composition of the council was:
26 | 10 | 3 |
Labour | Green | Lib Dem |
After the election the composition of the council was:
31 | 5 | 3 |
Labour | Green | Lib Dem |
Party | Candidate | Votes | % | ±% | |
---|---|---|---|---|---|
Labour | Sue Sands | 1,297 | 59.5 | +11.6 | |
Conservative | Andrew Roy Wiltshire | 579 | 26.6 | +2.4 | |
Green | Jean Kathleen Bishop | 173 | 7.9 | -14.4 | |
Liberal Democrats | Oliver Brian James Healey | 131 | 6.0 | +0.4 | |
Majority | 718 | 32.9 | |||
Turnout | 2,180 | 24.8 | |||
Labour hold | Swing | ||||
Party | Candidate | Votes | % | ±% | |
---|---|---|---|---|---|
Labour | Mike Stonard | 1,220 | 51.3 | +13.7 | |
Conservative | Henry Charles Newton | 809 | 34.0 | +12.3 | |
Green | Tony Arthur Park | 196 | 8.2 | -4.2 | |
Liberal Democrats | Leigh John Tooke | 153 | 6.4 | +1.3 | |
Majority | 411 | 17.3 | |||
Turnout | 2,378 | ||||
Labour hold | Swing | ||||
Party | Candidate | Votes | % | ±% | |
---|---|---|---|---|---|
Labour | Marion Frances Maxwell | 1,219 | 58.0 | +16.4 | |
Conservative | Tom L. Sherman | 592 | 28.2 | +12.0 | |
Green | Judith Marianne Ford | 178 | 8.5 | -1.5 | |
Liberal Democrats | Samuel Neal | 111 | 5.3 | +2.0 | |
Majority | 627 | 29.8 | |||
Turnout | 2,100 | ||||
Labour hold | Swing | ||||
Party | Candidate | Votes | % | ±% | |
---|---|---|---|---|---|
Liberal Democrats | James Wright | 1,799 | 49.6 | +12.8 | |
Conservative | Samantha Louise England | 888 | 24.5 | -5.4 | |
Labour | Ben Hardie | 689 | 19.0 | +0.9 | |
Green | Jane Isobel Saunders | 249 | 6.9 | -8.3 | |
Majority | 911 | 25.1 | |||
Turnout | 3,625 | ||||
Liberal Democrats hold | Swing | ||||
Party | Candidate | Votes | % | ±% | |
---|---|---|---|---|---|
Labour | Rachel Sarah Trevor | 1,353 | 57.0 | +22.3 | |
Conservative | Eric Philip Ashwell Masters | 475 | 20.0 | +11.6 | |
Liberal Democrats | Emily Rachel Cutler | 307 | 12.9 | -7.9 | |
Green | Frederick Peter John Offord | 238 | 10.0 | -4.8 | |
Majority | 878 | 25.0 | |||
Turnout | 2373 | ||||
Labour hold | Swing | ||||
Party | Candidate | Votes | % | ±% | |
---|---|---|---|---|---|
Labour | Jo Smith | 1,248 | 42.6 | +9.7 | |
Green | Sandra Bogelein | 1,171 | 40.0 | -5.4 | |
Conservative | Iain Michael Morgan Gwynn | 373 | 12.7 | -1.6 | |
Liberal Democrats | Sarah Tustin | 139 | 4.7 | -2.7 | |
Majority | 77 | 2.6 | |||
Turnout | 2,931 | ||||
Labour gain from Green | Swing | ||||
Party | Candidate | Votes | % | ±% | |
---|---|---|---|---|---|
Labour | Jacob Stephen Orlando Huntley | 1,124 | 57.8 | +17.4 | |
Conservative | John Frederick Fisher | 393 | 20.2 | +8.2 | |
Green | Adrian St.John Holmes | 188 | 9.7 | -10.0 | |
Liberal Democrats | Adrian Christopher Thomas | 125 | 6.4 | +1.8 | |
Independent | Richard Alan Edwards | 116 | 6.0 | New | |
Majority | 731 | 37.6 | |||
Turnout | 1,946 | ||||
Labour hold | Swing | ||||
Party | Candidate | Votes | % | ±% | |
---|---|---|---|---|---|
Labour | Emma Louise Hampton | 1,643 | 47.2 | +15.7 | |
Green | Paul Vincent Neale | 1,459 | 42.0 | -11.0 | |
Conservative | Reece Stanley Durrant | 189 | 5.4 | -2.2 | |
Liberal Democrats | David Angus Fairbairn | 185 | 5.3 | -2.7 | |
Majority | 184 | 5.2 | |||
Turnout | 3,476 | ||||
Labour gain from Green | Swing | ||||
Party | Candidate | Votes | % | ±% | |
---|---|---|---|---|---|
Labour | Matthew Robert Packer | 1,652 | 64.5 | +27.5 | |
Conservative | Tessa Ann Jackson | 431 | 16.8 | +3.9 | |
Green | Cami Ouzerdine | 325 | 12.7 | -14.1 | |
Liberal Democrats | Neil Rober Hardman | 155 | 6.0 | +1.4 | |
Majority | 1,221 | 47.7 | |||
Turnout | 2563 | ||||
Labour hold | Swing | ||||
Party | Candidate | Votes | % | ±% | |
---|---|---|---|---|---|
Labour | Cavan Stewart | 1,277 | 39.7 | +10.1 | |
Green | Lesley Grahame | 1,122 | 34.9 | -7.3 | |
Conservative | Alex Jackson-Dennis | 587 | 18.3 | -1.5 | |
Liberal Democrats | Gordon Dean | 229 | 7.1 | -1.3 | |
Majority | 155 | 4.8 | |||
Turnout | 3,215 | ||||
Labour gain from Green | Swing | ||||
Party | Candidate | Votes | % | ±% | |
---|---|---|---|---|---|
Labour | Ian Clifford Stutely | 1,776 | 48.9 | +15.5 | |
Conservative | Mary Josephine Chacksfield | 841 | 23.0 | +4.5 | |
Green | Nick Caistor | 659 | 18.1 | -24.0 | |
Liberal Democrats | Silvia Schmidtova | 373 | 10.2 | +4.0 | |
Majority | 935 | 25.9 | |||
Turnout | |||||
Labour gain from Green | Swing | ||||
Party | Candidate | Votes | % | ±% | |
---|---|---|---|---|---|
Labour | Matthew Fulton-McAlister | 1,156 | 63.2 | +11.4 | |
Green | Claire Louise Stephenson | 296 | 16.2 | -13.2 | |
Conservative | Ahmod Syed Zulkarnine | 252 | 13.8 | +1.7 | |
Liberal Democrats | Connor Bell | 125 | 6.8 | +0.1 | |
Majority | 860 | 47.0 | |||
Turnout | |||||
Labour hold | Swing | ||||
Party | Candidate | Votes | % | ±% | |
---|---|---|---|---|---|
Labour | Erin Victoria Fulton-McAlister | 1,440 | 58.6 | +23.0 | |
Green | Thomas Edward Holloway | 481 | 19.5 | -28.2 | |
Conservative | Thomas Simon Sheppard | 432 | 17.5 | +4.9 | |
Liberal Democrats | David Thomas | 113 | 4.6 | +0.4 | |
Majority | 959 | 39.1 | |||
Turnout | |||||
Labour gain from Green | Swing | ||||
The Green Party of England and Wales has its roots in the PEOPLE Party started in Coventry in 1972/3 by four professional friends. It then changed its name to the more descriptive Ecology Party in 1975, and to the Green Party ten years later. In the 1990s, the Scottish and Northern Ireland wings of the Green Party in the United Kingdom decided to separate amicably from the party in England and Wales, to form the Scottish Green Party and the Green Party in Northern Ireland. The Wales Green Party became an autonomous regional party and remained within the new Green Party of England and Wales.
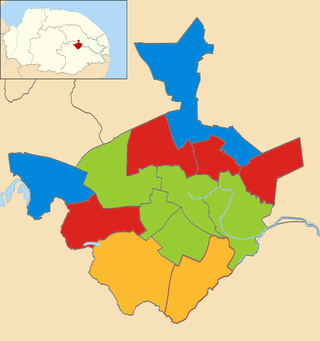
The 2008 Norwich City Council election took place on 1 May 2008 to elect members of Norwich City Council in England. One third of seats were up for election. This was on the same day as other local elections.
The 2008 Stroud Council election took place on 1 May 2008 to elect members of Stroud District Council in Gloucestershire, England. One third of the council was up for election and the Conservative Party stayed in overall control of the council.
The 2008 Sandwell Metropolitan Borough Council election took place on 1 May 2008 to elect members of Sandwell Metropolitan Borough Council in the West Midlands, England. One third of the council was up for election and the Labour Party stayed in overall control of the council.
The 2011 Norwich City Council election took place on 5 May 2011 to elect members of Norwich City Council in England. One third of seats were up for election. This was on the same day as other local elections and the nationwide referendum on the Alternative Vote.
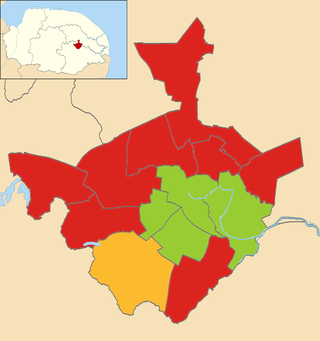
The 2015 Norwich City Council election took place on 7 May 2015 to elect approximately one third of the members of Norwich City Council in England. This was on the same day as other local elections and the UK general election. Thirteen seats were due to be contested, with a further two seats up for election where casual vacancies had arisen. Labour won ten of the available seats, the Green Party won four, and the Liberal Democrats one. The Conservatives gained their highest ever vote in many city wards including Town Close and Thorpe Hamlet, and across Norwich came within almost 2000 votes of the Green Party, however failed to gain any seats. Just one seat changed hands - Wensum - which Labour gained from the Greens. Labour retained overall control of the council with 22 seats out of 39, the Greens continue to form the main opposition with 14 seats, and the Liberal Democrats have 3.
The 2016 Norwich City Council election took place on 5 May 2016 to elect members of Norwich City Council in England. This was on the same day as other local elections. The Labour Party increased their majority at the expense of the Green Party, capturing 4 previously Green-held seats; the Greens retained only Thorpe Hamlet ward, by a margin of 31 votes.
The 2018 Lambeth London Borough Council election took place on 3 May 2018 alongside other local elections in London, to elect members of Lambeth London Borough Council in England. The election saw Labour remain in control of Lambeth Council with a slightly reduced majority, winning over 90% of the seats. The Green Party achieved its best-ever result in the borough, winning five seats and becoming the official opposition and the largest Green group in London.
The 2018 Hammersmith and Fulham Council election took place on 3 May 2018 to elect members of Hammersmith and Fulham Council in London.
The 2018 Barking and Dagenham Council election took place on 3 May 2018 to elect members of Barking and Dagenham Council in London. This was on the same day as other local elections. The Labour Party won every available council seat for the third election in a row, winning 74% of the popular vote. The Conservatives saw their vote share rise by 13 percentage points, but failed to win any seats.
Elections to Cannock Chase District Council took place on 3 May 2018 on the same day as other local elections in England. A third of the council was up for election, meaning a total of 13 councillors were elected from all but two of the council's wards.
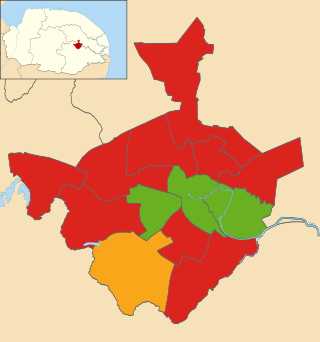
Elections to Norwich City Council were held on 2 May 2019. Following boundary changes, all 39 seats were put up for election, with three councillors being elected per ward using the block vote system. The election saw the Green Party reclaim five seats from the Labour Party, while losing one to Labour in Town Close. The Labour Party retained its majority on the council.
Elections to Cannock Chase District Council took place on 2 May 2019 on the same day as other local elections in England, including to several parish councils in the district. All of the council's wards were up for election, meaning a total of 15 councillors were elected.
Elections to Portsmouth City Council took place on Thursday 2 May 2019, alongside other local elections across the country. The seats contested in this election were last contested in 2015. The Conservative Party had 8 seats they were defending, the Liberal Democrats 5 and Labour 1 seat. A by-election occurred within the vacant Cosham seat from last years election, due to the sitting Conservative standing down. No party gained a majority from this election, and therefore the council remains under no overall control.
The 2019 Sunderland City Council election took place on 2 May 2019 to elect members of Sunderland City Council in England. The election took place on the same day as other local elections.
Elections to Cannock Chase District Council took place on 6 May 2021 on the same day as the Staffordshire County council election and other local elections in England. These elections were due to take place on 7 May 2020 but were delayed by 12 months due to the coronavirus pandemic. All but two of the council's wards were up for election, meaning a total of 13 councillors were elected.
The 2022 Calderdale Metropolitan Borough Council election took place on 5 May 2022 to elect members of Calderdale Metropolitan Borough Council in England. One third of councillors — 17 out of 51, plus one vacancy in Ovenden ward were up for election. The election took place alongside other local elections across the United Kingdom.
Elections to the City of Edinburgh Council took place on 5 May 2022 on the same day as the 31 other Scottish local government elections. As with other Scottish council elections, it was held using single transferable vote (STV) – a form of proportional representation – in which multiple candidates are elected in each ward and voters rank candidates in order of preference.
Elections to Cannock Chase District Council took place on 5 May 2022 on the same day as other local elections in England, Scotland and Wales. All but two of the council's wards were up for election, meaning a total of 13 councillors were elected.
Elections to Cannock Chase District Council took place on 4 May 2023 on the same day as other local elections in England, including to eight parish councils in the district. All of the council's wards were up for election, and there were two vacancies to be filled, meaning a total of 17 councillors were elected.