
Cherwell is a local government district in northern Oxfordshire, England. The district was created in 1974 and takes its name from the River Cherwell, which drains south through the region to flow into the River Thames at Oxford. Towns in Cherwell include Banbury and Bicester. Kidlington is a contender for largest village in England.

South Holland is a local government district of Lincolnshire, England. The council is based in Spalding. Other notable towns and villages include Crowland, Sutton Bridge, Donington, Holbeach and Long Sutton. The district is named after the historical division of Lincolnshire known as the Parts of Holland.

South Norfolk is a local government district in Norfolk, England. The largest town is Wymondham, and the district also includes the towns of Costessey, Diss, Harleston, Hingham, Loddon and Long Stratton. The council was based in Long Stratton until 2023 when it moved to the Broadland Business Park near Norwich, in the neighbouring Broadland district, as part of a shared facility with Broadland District Council. Some of the district's urban areas form part of the Norwich built-up area. The district also includes numerous villages and surrounding rural areas. Some eastern parts of the district lie within The Broads.

South Oxfordshire is a local government district in the ceremonial county of Oxfordshire, England. Its council is temporarily based outside the district at Abingdon-on-Thames pending a planned move to Didcot, the district's largest town. The areas located south of the River Thames are within the historic county of Berkshire.

South West Norfolk is a constituency represented in the House of Commons of the UK Parliament since 2024 by Terry Jermy of the Labour Party. It was represented by Liz Truss between 2010 and 2024, who served as Prime Minister for 49 days in 2022.
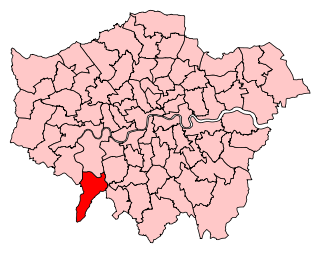
Kingston and Surbiton is a constituency in Greater London created in 1997 and represented in the House of Commons of the UK Parliament since 2017 by Ed Davey, the Leader of the Liberal Democrats. Davey previously held the seat from 1997 until losing reelection in 2015 to Conservative James Berry.

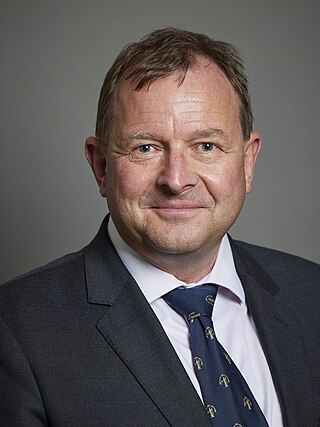
Broadland and Fakenham is a Norfolk constituency, which has been represented in the House of Commons of the UK Parliament since the 2019 general election by Jerome Mayhew, a Conservative.
The 2001 United Kingdom local elections took place on Thursday 7 June 2001. Elections took place for all of the English shire counties, some English unitary authorities and all of the Northern Ireland districts. The elections were delayed from the usual date of the first Thursday in May due to the 2001 foot and mouth crisis and were held on the same day as the 2001 general election.
The 1999 Craven District Council election took place on 6 May 1999 to elect members of Craven District Council in North Yorkshire, England. One third of the council was up for election and the Conservative Party gained overall control of the council from no overall control.

Norfolk County Council is the upper-tier local authority for Norfolk, England. Below it there are seven second-tier district councils: Breckland, Broadland, Great Yarmouth, North Norfolk, Norwich, King's Lynn and West Norfolk, and South Norfolk.
Thanet District Council elections are held every four years to elect Thanet District Council in Kent, England. Since the last boundary changes in 2003 the council has comprised 56 councillors representing 23 wards.

The Norfolk County Council election took place across Norfolk on 2 May 2013, coinciding with local elections for all county councils in England. The results were announced the following day, Friday 3 May 2013. The result brought to an end 12 years of Conservative administration, who finished three seats short of a majority after losing 20 seats, leaving the Council in no overall control (NOC). UKIP and the Labour Party both made gains of 14 and 11 seats respectively. The Liberal Democrats and the Green Party both lost three seats each, whilst an independent won a single seat in North Norfolk.

Torbay Council is the local authority for Torbay, a unitary authority with borough status in the ceremonial county of Devon, England. The council is based in Torquay.
The 1987 Cardiff City Council election was held on Thursday 7 May 1987 to the district council known as Cardiff City Council, in Cardiff, South Glamorgan, Wales. It took place on the same day as other district council elections in Wales and England. The Conservative Party lost control of the council, though the Labour Party were unable to regain an overall majority.

The 2021 Norfolk County Council election took place alongside the other 2021 local elections. 83 of the 84 seats to Norfolk County Council were elected. One seat, Sewell in Norwich, had its election delayed to June 17 after Eve Collishaw, the Conservative candidate, died during the election campaign

The 2023 United Kingdom local elections were held on Thursday, 4 May 2023 in England and on Thursday 18 May 2023 in Northern Ireland. These included district councils, unitary authorities, and directly elected mayors in England, and included all local councils in Northern Ireland. Notably, these elections were the first to be held under the Elections Act 2022, a new voter identification law that required voters to show photo ID when attending a polling station, and was a cause for controversy.

The 2023 Broadland District Council election took place on 4 May 2023 to elect members of Broadland District Council in Norfolk, England. This was on the same day as other local elections.

The 2023 North Norfolk District Council election took place on 4 May 2023 to elect members of North Norfolk District Council in Norfolk, England. This was on the same day as other local elections across England.

The 2023 South Derbyshire District Council election took place on 4 May 2023, to elect all 36 members of South Derbyshire District Council in Derbyshire, England. This was on the same day as other local elections across England. Labour took a majority of the seats on the council, which had previously been under no overall control.
John Charles Fuller, Baron Fuller, is a British Conservative Party politician. He was Leader of South Norfolk District Council between May 2007 and May 2024. He was appointed a member of the House of Lords in February 2024.
