| |||||||||||||||||||||||||||||||||||||||||||||||||||||||||||||||||||||||||||
| |||||||||||||||||||||||||||||||||||||||||||||||||||||||||||||||||||||||||||
28 of 84 seats on Sheffield City Council 43 seats needed for a majority | |||||||||||||||||||||||||||||||||||||||||||||||||||||||||||||||||||||||||||
---|---|---|---|---|---|---|---|---|---|---|---|---|---|---|---|---|---|---|---|---|---|---|---|---|---|---|---|---|---|---|---|---|---|---|---|---|---|---|---|---|---|---|---|---|---|---|---|---|---|---|---|---|---|---|---|---|---|---|---|---|---|---|---|---|---|---|---|---|---|---|---|---|---|---|---|
| |||||||||||||||||||||||||||||||||||||||||||||||||||||||||||||||||||||||||||
Winner of each seat at the 2023 Sheffield City Council election | |||||||||||||||||||||||||||||||||||||||||||||||||||||||||||||||||||||||||||
|
The 2023 Sheffield City Council election took place on 4 May 2023 to elect members of Sheffield City Council in England. There were 29 of the 84 seats on the council up for election, being the usual third of the seats plus a by-election in Manor Castle ward. The election took place at the same time as other local elections across England.
The council was under no overall control prior to the election, with Labour councillor Terry Fox serving as leader of the council. The council remained under no overall control after the election and Terry Fox resigned as leader on 5 May 2023. Labour councillor Tom Hunt was appointed leader of the council at the subsequent annual council meeting. [2]
The council elects its councillors in thirds, with a third being up for election every year for three years, with no election in the fourth year. Councillors are elected via first-past-the-post voting, with each ward represented by three councillors, with one elected in each election year to serve a four-year term. [3]
All registered electors (British, Irish, Commonwealth and European Union citizens) living in Sheffield aged 18 or over are entitled to vote in the election. People who live at two addresses in different councils, such as university students with different term-time and holiday addresses, are entitled to be registered for and vote in elections in both local authorities. Voting in person at polling stations took place from 07:00 to 22:00 on election day, and voters were able to apply for postal votes or proxy votes in advance of the election. [4]
Party | Seats | Gains | Losses | Net gain/loss | Seats % | Votes % | Votes | +/− | |
---|---|---|---|---|---|---|---|---|---|
Labour | 14 | 1 | 1 | 48.3 | 39.6 | 49,606 | -1.0 | ||
Liberal Democrats | 11 | 0 | 0 | 37.9 | 26.2 | 32,764 | +4.4 | ||
Green | 4 | 1 | 1 | 13.8 | 19.4 | 24,339 | -1.8 | ||
Conservative | 0 | 0 | 0 | 0.0 | 10.8 | 13,539 | -2.3 | ||
TUSC | 0 | 0 | 0 | 0.0 | 2.3 | 2,852 | +1.3 | ||
Reform UK | 0 | 0 | 0 | 0.0 | 0.8 | 996 | +0.5 | ||
Yorkshire | 0 | 0 | 0 | 0.0 | 0.4 | 479 | -0.5 | ||
Independent | 0 | 0 | 0 | 0.0 | 0.3 | 325 | -0.1 | ||
SDP | 0 | 0 | 0 | 0.0 | 0.1 | 183 | -0.1 | ||
Communist | 0 | 0 | 0 | 0.0 | 0.1 | 66 | ±0.0 | ||
A Labour seat in Manor Castle ward had become vacant after the death of Anne Murphy.
Party | Previous council | New council [5] | +/- | |
---|---|---|---|---|
Labour | 38 | 39 | 1 | |
Liberal Democrats | 29 | 29 | - | |
Green | 14 | 14 | - | |
Conservative | 1 | 1 | - | |
Independent | 1 | 1 | - | |
Vacant | 1 | 0 | 1 | |
Total | 84 | 84 | ||
Working majority | 0 | 0 |
Asterisks (*) denote incumbent councillors seeking re-election. [6] [7]
Party | Candidate | Votes | % | ±% | |
---|---|---|---|---|---|
Liberal Democrats | Richard Shaw* | 2,207 | 46.0 | +5.9 | |
Labour Co-op | Mary Bishop | 1,505 | 31.4 | -5.0 | |
Green | Gill Black | 454 | 9.5 | -2.1 | |
Conservative | Scott Darby | 379 | 7.9 | -4.0 | |
Reform UK | Pete Reilly | 180 | 3.8 | N/A | |
TUSC | Leah Byatt | 68 | 1.4 | N/A | |
Majority | 702 | ||||
Turnout | 4,793 | 34.81 | -0.64 | ||
Liberal Democrats hold | Swing | ||||
Party | Candidate | Votes | % | ±% | |
---|---|---|---|---|---|
Liberal Democrats | Ian Horner | 1,879 | 49.4 | +10.2 | |
Labour | Michael Chilton | 1,298 | 34.1 | -3.0 | |
Conservative | Salieu Favour Bah | 367 | 9.6 | -6.6 | |
Green | Stewart Kemp | 162 | 4.3 | -3.1 | |
TUSC | Mark Dixey | 99 | 2.6 | N/A | |
Majority | 581 | ||||
Turnout | 3,805 | 28.94 | -1.55 | ||
Liberal Democrats hold | Swing | ||||
Party | Candidate | Votes | % | ±% | |
---|---|---|---|---|---|
Labour | Denise Fox* | 1,594 | 52.7 | -3.7 | |
Conservative | Steven Winstone | 573 | 18.9 | -0.2 | |
Green | Alan Yearsley | 344 | 11.4 | +2.0 | |
Liberal Democrats | James Ellwood | 277 | 9.2 | +3.8 | |
Independent | Anne Barr | 189 | 6.2 | N/A | |
TUSC | Simon Moulton | 49 | 1.6 | N/A | |
Majority | 1,021 | ||||
Turnout | 3,026 | 24.30 | -0.95 | ||
Labour hold | Swing | ||||
Party | Candidate | Votes | % | ±% | |
---|---|---|---|---|---|
Green | Angela Argenzio* | 2,601 | 51.7 | +4.8 | |
Labour Co-op | Lewis Dagnall | 1,705 | 33.9 | -6.0 | |
Liberal Democrats | Patrick Gilbert | 326 | 6.5 | +1.3 | |
Conservative | Gordon Millward | 257 | 5.1 | ±0.0 | |
TUSC | Noah Eden | 139 | 2.8 | -0.1 | |
Majority | 896 | ||||
Turnout | 5,028 | 31.57 | -1.33 | ||
Green hold | Swing | ||||
Party | Candidate | Votes | % | ±% | |
---|---|---|---|---|---|
Labour | Talib Hussain* | 2,299 | 67.0 | -4.0 | |
Green | Mustafa Ahmed | 437 | 12.7 | -3.7 | |
Liberal Democrats | Jordan Barry | 314 | 9.1 | +3.7 | |
Conservative | Oluwaseun Ajao | 234 | 6.8 | -0.4 | |
TUSC | Simon Jenkins | 79 | 2.3 | N/A | |
Reform UK | Khalil Al-Asad | 70 | 2.0 | N/A | |
Majority | 1,862 | ||||
Turnout | 3,433 | 23.66 | -3.32 | ||
Labour hold | Swing | ||||
Party | Candidate | Votes | % | ±% | |
---|---|---|---|---|---|
Green | Ruth Mersereau* | 1,119 | 53.4 | -2.0 | |
Labour | Gareth Slater | 626 | 29.9 | -1.7 | |
Liberal Democrats | Julia Wright | 110 | 5.3 | +1.3 | |
Conservative | Matthew Chapman | 102 | 4.9 | -0.3 | |
TUSC | Alexander Helie | 93 | 4.4 | N/A | |
Yorkshire | Gareth Shanks | 45 | 2.1 | N/A | |
Majority | 493 | ||||
Turnout | 2,095 | 15.96 | -0.19 | ||
Green hold | Swing | ||||
Party | Candidate | Votes | % | ±% | |
---|---|---|---|---|---|
Liberal Democrats | Tim Huggan* | 2,734 | 41.2 | +6.7 | |
Labour Co-op | John Wright | 2,547 | 38.4 | +0.9 | |
Green | Oscar Idle | 908 | 13.7 | -4.2 | |
Conservative | Roger Barnsley | 333 | 5.0 | -2.0 | |
TUSC | Joseph Hibbert | 113 | 1.7 | +0.6 | |
Majority | 187 | ||||
Turnout | 6,635 | 45.57 | +0.81 | ||
Liberal Democrats hold | Swing | ||||
Party | Candidate | Votes | % | ±% | |
---|---|---|---|---|---|
Labour | Mary Lea* | 2,188 | 68.1 | +1.8 | |
Liberal Democrats | Adil Mohammed | 441 | 13.7 | +1.6 | |
Conservative | Theresa Morrison | 315 | 9.8 | -1.9 | |
Green | Eamonn Ward | 173 | 5.4 | -0.6 | |
TUSC | Diane Spencer | 94 | 2.9 | -1.0 | |
Majority | 1,747 | ||||
Turnout | 3,211 | 23.94 | -2.68 | ||
Labour hold | Swing | ||||
Party | Candidate | Votes | % | ±% | |
---|---|---|---|---|---|
Liberal Democrats | Joe Otten* | 3,744 | 56.1 | +5.7 | |
Labour | Dominic Ridler | 1,159 | 17.4 | +0.8 | |
Conservative | Joanne Lowe | 963 | 14.4 | -5.3 | |
Green | Bex Whyman | 759 | 11.4 | -1.9 | |
TUSC | Bridget Gilbert | 53 | 0.8 | N/A | |
Majority | 2,585 | ||||
Turnout | 6,678 | 45.62 | +0.63 | ||
Liberal Democrats hold | Swing | ||||
Party | Candidate | Votes | % | ±% | |
---|---|---|---|---|---|
Liberal Democrats | Rob Reiss | 1,741 | 41.1 | +7.1 | |
Labour Co-op | Bridget Kelly | 1,633 | 38.5 | -3.6 | |
Conservative | Oliver O'Brien | 500 | 11.8 | -7.0 | |
Green | Rosie Trevillion | 263 | 6.2 | +1.1 | |
TUSC | Harry Lomas | 102 | 2.4 | N/A | |
Majority | 108 | ||||
Turnout | 4,239 | 30.88 | -1.53 | ||
Liberal Democrats hold | Swing | ||||
Party | Candidate | Votes | % | ±% | |
---|---|---|---|---|---|
Liberal Democrats | Barbara Masters* | 3,400 | 40.7 | +7.8 | |
Green | Peter Gilbert | 2,680 | 32.1 | +3.8 | |
Labour | Lisa Markham | 1,676 | 20.1 | -7.8 | |
Conservative | Elizabeth Finney | 502 | 6.0 | -3.3 | |
TUSC | Jemima Johnson | 101 | 1.2 | N/A | |
Majority | 720 | ||||
Turnout | 8,359 | 53.08 | +2.04 | ||
Liberal Democrats hold | Swing | ||||
Party | Candidate | Votes | % | ±% | |
---|---|---|---|---|---|
Labour | Abdul Khayum* | 1,571 | 56.2 | +2.0 | |
Green | Joydu Al-Mahfuz | 439 | 15.7 | +9.3 | |
Conservative | Sara Chinchen | 320 | 11.4 | -3.3 | |
Liberal Democrats | Shelley Cockayne | 199 | 7.1 | -7.1 | |
SDP | April Worrall | 183 | 6.5 | -0.9 | |
TUSC | Joanna Hall | 84 | 3.0 | ±0.0 | |
Majority | 1,032 | ||||
Turnout | 2,796 | 19.70 | -2.14 | ||
Labour hold | Swing | ||||
Party | Candidate | Votes | % | ±% | |
---|---|---|---|---|---|
Liberal Democrats | Andrew Sangar* | 3,427 | 52.2 | +10.5 | |
Labour | Matthew Killeya | 1,810 | 27.6 | -2.7 | |
Green | Dylan Lewis-Creser | 752 | 11.5 | -5.7 | |
Conservative | Christine Saunders | 500 | 7.6 | -3.1 | |
TUSC | John Bunn | 78 | 1.2 | N/A | |
Majority | 1,617 | 24.6 | |||
Turnout | 6,567 | 46.29 | +0.19 | ||
Liberal Democrats hold | Swing | ||||
Party | Candidate | Votes | % | ±% | |
---|---|---|---|---|---|
Green | Paul Turpin* | 2,094 | 45.5 | -1.9 | |
Labour | Mia Drazaic | 1,729 | 37.6 | +0.5 | |
Conservative | Shirley Clayton | 324 | 7.0 | -1.3 | |
Liberal Democrats | John Dryden | 284 | 6.2 | +1.0 | |
TUSC | Daniel Smith | 172 | 3.7 | +1.8 | |
Majority | 365 | ||||
Turnout | 4,603 | 34.43 | -2.21 | ||
Green hold | Swing | ||||
Party | Candidate | Votes | % | ±% | |
---|---|---|---|---|---|
Liberal Democrats | Mohammed Mahroof | 2,228 | 40.1 | +3.8 | |
Labour | Amy Frances Mount | 1,981 | 35.7 | +1.0 | |
Green | Thomas Atkin | 800 | 14.4 | -6.5 | |
Conservative | Christopher Garratt | 432 | 7.8 | -0.3 | |
TUSC | Liam Ball | 113 | 2.0 | N/A | |
Majority | 247 | ||||
Turnout | 5,554 | 41.89 | +0.40 | ||
Liberal Democrats hold | Swing | ||||
Party | Candidate | Votes | % | ±% | |
---|---|---|---|---|---|
Green | Toby Mallinson | 2,434 | 46.1 | +1.0 | |
Labour Co-op | George Lindars-Hammond* | 2,032 | 38.5 | -0.1 | |
Conservative | Patricia Barnsley | 447 | 8.5 | -1.6 | |
Liberal Democrats | Will Sapwell | 263 | 5.0 | +0.7 | |
TUSC | Rory Smith | 106 | 2.0 | +0.1 | |
Majority | 402 | ||||
Turnout | 5,282 | 36.36 | +0.05 | ||
Green gain from Labour | Swing | ||||
Two seats were up for election in Manor Castle.
Party | Candidate | Votes | % | ±% | |
---|---|---|---|---|---|
Labour Co-op | Laura Moynahan | 1,508 | 49.5 | -3.0 | |
Labour Co-op | Sioned-Mair Richards* | 1,274 | 41.8 | -10.7 | |
Green | Ruth Flagg-Abbey | 654 | 21.5 | +3.6 | |
Green | Catherine Fish | 584 | 19.2 | +1.3 | |
Yorkshire | Jack Carrington | 434 | 14.2 | +4.3 | |
Conservative | Isaac Howarth | 309 | 10.1 | -1.9 | |
Liberal Democrats | Zoe Boston | 249 | 8.2 | +3.4 | |
Liberal Democrats | Stephanie Kenning | 206 | 6.8 | +2.0 | |
TUSC | Alistair Tice | 171 | 5.6 | +2.5 | |
Independent | Justin Buxton | 108 | 3.5 | N/A | |
Independent | Helen McIlroy | 78 | 2.6 | N/A | |
Independent | Dan Kahn | 28 | 0.9 | N/A | |
Majority | |||||
Turnout | 3,046 | 20.79 | -0.55 | ||
Labour hold | Swing | ||||
Party | Candidate | Votes | % | ±% | |
---|---|---|---|---|---|
Liberal Democrats | Glynis Chapman | 1,788 | 43.1 | +2.2 | |
Labour Co-op | Samantha Nicholson | 1,546 | 37.2 | -0.8 | |
Conservative | Mark Finney | 497 | 12.0 | -3.6 | |
Green | Julie White | 215 | 5.2 | -0.3 | |
TUSC | Joseph Howard | 105 | 2.5 | N/A | |
Majority | 242 | ||||
Turnout | 4,151 | 30.82 | -0.95 | ||
Liberal Democrats hold | Swing | ||||
Party | Candidate | Votes | % | ±% | |
---|---|---|---|---|---|
Labour Co-op | Ibby Ullah | 3,072 | 47.4 | -0.2 | |
Green | Bev Bennett | 2,437 | 37.6 | -2.0 | |
Liberal Democrats | Chris Lynch | 519 | 8.0 | +2.0 | |
Conservative | John Chapman | 277 | 4.3 | -0.1 | |
TUSC | Holly Johnston | 175 | 2.7 | +0.3 | |
Majority | 635 | ||||
Turnout | 6,480 | 42.21 | -0.58 | ||
Labour gain from Green | Swing | ||||
Party | Candidate | Votes | % | ±% | |
---|---|---|---|---|---|
Labour Co-op | Ben Miskell* | 1,546 | 49.9 | +5.1 | |
Conservative | Richard Blyth | 575 | 18.6 | +0.2 | |
Green | Jen Barnard | 526 | 17.0 | -0.4 | |
Liberal Democrats | Ann Kingdom | 304 | 9.8 | +1.5 | |
TUSC | Jack Jeffery | 148 | 4.8 | +1.6 | |
Majority | 971 | ||||
Turnout | 3,099 | 23.99 | -1.27 | ||
Labour hold | Swing | ||||
Party | Candidate | Votes | % | ±% | |
---|---|---|---|---|---|
Labour | Dianne Hurst* | 1,666 | 52.3 | +1.9 | |
Conservative | Andrew Smith | 569 | 17.8 | -3.6 | |
Green | Luke Hunt | 304 | 9.5 | -2.9 | |
Liberal Democrats | Susan Ross | 289 | 9.1 | +3.5 | |
Reform UK | Brian Kus | 248 | 7.8 | N/A | |
TUSC | Susan Statter | 112 | 3.5 | +2.2 | |
Majority | 1,097 | ||||
Turnout | 3,188 | 23.06 | -0.77 | ||
Labour hold | Swing | ||||
Party | Candidate | Votes | % | ±% | |
---|---|---|---|---|---|
Labour Co-op | Dawn Dale* | 1,621 | 60.3 | +1.7 | |
Conservative | Zoe Steane | 514 | 19.1 | +0.1 | |
Green | Joel Gilbert | 300 | 11.2 | +0.1 | |
Liberal Democrats | Diane Leek | 228 | 8.5 | -0.1 | |
Communist | Ben Ughetti | 66 | 2.5 | -0.2 | |
Majority | 1,107 | ||||
Turnout | 2,689 | 19.72 | -1.92 | ||
Labour hold | Swing | ||||
Party | Candidate | Votes | % | ±% | |
---|---|---|---|---|---|
Labour | Mike Chaplin* | 1,658 | 60.1 | +3.6 | |
Conservative | Lesley Blyth | 449 | 16.3 | -3.6 | |
Green | Andrew Hards | 312 | 11.3 | -4.2 | |
Liberal Democrats | Kevin Grum | 228 | 8.3 | +0.1 | |
TUSC | Luke Brownbill | 114 | 4.1 | N/A | |
Majority | 1,209 | ||||
Turnout | 2,761 | 20.10 | -1.02 | ||
Labour hold | Swing | ||||
Party | Candidate | Votes | % | ±% | |
---|---|---|---|---|---|
Liberal Democrats | Penny Baker* | 2,783 | 52.4 | +15.6 | |
Labour | Seun Ebenezer | 1,247 | 23.5 | -5.1 | |
Conservative | Ben Woollard | 706 | 13.3 | -0.9 | |
Green | Matty Kimber | 498 | 9.4 | -5.2 | |
TUSC | Robert Simpson | 80 | 1.5 | N/A | |
Majority | 1,536 | ||||
Turnout | 5,314 | 37.22 | -0.94 | ||
Liberal Democrats hold | Swing | ||||
Party | Candidate | Votes | % | ±% | |
---|---|---|---|---|---|
Labour | Julie Grocutt* | 2,678 | 51.3 | +12.7 | |
Conservative | David Chinchen | 1,791 | 34.3 | -1.3 | |
Green | David Willington | 390 | 7.5 | -7.0 | |
Liberal Democrats | Amanda Davey | 295 | 5.6 | -5.6 | |
TUSC | Patricia Prystupa | 48 | 0.9 | N/A | |
Majority | 887 | ||||
Turnout | 5,223 | 36.10 | +0.79 | ||
Labour hold | Swing | ||||
Party | Candidate | Votes | % | ±% | |
---|---|---|---|---|---|
Labour | Laura McClean | 2,769 | 50.5 | +6.7 | |
Green | Ash Routh | 1,767 | 32.2 | -9.9 | |
Liberal Democrats | Alex Purvis | 358 | 6.5 | +2.2 | |
Conservative | Evelyn Millward | 271 | 4.9 | -1.8 | |
TUSC | Isabelle France | 162 | 3.0 | +1.5 | |
Reform UK | John Davidson | 158 | 2.9 | N/A | |
Majority | 1,002 | 18.27 | |||
Turnout | 5,485 | 36.35 | -0.74 | ||
Labour hold | Swing | ||||
Party | Candidate | Votes | % | ±% | |
---|---|---|---|---|---|
Liberal Democrats | Alan Hooper* | 1,856 | 45.2 | +6.5 | |
Labour | Adam Hurst | 1,236 | 30.1 | -1.1 | |
Conservative | Kevin Mahoney | 390 | 9.5 | -5.3 | |
Reform UK | John Booker | 340 | 8.3 | -0.1 | |
Green | Kathy Aston | 227 | 5.5 | -1.4 | |
TUSC | Rebecca Fryer | 54 | 1.3 | N/A | |
Majority | 620 | ||||
Turnout | 4,103 | 30.82 | -1.09 | ||
Liberal Democrats hold | Swing | ||||
Party | Candidate | Votes | % | ±% | |
---|---|---|---|---|---|
Labour Co-op | Alison Norris | 1,706 | 55.5 | +1.4 | |
Conservative | Anne Smith | 643 | 20.9 | +1.7 | |
Liberal Democrats | Charles Edwardson | 293 | 9.5 | +3.1 | |
Green | Chris Bragg | 290 | 9.4 | +1.2 | |
TUSC | Joshua Crapper | 140 | 4.6 | +2.4 | |
Majority | 1,063 | ||||
Turnout | 3,072 | 24.17 | -0.84 | ||
Labour hold | Swing | ||||
Party | Candidate | Votes | % | ±% | |
---|---|---|---|---|---|
Liberal Democrats | Will Sapwell | 2,258 | 52.7 | +0.3 | |
Labour | Lewis Dagnall | 1,212 | 28.3 | +4.8 | |
Conservative | Ben Woollard | 372 | 8.7 | -4.6 | |
Green | Chris Bragg | 328 | 7.6 | -1.8 | |
Liberal | Rod Rodgers | 118 | 2.8 | N/A | |
Majority | 1,046 | 24.4 | |||
Turnout | 4,288 | 30.27 | -6.95 | ||
Liberal Democrats hold | Swing | ||||
Sheffield Central is a constituency represented in the House of Commons of the UK Parliament since 2010 by Paul Blomfield, a member of the Labour Party.
Sheffield City Council is the local authority for the City of Sheffield, a metropolitan borough with city status in South Yorkshire, England. The council consists of 84 councillors, elected to represent 28 wards, each with three councillors. It is currently under no overall control, with Labour, the Liberal Democrats and the Green Party each holding chair positions in a proportionate number of committees.
Sheffield City Council elections took place on Thursday 5 May 2016, alongside nationwide local elections. All 84 seats were up for election, 3 per ward, after several electoral boundaries were changed. Labour, the Liberal Democrats and the Green Party contested all 84 seats. The Conservatives fielded 55 candidates, UKIP 43, TUSC 23 and Yorkshire First 1. There was also 1 independent candidate. Voters in the Sheffield Brightside and Hillsborough Parliamentary constituency also elected Gill Furniss MP, in a by-election triggered by the death of her husband Harry Harpham MP.
The 2021 Sheffield City Council election took place on 6 May 2021 to elect members of Sheffield City Council in England, as part of the nationwide local elections. The election was originally due to take place on 7 May 2020, but was postponed due to the COVID-19 pandemic. One seat from each ward was up for election.
The 2022 Southwark London Borough Council election took place on 5 May 2022. All 63 members of Southwark London Borough Council were elected. The elections took place alongside local elections in the other London boroughs and elections to local authorities across the United Kingdom.
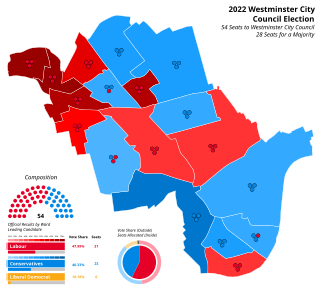
The 2022 Westminster City Council election took place on 5 May 2022. All 54 members of Westminster City Council have been elected. The elections took place alongside local elections in the other London boroughs and elections to local authorities across the United Kingdom.
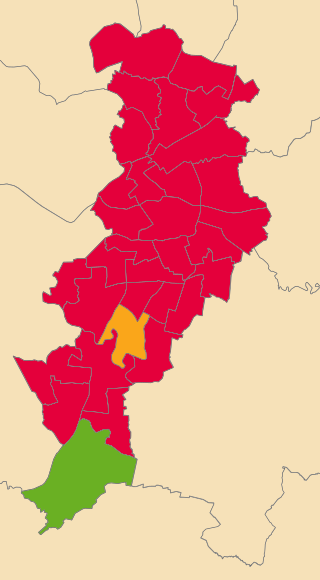
The 2022 Manchester City Council election took place on 5 May 2022. One third of councillors on Manchester City Council were elected. This election was a part of the other local elections across the United Kingdom.
The 2022 St Helens Metropolitan Borough Council election took place on 5 May 2022. Due to boundary changes, all 48 councillors were elected at the same time, with the council moving to a system of all-out elections every four years. The election took place alongside other local elections across the United Kingdom.
The 2022 Barnsley Metropolitan Borough Council election took place on 5 May 2022. One third of councillors — 21 out of 63 — were elected. The election took place alongside the 2022 South Yorkshire mayoral election and other local elections across the United Kingdom.
The 2022 City of Bradford Metropolitan District Council election took place on 5 May 2022 to elect one third of councillors to the City of Bradford Metropolitan District Council. The election took place at the same time as other local elections across the United Kingdom.
The 2022 Calderdale Metropolitan Borough Council election took place on 5 May 2022 to elect members of Calderdale Metropolitan Borough Council in England. One third of councillors — 17 out of 51, plus one vacancy in Ovenden ward were up for election. The election took place alongside other local elections across the United Kingdom.
The 2022 Dudley Metropolitan Borough Council election took place on 5 May 2022. One third of councillors—24 out of 72—on Dudley Metropolitan Borough Council were elected, with 1 ward electing 2 councillors. The election took place alongside other local elections across the United Kingdom.
The 2022 Kirklees Metropolitan Borough Council election took place on 5 May 2022. One third of councillors—23 out of 69—on Kirklees Metropolitan Borough Council were elected. The election took place alongside other local elections across the United Kingdom.
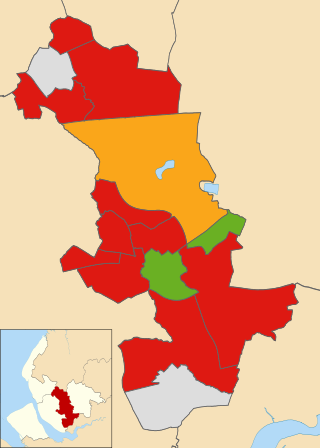
The 2022 Knowsley Metropolitan Borough Council election took place on 5 May 2022. One third of councillors — 15 out of 45 — on Knowsley Metropolitan Borough Council were elected. The election took place alongside other local elections across the United Kingdom.
The 2022 Newcastle City Council election took place on 5 May 2022. One third of councillors — 26 out of 78 — on Newcastle City Council were elected. The election took place alongside other local elections across the United Kingdom.
The 2022 Oldham Metropolitan Borough Council election took place on 5 May 2022. One third—20 out of 60—of councillors on Oldham Council was elected. The election took place alongside other local elections across the United Kingdom.
The 2022 Salford City Council election took place on 5 May 2022 along with other local elections across the United Kingdom. One third—20 out of 60—of councillor seats on Salford City Council were up for election.
The 2023 Colchester City Council election took place on 4 May 2023 to elect members of Colchester City Council in Essex, England. This was on the same day as other local elections across England. There were 17 of the 51 seats on the council up for election, being the usual third of the council, with one seat available for each ward. This set of seats were last contested at the 2019 election.
The 2024 Barnsley Metropolitan Borough Council election was held on Thursday 2 May 2024, alongside the other local elections across the United Kingdom being held on the same day.
The 2024 Sheffield City Council election took place on Thursday 2 May 2024, alongside the other local elections in the United Kingdom being held on the same day. One-third of the 84 members of Sheffield City Council in South Yorkshire was elected, alongside a vacancy in Firth Park ward.