![]() | |||||||||||||||||||||||||||||
| |||||||||||||||||||||||||||||
30 of 84 seats to Sheffield City Council 43 seats needed for a majority | |||||||||||||||||||||||||||||
---|---|---|---|---|---|---|---|---|---|---|---|---|---|---|---|---|---|---|---|---|---|---|---|---|---|---|---|---|---|
| |||||||||||||||||||||||||||||
![]() Map showing the results of the 2008 Sheffield City Council elections. | |||||||||||||||||||||||||||||
|
Sheffield City Council elections took place on Thursday 1 May 2008. There were 30 seats up for election - one of the three councillors from each ward, plus two seats from Labour councillors who had stepped down. Liberal Democrats made several gains, regaining control of the council for the first time since losing it in 2002. The overall turnout for this election was 36.8%. [1]
Ward | Incumbent Elected | Incumbent | Elected |
---|---|---|---|
Arbourthorne | 2004 | Julie Dore | Julie Dore |
Beauchief & Greenhill | 2004 | Anthony Holmes | Louise McCann |
Beighton | 2004 | Ian Saunders | Ian Saunders |
Birley | 2004 | Bryan Lodge | Bryan Lodge |
Broomhill | 2004 | Paul Scriven | Paul Scriven |
Burngreave | 2004 | Jackie Drayton | Jackie Drayton |
Central | 2004 | Jean Cromar | Robert Murphy |
Crookes | 2004 | Brian Holmes | Brian Holmes |
Darnall | 2004 | Mary Lea | Mary Lea |
Dore and Totley | 2004 | Anne Smith | Colin Ross |
East Ecclesfield | 2004 | Patricia Fox | Patricia Fox |
Ecclesall | 2004 | Sylvia Dunkley | Sylvia Dunkley |
Firth Park | 2004 | Joan Barton | Joan Barton |
Fulwood | 2004 | John Knight | John Knight |
Gleadless Valley | 2004 | Terry Fox | Frank Taylor |
Graves Park | 2004 | Peter Moore | Peter Moore |
Hillsborough | 2004 | Robert MacDonald | Joe Taylor |
Manor Castle | 2004 | Pat Midgley | Pat Midgley |
Mosborough (1) | 2004 | Mike Peat | Gail Smith |
Mosborough (2) | 2006 | Sam Wall | Chris Tutt |
Nether Edge | 2004 | Ali Qadar | Ali Qadar |
Richmond (1) | 2004 | Martin Lawton | Martin Lawton |
Richmond (2) | 2006 | Liz Naylor | Lynn Rooney |
Shiregreen and Brightside | 2004 | Jane Bird | Jane Bird |
Southey | 2004 | Tony Damms | Tony Damms |
Stannington | 2004 | Arthur Dunworth | Arthur Dunworth |
Stocksbridge and Upper Don | 2004 | Martin Davis | Jack Clarkson |
Walkley | 2004 | Diane Leek | Diane Leek |
West Ecclesfield | 2004 | Kathleen Chadwick | Kathleen Chadwick |
Woodhouse | 2004 | Marjorie Barker | Marjorie Barker |
Party | Seats | Gains | Losses | Net gain/loss | Seats % | Votes % | Votes | +/− | |
---|---|---|---|---|---|---|---|---|---|
Liberal Democrats | 17 | 5 | 0 | +5 | 56.7 | 36.9 | 50,282 | +3.0 | |
Labour | 12 | 0 | 5 | -5 | 40.0 | 30.0 | 40,939 | -4.8 | |
Conservative | 0 | 0 | 1 | -1 | 0.0 | 16.0 | 21,857 | +1.5 | |
Green | 1 | 1 | 0 | +1 | 3.3 | 9.1 | 12,446 | -0.5 | |
BNP | 0 | 0 | 0 | 0 | 0.0 | 4.0 | 5,489 | +0.7 | |
UKIP | 0 | 0 | 0 | 0 | 0.0 | 1.6 | 2,114 | -0.2 | |
Independent | 0 | 0 | 0 | 0 | 0.0 | 1.3 | 1,799 | N/A | |
Left List | 0 | 0 | 0 | 0 | 0.0 | 0.8 | 1,089 | N/A | |
Socialist Alternative | 0 | 0 | 0 | 0 | 0.0 | 0.2 | 271 | +0.1 |
The Liberal Democrats gained five seats from their position following the 2004 election, but also regained a seat lost to an Independent via defection in Stocksbridge & Upper Don.
Party | Previous council | New council | |||
---|---|---|---|---|---|
Liberal Democrats | 39 | 45 | |||
Labour | 41 | 36 | |||
Green | 2 | 3 | |||
Conservatives | 1 | 0 | |||
Independent Liberal Democrat | 1 | 0 | |||
Total | 84 | 84 | |||
Working majority | 0 | 6 |
Party | Candidate | Votes | % | ±% | |
---|---|---|---|---|---|
Labour | Julie Dore* | 1,606 | 41.5 | -14.3 | |
Liberal Democrats | Robert Cowbury | 1,094 | 28.3 | +6.2 | |
Conservative | Peter Smith | 727 | 18.8 | +4.8 | |
Green | Jennyfer Barnard | 445 | 11.5 | +3.4 | |
Majority | 512 | 13.2 | -20.6 | ||
Turnout | 3,872 | 32.0 | +2.4 | ||
Labour hold | Swing | ||||
Party | Candidate | Votes | % | ±% | |
---|---|---|---|---|---|
Liberal Democrats | Louise McCann | 2,096 | 39.6 | +1.3 | |
Labour | Neil Cleeveley | 1,451 | 27.4 | -4.2 | |
Conservative | Michelle Grant | 941 | 17.8 | +2.8 | |
BNP | John Beatson | 525 | 9.9 | +0.5 | |
Green | David Hayes | 275 | 5.2 | -0.4 | |
Majority | 645 | 12.2 | +5.5 | ||
Turnout | 5,288 | 39.0 | -0.5 | ||
Liberal Democrats hold | Swing | ||||
Party | Candidate | Votes | % | ±% | |
---|---|---|---|---|---|
Labour | Ian Saunders* | 1,730 | 42.9 | -5.6 | |
Conservative | Shirley Clayton | 1,234 | 30.6 | +5.0 | |
Liberal Democrats | Tracey Williams | 746 | 18.5 | +1.8 | |
Green | Andrew Brandram | 318 | 7.9 | -1.3 | |
Majority | 496 | 12.3 | -10.6 | ||
Turnout | 4,028 | 31.0 | -0.5 | ||
Labour hold | Swing | ||||
Party | Candidate | Votes | % | ±% | |
---|---|---|---|---|---|
Labour | Bryan Lodge* | 2,095 | 48.1 | -5.5 | |
Liberal Democrats | Ben Curran | 952 | 21.8 | +5.5 | |
Conservative | Gordon Millward | 872 | 20.0 | +4.8 | |
Green | Francis Plunkett | 438 | 10.1 | +1.6 | |
Majority | 1,143 | 26.2 | -11.1 | ||
Turnout | 4,357 | 34.4 | +0.1 | ||
Labour hold | Swing | ||||
Party | Candidate | Votes | % | ±% | |
---|---|---|---|---|---|
Liberal Democrats | Paul Scriven* | 1,329 | 46.7 | +1.3 | |
Green | Rob Cole | 756 | 26.6 | -0.6 | |
Labour | Zoe Sykes | 401 | 14.1 | -2.7 | |
Conservative | Michael Ginn | 359 | 12.6 | +2.0 | |
Majority | 573 | 20.1 | +1.9 | ||
Turnout | 2,845 | 24.5 | -1.6 | ||
Liberal Democrats hold | Swing | ||||
Party | Candidate | Votes | % | ±% | |
---|---|---|---|---|---|
Labour | Jackie Drayton* | 2,369 | 50.5 | -1.1 | |
Left List | Maxine Bowler | 1,089 | 23.2 | -0.8 | |
Green | Christopher Sissons | 638 | 13.6 | +5.4 | |
Conservative | Rashid Zaman | 593 | 12.6 | +3.0 | |
Majority | 1,280 | 27.3 | -0.3 | ||
Turnout | 5,689 | 32.0 | -4.7 | ||
Labour hold | Swing | ||||
Party | Candidate | Votes | % | ±% | |
---|---|---|---|---|---|
Green | Rob Murphy | 1,611 | 40.2 | +4.6 | |
Labour | Mohammad Maroof | 1,563 | 39.0 | +8.0 | |
Liberal Democrats | Mohammad Azim | 522 | 13.0 | -9.8 | |
Conservative | June Ledbury | 311 | 7.8 | +1.0 | |
Majority | 48 | 1.2 | -3.4 | ||
Turnout | 4,007 | 31.0 | ±0.0 | ||
Green gain from Labour | Swing | ||||
Party | Candidate | Votes | % | ±% | |
---|---|---|---|---|---|
Liberal Democrats | Brian Holmes* | 2,690 | 52.9 | -0.9 | |
Conservative | Robert Sheridan | 1,045 | 20.6 | +3.3 | |
Green | Julian Briggs | 698 | 13.7 | +1.3 | |
Labour | Qurban Hussain | 651 | 12.8 | -3.7 | |
Majority | 1,645 | 32.4 | -4.2 | ||
Turnout | 5,084 | 38.0 | -1.0 | ||
Liberal Democrats hold | Swing | ||||
Party | Candidate | Votes | % | ±% | |
---|---|---|---|---|---|
Labour | Mary Lea* | 2,039 | 44.3 | -0.9 | |
Liberal Democrats | Misbah Chowdhury | 1,484 | 32.2 | +21.0 | |
Conservative | Anne Corke | 439 | 9.5 | +0.9 | |
UKIP | Charlotte Arnott | 414 | 9.0 | +1.2 | |
Green | Julie White | 228 | 5.0 | -0.4 | |
Majority | 555 | 12.1 | -11.3 | ||
Turnout | 4,604 | 34.0 | -0.2 | ||
Labour hold | Swing | ||||
Party | Candidate | Votes | % | ±% | |
---|---|---|---|---|---|
Liberal Democrats | Colin Ross | 3,606 | 48.6 | -3.6 | |
Conservative | Anne Smith* | 3,231 | 43.6 | +8.1 | |
Labour | Javed Khan | 275 | 3.7 | -2.3 | |
Green | Rita Wilcock | 183 | 2.5 | -1.5 | |
UKIP | James Laurie | 124 | 1.7 | -0.8 | |
Majority | 375 | 5.1 | -11.6 | ||
Turnout | 7,419 | 56.1 | +3.0 | ||
Liberal Democrats gain from Conservative | Swing | ||||
Party | Candidate | Votes | % | ±% | |
---|---|---|---|---|---|
Liberal Democrats | Patricia Fox* | 2,314 | 43.0 | +5.9 | |
Labour | Angela Weatherall | 1,622 | 30.2 | -5.2 | |
BNP | Shirley Collins | 677 | 12.6 | -0.5 | |
Conservative | Paula Mayfield | 582 | 10.8 | +1.6 | |
Green | Lamia Safir | 181 | 3.4 | -1.7 | |
Majority | 692 | 12.9 | +11.1 | ||
Turnout | 5,376 | 38.4 | +8.5 | ||
Liberal Democrats hold | Swing | ||||
Party | Candidate | Votes | % | ±% | |
---|---|---|---|---|---|
Liberal Democrats | Sylvia Dunkley* | 3,893 | 58.2 | +4.7 | |
Conservative | Michael Young | 1,630 | 24.4 | -1.2 | |
Green | Jason Leman | 615 | 9.2 | -1.8 | |
Labour | Jack Scott | 547 | 8.1 | -1.8 | |
Majority | 2,263 | 33.9 | +6.0 | ||
Turnout | 6,685 | 47.0 | +1.5 | ||
Liberal Democrats hold | Swing | ||||
Party | Candidate | Votes | % | ±% | |
---|---|---|---|---|---|
Labour | Joan Barton* | 1,813 | 47.5 | -6.0 | |
BNP | Michael Smith | 742 | 19.5 | +2.4 | |
Liberal Democrats | Philip Morris | 547 | 14.3 | +2.4 | |
Conservative | Paul Rymill | 377 | 9.9 | -0.4 | |
Green | Jonathan Cook | 257 | 6.7 | -0.6 | |
Independent | Maria-Barbara Noack | 78 | 2.0 | N/A | |
Majority | 971 | 25.5 | -10.9 | ||
Turnout | 3,814 | 30.0 | ±0.0 | ||
Labour hold | Swing | ||||
Party | Candidate | Votes | % | ±% | |
---|---|---|---|---|---|
Liberal Democrats | John Knight* | 2,893 | 54.9 | -1.2 | |
Conservative | Alan Ryder | 1,434 | 27.2 | -0.3 | |
Labour | Isobel Bowler | 432 | 8.2 | +0.9 | |
Green | Stephen Hitchens | 374 | 7.1 | -0.1 | |
UKIP | Patricia Sullivan | 139 | 2.6 | +0.7 | |
Majority | 1,459 | 27.7 | -0.9 | ||
Turnout | 5,272 | 44.0 | -2.2 | ||
Liberal Democrats hold | Swing | ||||
Party | Candidate | Votes | % | ±% | |
---|---|---|---|---|---|
Liberal Democrats | Frank Taylor | 2,183 | 42.1 | +3.1 | |
Labour | Terence Fox* | 1,821 | 35.1 | -3.0 | |
Green | Gareth Roberts | 781 | 15.1 | -0.7 | |
Conservative | Jennifer Grant | 400 | 7.7 | +0.7 | |
Majority | 362 | 7.0 | +6.1 | ||
Turnout | 5,185 | 39.0 | -0.8 | ||
Liberal Democrats gain from Labour | Swing | ||||
Party | Candidate | Votes | % | ±% | |
---|---|---|---|---|---|
Liberal Democrats | Peter Moore* | 2,519 | 47.1 | +3.4 | |
Labour | Robert Pemberton | 1,105 | 20.7 | -5.4 | |
Conservative | Trevor Grant | 885 | 16.5 | +1.7 | |
Green | Richard Roper | 345 | 6.5 | -1.5 | |
Socialist Alternative | Alan Munro | 271 | 5.1 | +1.4 | |
UKIP | Pauline Arnott | 226 | 4.2 | +0.4 | |
Majority | 1,417 | 26.5 | +8.9 | ||
Turnout | 5,348 | 41.0 | +0.8 | ||
Liberal Democrats hold | Swing | ||||
Party | Candidate | Votes | % | ±% | |
---|---|---|---|---|---|
Liberal Democrats | Joe Taylor | 2,739 | 49.9 | +5.5 | |
Labour | Robert Macdonald* | 1,620 | 29.5 | -5.9 | |
BNP | Eric Collins | 491 | 8.9 | +0.2 | |
Green | Christopher McMahon | 346 | 6.3 | -0.2 | |
Conservative | Neil Everest | 292 | 5.3 | +0.3 | |
Majority | 1,119 | 20.4 | +11.4 | ||
Turnout | 5,488 | 41.8 | +0.6 | ||
Liberal Democrats gain from Labour | Swing | ||||
Party | Candidate | Votes | % | ±% | |
---|---|---|---|---|---|
Labour | Patricia Midgley* | 1,621 | 52.9 | -7.7 | |
Liberal Democrats | David Croft | 687 | 22.4 | +5.4 | |
Conservative | Christina Stark | 400 | 13.1 | +3.2 | |
Green | Graham Wroe | 357 | 11.6 | -0.9 | |
Majority | 934 | 30.5 | -13.1 | ||
Turnout | 3,065 | 27.3 | -0.4 | ||
Labour hold | Swing | ||||
Party | Candidate | Votes | % | ±% | |
---|---|---|---|---|---|
Liberal Democrats | Gail Smith | 2,451 | 50.8 | +17.0 | |
Liberal Democrats | Christopher Tutt | 2,019 | 41.9 | +8.1 | |
Labour | Sarah Cullen | 1,660 | 34.4 | -7.3 | |
Labour | Andrew Peat* | 1,626 | 33.7 | -8.0 | |
Conservative | Evelyn Millward | 746 | 15.5 | +0.2 | |
Conservative | Margaret Pigott | 561 | 11.6 | -3.7 | |
Green | Anwen Fryer | 290 | 6.0 | +2.4 | |
Majority | 359 | 7.5 | N/A | ||
Turnout | 4,822 | 37.7 | +4.0 | ||
Liberal Democrats gain from Labour | Swing | ||||
Party | Candidate | Votes | % | ±% | |
---|---|---|---|---|---|
Liberal Democrats | Ali Qadar* | 2,661 | 44.6 | +5.6 | |
Labour | Mohammed Hafiz | 2,165 | 36.3 | +5.5 | |
Green | Mervyn Smith | 780 | 13.1 | -6.7 | |
Conservative | Rosita Malandrinos | 359 | 6.0 | -4.4 | |
Majority | 496 | 8.3 | +0.1 | ||
Turnout | 5,965 | 47.0 | +7.2 | ||
Liberal Democrats hold | Swing | ||||
Party | Candidate | Votes | % | ±% | |
---|---|---|---|---|---|
Labour | Lynn Rooney | 1,759 | 44.4 | -7.4 | |
Labour | Martin Lawton* | 1,693 | 42.8 | -9.0 | |
Liberal Democrats | Anders Hanson | 736 | 18.6 | +2.8 | |
Liberal Democrats | Barbara Masters | 699 | 17.7 | +1.9 | |
Conservative | Ian Fey | 618 | 15.6 | +4.1 | |
UKIP | Leslie Arnott | 618 | 15.6 | +6.2 | |
Conservative | Maureen Neill | 560 | 14.1 | +2.6 | |
Green | Eamonn Ward | 439 | 11.1 | +5.3 | |
UKIP | Jennifer-Marie Ruchat | 356 | 9.0 | -0.4 | |
Majority | 957 | 24.2 | -11.7 | ||
Turnout | 3,959 | 31.0 | -0.6 | ||
Labour hold | Swing | ||||
Party | Candidate | Votes | % | ±% | |
---|---|---|---|---|---|
Labour | Jane Bird* | 1,757 | 44.1 | -7.6 | |
BNP | Tracey Smith | 846 | 21.3 | -2.5 | |
Conservative | Eric Kirby | 451 | 11.3 | +3.7 | |
Liberal Democrats | Tasadique Mohammed | 350 | 8.8 | -2.3 | |
Independent | Glynn Tipper | 350 | 8.8 | N/A | |
Green | Steve Brady | 227 | 5.7 | -0.1 | |
Majority | 911 | 22.9 | -5.0 | ||
Turnout | 3,981 | 30.0 | -0.7 | ||
Labour hold | Swing | ||||
Party | Candidate | Votes | % | ±% | |
---|---|---|---|---|---|
Labour | Tony Damms* | 1,695 | 41.9 | -11.9 | |
BNP | John Sheldon | 1,031 | 25.5 | +6.8 | |
Liberal Democrats | John Bowden | 716 | 17.7 | +3.9 | |
Conservative | Russell Cutts | 437 | 10.8 | +1.6 | |
Green | Gemma Lock | 162 | 4.0 | -0.5 | |
Majority | 664 | 16.4 | -18.7 | ||
Turnout | 4,041 | 30.7 | +1.4 | ||
Labour hold | Swing | ||||
Party | Candidate | Votes | % | ±% | |
---|---|---|---|---|---|
Liberal Democrats | Arthur Dunworth* | 2,713 | 46.7 | -2.7 | |
Labour | Alf Meade | 1,314 | 22.6 | -3.0 | |
Conservative | Andrew Lee | 883 | 15.2 | -1.2 | |
BNP | Martin Stevens | 547 | 9.4 | N/A | |
Green | Martin Bradshaw | 351 | 6.0 | -2.7 | |
Majority | 1,399 | 24.1 | +0.3 | ||
Turnout | 5,808 | 41.0 | +0.6 | ||
Liberal Democrats hold | Swing | ||||
Party | Candidate | Votes | % | ±% | |
---|---|---|---|---|---|
Liberal Democrats | Jack Clarkson | 2,258 | 39.0 | -0.3 | |
Independent | Martin Davis* | 1,371 | 23.7 | N/A | |
Conservative | Matt Dixon | 1,076 | 18.6 | +1.0 | |
Labour | Jim Bamford | 761 | 13.4 | -10.8 | |
Green | Angela Roberts | 327 | 5.6 | -3.2 | |
Majority | 887 | 15.3 | +0.2 | ||
Turnout | 5,793 | 40.7 | +4.2 | ||
Liberal Democrats hold | Swing | ||||
Stocksbridge & Upper Don was a regain for the Liberal Democrats, after the sitting councillor became an Independent.
Party | Candidate | Votes | % | ±% | |
---|---|---|---|---|---|
Liberal Democrats | Diane Leek* | 2,679 | 49.6 | +8.2 | |
Labour | Veronica Hardstaff | 1,899 | 35.2 | -5.5 | |
Green | James Wilson | 540 | 10.0 | -1.6 | |
Conservative | George Ledbury | 283 | 5.2 | -1.1 | |
Majority | 780 | 14.4 | +13.7 | ||
Turnout | 5,401 | 40.0 | +1.4 | ||
Liberal Democrats hold | Swing | ||||
Party | Candidate | Votes | % | ±% | |
---|---|---|---|---|---|
Liberal Democrats | Kathleen Chadwick* | 2,763 | 52.4 | +0.1 | |
Labour | Max Telfer | 1,130 | 21.5 | -9.4 | |
BNP | Malcolm Woodhead | 630 | 12.0 | N/A | |
Conservative | Robert McIlveen | 552 | 10.5 | -0.7 | |
Green | Kathryn Aston | 193 | 3.7 | -1.8 | |
Majority | 1,633 | 31.0 | +9.6 | ||
Turnout | 5,268 | 37.4 | +2.2 | ||
Liberal Democrats hold | Swing | ||||
Party | Candidate | Votes | % | ±% | |
---|---|---|---|---|---|
Labour | Marjorie Barker* | 2,041 | 47.6 | -5.8 | |
Conservative | Laurence Hayward | 700 | 16.3 | +4.4 | |
Liberal Democrats | Christopher Bingham | 661 | 15.4 | +2.6 | |
UKIP | Jonathan Arnott | 593 | 13.8 | -2.0 | |
Green | John Grant | 291 | 6.8 | +0.6 | |
Majority | 1,341 | 31.3 | -6.3 | ||
Turnout | 4,286 | 33.0 | +0.1 | ||
Labour hold | Swing | ||||
Party | Candidate | Votes | % | ±% | |
---|---|---|---|---|---|
Liberal Democrats | Colin Taylor | 2,239 | 44.3 | +1.3 | |
Labour | Zoe Sykes | 1,420 | 28.1 | -2.1 | |
BNP | John Sheldon | 719 | 14.2 | +1.6 | |
Conservative | John Hattersley | 564 | 11.2 | +0.4 | |
Green | Mia Safir | 107 | 2.1 | -1.3 | |
Majority | 819 | 16.2 | +3.3 | ||
Turnout | 5,049 | 36.0 | -2.4 | ||
Liberal Democrats hold | Swing | +1.6 | |||
The City of Sheffield is a city and metropolitan borough in South Yorkshire, England. The metropolitan borough includes the administrative centre of Sheffield, the town of Stocksbridge and larger village of Chapeltown and part of the Peak District. It has a population of 584,853, making it technically the third largest city in England by population behind Birmingham and Leeds, since London is not considered a single entity. It is governed by Sheffield City Council.
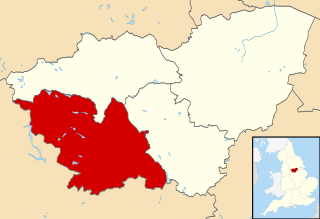
Penistone and Stocksbridge is a constituency in the House of Commons of the UK Parliament represented since 2019 by Miriam Cates, a Conservative. As with all constituencies, adults qualifying to vote in the seat elect one Member of Parliament (MP) by the first past the post system of election at least every five years.
Sheffield City Council elections took place on Thursday 3 May 2007 with one third of council seats up for election; one in each ward. Since the previous election, Liberal Democrat Martin Davis defected, sitting as an independent. This set of elections saw the Conservatives lose the only seat they had on the council since 1996, and the party did not have any councillors elected to Sheffield City Council until 2021.
The 2008 St Helens Metropolitan Borough Council election took place on 1 May 2008 to elect members of St Helens Metropolitan Borough Council in Merseyside, England. One third of the council was up for election and the council stayed under no overall control.
The 2008 Hull City Council election took place on 1 May 2008 to elect members of Hull City Council in England. One third of the council was up for election and the Liberal Democrats retained control of the council with an increased majority from a situation of ruling under no overall control.
The 2008 St Albans City and District Council election took place on 1 May 2008 to elect members of St Albans District Council in Hertfordshire, England. One third of the council was up for election and the Liberal Democrats gained overall control of the council from no overall control.
The 2008 Solihull Metropolitan Borough Council election took place on 1 May 2008 to elect members of Solihull Metropolitan Borough Council in the West Midlands, England. One third of the council was up for election and the Conservative Party gained overall control of the council from no overall control.
The 2006 St Albans City and District Council election took place on 4 May 2006 to elect members of St Albans District Council in Hertfordshire, England. One third of the council was up for election and the Liberal Democrats gained overall control of the council from no overall control.
Sheffield City Council elections took place on Thursday 6 May 2010. There were 28 seats up for election in 2010, one of the three councillors from each ward. Since the previous election, Liberal Democrat councillor Frank Taylor had defected to an Independent leaving the Liberal Democrats with 44 councillors. Turnout was up dramatically with it being held alongside the general election, to 62.6%. The higher turnout helped mainly Labour against their electoral rivals, who managed to return the council to no overall control with three gains. This was bolstered by the newly elected Liberal Democrat in Walkley defecting to Labour immediately after being elected.
Sheffield City Council elections took place on 5 May 2011. There were 28 seats up for election, one third of the council. The last election left the council with no overall control. Since the previous election, Liberal Democrat councillor Ben Curran, and Lib Dem-turned-independent Frank Taylor had defected to Labour leaving both parties equal at 41 councillors each. This election saw Labour regain control of the council that they lost in 2006, with nine gains from the Lib Dems. Overall turnout was 41.8%.
Sheffield City Council elections took place on Thursday 3 May 2012 as part of the 2012 United Kingdom local elections.
Elections to Sheffield City Council were held on 5 May 1994. One third of the council was up for election. Since the previous election, three by-elections had taken place, resulting in two Lib Dem gains from Labour in Brightside and Walkley and a successful hold of a Dore seat by the Conservatives. This, along with a defection from Burngreave councillor James Jamison, left Labour down three, the Liberal Democrats up two and the Conservatives unchanged going into this election.
Elections to Sheffield City Council were held on 6 May 1999 with one third of the council was up for election. Previous to this election, there had been a by-election in Park, resulting in a Liberal Democrat gain from Labour, effectively cancelling out the concurrent defection of sitting Stocksbridge councillor Alan Pears from the Lib Dems to Labour. The election saw the Liberal Democrats gain control of the council - the first time since its formation for it not to be controlled by Labour. The results themselves were more favourable to Labour than recent elections. However, they suffered double-digit losses, with the Liberal Democrats sustaining their recent election surges.
Elections to Sheffield City Council were held on 4 May 2000. One third of the council was up for election. Previous to this election, two Liberal Democrats – Robert Watson and Trefor Morgan – became Independents. Similarly there were two Labour defections, long-time Labour councillor Dorothy Walton went to the Liberal Democrats and Michael Smith became an Independent.
Elections to Suffolk County Council took place on 2 May 2013 as part of the 2013 United Kingdom local elections. 75 councillors were elected from 63 electoral divisions, which returned either one or two county councillors each by first-past-the-post voting for a four-year term of office. The electoral divisions were the same as those used at the previous election in 2009.
Sheffield City Council elections took place on May 22, 2014, alongside nationwide local elections and European elections.
The 2008 Huntingdonshire District Council election took place on 1 May 2008 to elect members of Huntingdonshire District Council in Cambridgeshire, England. One third of the council was up for election and the Conservative Party stayed in overall control of the council.
The 2010 Brent London Borough Council election took place on 6 May 2010 to elect members of Brent London Borough Council in London, England. The whole council was up for election and the Labour party gained overall control of the council from no overall control.
The 2007 Christchurch Borough Council election took place on 3 May 2007 to elect members of Christchurch Borough Council in Dorset, England. The whole council was up for election and the Conservative party stayed in overall control of the council.
Sheffield City Council elections took place on Thursday 5 May 2016, alongside nationwide local elections. All 84 seats were up for election, 3 per ward, after several electoral boundaries were changed. Labour, the Liberal Democrats and the Green Party contested all 84 seats. The Conservatives fielded 55 candidates, UKIP 43, TUSC 23 and Yorkshire First 1. There was also 1 independent candidate. Voters in the Sheffield Brightside and Hillsborough Parliamentary constituency also elected Gill Furniss MP, in a by-election triggered by the death of her husband Harry Harpham MP.