"}},"i":0}},"\n",{"template":{"target":{"wt":"Election box winning candidate with party link","href":"./Template:Election_box_winning_candidate_with_party_link"},"params":{"1":{"wt":"\n "},"party":{"wt":"Liberal Democrats (UK)"},"candidate":{"wt":"Mike Ellis"},"votes":{"wt":"1,016"},"percentage":{"wt":"50.0"},"change":{"wt":"+8.7"}},"i":1}},"\n",{"template":{"target":{"wt":"Election box candidate with party link","href":"./Template:Election_box_candidate_with_party_link"},"params":{"1":{"wt":"\n "},"party":{"wt":"Conservative Party (UK)"},"candidate":{"wt":"Guy Young"},"votes":{"wt":"521"},"percentage":{"wt":"25.6"},"change":{"wt":"+1.3"}},"i":2}},"\n",{"template":{"target":{"wt":"Election box candidate with party link","href":"./Template:Election_box_candidate_with_party_link"},"params":{"1":{"wt":"\n "},"party":{"wt":"Labour Party (UK)"},"candidate":{"wt":"Alistair Cooper"},"votes":{"wt":"272"},"percentage":{"wt":"13.4"},"change":{"wt":"-6.9"}},"i":3}},"\n",{"template":{"target":{"wt":"Election box candidate with party link","href":"./Template:Election_box_candidate_with_party_link"},"params":{"1":{"wt":"\n "},"party":{"wt":"Green Party of England and Wales"},"candidate":{"wt":"Graham Ward"},"votes":{"wt":"223"},"percentage":{"wt":"11.0"},"change":{"wt":"-3.1"}},"i":4}},"\n",{"template":{"target":{"wt":"Election box majority","href":"./Template:Election_box_majority"},"params":{"1":{"wt":"\n "},"votes":{"wt":"495"},"percentage":{"wt":"24.4"},"change":{"wt":"+7.4"}},"i":5}},"\n",{"template":{"target":{"wt":"Election box turnout","href":"./Template:Election_box_turnout"},"params":{"1":{"wt":"\n "},"votes":{"wt":"2,032"},"percentage":{"wt":"37.7"},"change":{"wt":"+1.5"}},"i":6}},"\n",{"template":{"target":{"wt":"Election box hold with party link","href":"./Template:Election_box_hold_with_party_link"},"params":{"1":{"wt":"\n "},"winner":{"wt":"Liberal Democrats (UK)"},"swing":{"wt":""}},"i":7}},"\n",{"template":{"target":{"wt":"Election box end","href":"./Template:Election_box_end"},"params":{},"i":8}}]}" id="mweA">
Party | Candidate | Votes | % | ±% | |
---|---|---|---|---|---|
Liberal Democrats | Allan Witherick | 864 | 39.4 | +9.3 | |
Labour | David McManus | 702 | 32.0 | −2.6 | |
Conservative | Indranil Chakravorty | 454 | 20.7 | −5.0 | |
Green | Naomi Love | 174 | 7.9 | −1.7 | |
Majority | 162 | 7.4 | |||
Turnout | 2,194 | 40.9 | +2.3 | ||
Liberal Democrats gain from Labour | Swing |
Party | Candidate | Votes | % | ±% | |
---|---|---|---|---|---|
Liberal Democrats | Christopher White | 979 | 47.6 | −6.3 | |
Conservative | Dursun Altun | 629 | 30.6 | +8.8 | |
Green | Pete Eggleston | 237 | 11.5 | −1.3 | |
Labour | Richard Harris | 211 | 10.3 | −1.2 | |
Majority | 350 | 17.0 | −15.1 | ||
Turnout | 2,056 | 43.3 | +0.5 | ||
Liberal Democrats hold | Swing |
Party | Candidate | Votes | % | ±% | |
---|---|---|---|---|---|
Liberal Democrats | Geoff Harrison | 971 | 49.0 | −4.9 | |
Conservative | James Vessey | 659 | 33.3 | +5.4 | |
Labour | John Paton | 208 | 10.5 | −0.4 | |
Green | Jack Easton | 143 | 7.2 | −0.1 | |
Majority | 312 | 15.7 | −10.3 | ||
Turnout | 1,981 | 41.4 | −2.5 | ||
Liberal Democrats hold | Swing |
Party | Candidate | Votes | % | ±% | |
---|---|---|---|---|---|
Conservative | Julie Bell | 1,259 | 51.6 | +1.3 | |
Liberal Democrats | Jeffrey Phillips | 944 | 38.7 | +0.9 | |
Labour | David Crew | 158 | 6.5 | −0.7 | |
Green | Lydia El-Khouri | 81 | 3.3 | −1.3 | |
Majority | 315 | 12.9 | +0.4 | ||
Turnout | 2,442 | 46.4 | +1.1 | ||
Conservative gain from Liberal Democrats | Swing |
Party | Candidate | Votes | % | ±% | |
---|---|---|---|---|---|
Conservative | John Chambers | 1,201 | 64.4 | +0.7 | |
Liberal Democrats | Gordon Burrow | 394 | 21.1 | −0.1 | |
Labour | Rosemary Ross | 142 | 7.6 | −0.8 | |
Green | Annett Tate | 127 | 6.8 | +0.1 | |
Majority | 807 | 43.3 | +0.5 | ||
Turnout | 1,864 | 36.3 | −2.8 | ||
Conservative hold | Swing |
Party | Candidate | Votes | % | ±% | |
---|---|---|---|---|---|
Conservative | Stuart Roberts | 1,518 | 75.2 | +1.0 | |
Liberal Democrats | Paul Spinks | 278 | 13.8 | +1.8 | |
Labour | Linda Spiri | 126 | 6.2 | −1.9 | |
Green | Lorna Hann | 96 | 4.8 | −1.0 | |
Majority | 1,240 | 61.4 | −0.8 | ||
Turnout | 2,018 | 38.4 | −2.6 | ||
Conservative hold | Swing |
Party | Candidate | Votes | % | ±% | |
---|---|---|---|---|---|
Conservative | Allen Chamberlain | 1,495 | 68.0 | +2.4 | |
Liberal Democrats | Albert Moses | 418 | 19.0 | ±0.0 | |
Labour | Benjamin Dearman | 160 | 7.3 | −1.0 | |
Green | Tim Blackwell | 125 | 5.7 | −4.4 | |
Majority | 1,077 | 49.0 | |||
Turnout | 2,198 | 39.6 | −4.0 | ||
Conservative gain from Independent | Swing |
Party | Candidate | Votes | % | ±% | |
---|---|---|---|---|---|
Conservative | Dave Winstone | 1,175 | 47.5 | +4.0 | |
Labour | Chris Flynn | 1,044 | 42.2 | −3.1 | |
Liberal Democrats | Mike Ketley | 140 | 5.7 | −5.6 | |
Green | Rosalind Hardy | 113 | 4.6 | +4.6 | |
Majority | 131 | 5.3 | |||
Turnout | 2,472 | 36.6 | +6.2 | ||
Conservative gain from Labour | Swing |
Party | Candidate | Votes | % | ±% | |
---|---|---|---|---|---|
Liberal Democrats | Janet Churchyard | 1,174 | 51.4 | −3.2 | |
Conservative | Seema Kennedy | 874 | 38.2 | +4.4 | |
Labour | Ruairi McCourt | 128 | 5.6 | −0.7 | |
Green | Rosalind Paul | 109 | 4.8 | −0.5 | |
Majority | 300 | 13.2 | −7.6 | ||
Turnout | 2,285 | 47.4 | +1.5 | ||
Liberal Democrats hold | Swing |
Party | Candidate | Votes | % | ±% | |
---|---|---|---|---|---|
Liberal Democrats | Melvyn Teare | 1,190 | 47.7 | −0.1 | |
Conservative | Sabena Khan | 848 | 34.0 | −0.2 | |
Labour | Anthony Nicholson | 254 | 10.2 | −0.8 | |
Green | Gillian Mills | 202 | 8.1 | +1.1 | |
Majority | 342 | 13.7 | +0.1 | ||
Turnout | 2,494 | 48.1 | −0.2 | ||
Liberal Democrats hold | Swing |
Party | Candidate | Votes | % | ±% | |
---|---|---|---|---|---|
Liberal Democrats | David Yates | 1,125 | 50.8 | +1.3 | |
Conservative | Mary Zambra | 861 | 38.9 | +0.4 | |
Labour | Alex Breed | 153 | 6.9 | −0.7 | |
Green | Stephen Clough | 74 | 3.3 | −1.1 | |
Majority | 264 | 11.9 | +0.9 | ||
Turnout | 2,213 | 41.4 | +0.8 | ||
Liberal Democrats hold | Swing |
Party | Candidate | Votes | % | ±% | |
---|---|---|---|---|---|
Independent | Tony Swendell | 1,258 | 59.8 | +59.8 | |
Conservative | Roger Gray | 687 | 32.7 | −13.7 | |
Labour | Richard Bruckdorfer | 81 | 3.9 | −0.5 | |
Green | Kate Metcalf | 77 | 3.7 | +0.1 | |
Majority | 571 | 27.1 | +26.3 | ||
Turnout | 2,103 | 44.8 | −2.3 | ||
Independent hold | Swing |
Party | Candidate | Votes | % | ±% | |
---|---|---|---|---|---|
Liberal Democrats | Roger Axworthy | 711 | 34.5 | +2.3 | |
Labour | Janet Smith | 707 | 34.3 | −2.7 | |
Conservative | Mary Murphy | 462 | 22.4 | +1.7 | |
Green | Thomas Hardy | 183 | 8.9 | −1.2 | |
Majority | 4 | 0.2 | |||
Turnout | 2,063 | 40.2 | +2.1 | ||
Liberal Democrats gain from Labour | Swing |
Party | Candidate | Votes | % | ±% | |
---|---|---|---|---|---|
Liberal Democrats | Martin Morris | 773 | 36.5 | −3.5 | |
Conservative | Nadia Davies | 661 | 31.2 | +8.5 | |
Green | Simon Grover | 362 | 17.1 | −1.7 | |
Labour | Michael Jewitt | 321 | 15.2 | −4.3 | |
Majority | 112 | 5.3 | −13.0 | ||
Turnout | 2,117 | 38.8 | +2.0 | ||
Liberal Democrats hold | Swing |
Party | Candidate | Votes | % | ±% | |
---|---|---|---|---|---|
Conservative | David Canham | 1,542 | 72.0 | +12.9 | |
Liberal Democrats | Tom Allum | 357 | 16.7 | −11.8 | |
Labour | Janet Blackwell | 153 | 7.1 | −1.0 | |
Green | Lucy Eggleston | 89 | 4.2 | −0.1 | |
Majority | 1,185 | 55.3 | +24.7 | ||
Turnout | 2,141 | 42.7 | +0.8 | ||
Conservative hold | Swing |
Party | Candidate | Votes | % | ±% | |
---|---|---|---|---|---|
Liberal Democrats | Fred Wartenberg | 1,273 | 47.5 | −4.4 | |
Conservative | Nigel Smith | 1,098 | 41.0 | +3.3 | |
Green | Margaret Grover | 185 | 6.9 | +1.2 | |
Labour | Jill Gipps | 125 | 4.7 | 0.0 | |
Majority | 175 | 6.5 | −7.7 | ||
Turnout | 2,681 | 52.5 | +0.2 | ||
Liberal Democrats gain from Conservative | Swing |
Party | Candidate | Votes | % | ±% | |
---|---|---|---|---|---|
Conservative | Gillian Clark | 1,240 | 50.9 | +6.3 | |
Liberal Democrats | Paul Edelston | 1,035 | 42.5 | −5.9 | |
Labour | Peter Woodhams | 86 | 3.5 | +0.3 | |
Green | Simon Wakeling | 75 | 3.1 | −0.7 | |
Majority | 205 | 8.4 | |||
Turnout | 2,436 | 52.5 | −1.6 | ||
Conservative gain from Liberal Democrats | Swing |
A by-election was held in Harpenden South on 4 June 2009 after Conservative councillor Paul Foster resigned from the council. [8] The seat was held for the Conservatives by Brian Ellis with a majority of 899 votes over the Labour Party. [9]
Party | Candidate | Votes | % | ±% | |
---|---|---|---|---|---|
Conservative | Brian Ellis | 1,602 | 53.5 | −21.8 | |
Labour | Richard Lane | 703 | 23.5 | +17.2 | |
Liberal Democrats | Albert Moses | 427 | 14.3 | +0.5 | |
Green | Annett Tate | 264 | 8.8 | +4.1 | |
Majority | 899 | 30.0 | |||
Turnout | 2,996 | ||||
Conservative hold | Swing |
St Albans is a constituency in Hertfordshire represented in the House of Commons of the UK Parliament since 2019 by Daisy Cooper, a Liberal Democrat.
Hertfordshire County Council in England is elected every four years. Since the last boundary changes took effect in 2017 there have been 78 electoral divisions electing one councillor each.
The 2006 South Lakeland District Council election took place on 4 May 2006 to elect members of South Lakeland District Council in Cumbria, England. One third of the council was up for election and the Liberal Democrats gained overall control of the council from no overall control.
The 2008 Harlow District Council election took place on 1 May 2008 to elect members of Harlow District Council in Essex, England. One third of the council was up for election and the Conservative party gained overall control of the council from no overall control.
The 2008 Hull City Council election took place on 1 May 2008 to elect members of Hull City Council in England. One third of the council was up for election and the Liberal Democrats retained control of the council with an increased majority from a situation of ruling under no overall control.
The 2008 Derby City Council election took place on 1 May 2008 to elect members of Derby City Council in England. One third of the council was up for election and the council stayed under no overall control. Overall turnout was 34.6%.
The 1998 St Albans City and District Council election took place on 7 May 1998 to elect members of St Albans City and District Council in Hertfordshire, England. One third of the council was up for election and the Liberal Democrats stayed in overall control of the council.
The 2002 St Albans City and District Council election took place on 2 May 2002 to elect members of St Albans District Council in Hertfordshire, England. One third of the council was up for election and the council stayed under no overall control.
The 2003 St Albans City and District Council election took place on 1 May 2003 to elect members of St Albans District Council in Hertfordshire, England. One third of the council was up for election and the council stayed under no overall control.
The 2004 St Albans City and District Council election took place on 10 June 2004 to elect members of St Albans District Council in Hertfordshire, England. One third of the council was up for election and the council stayed under no overall control.
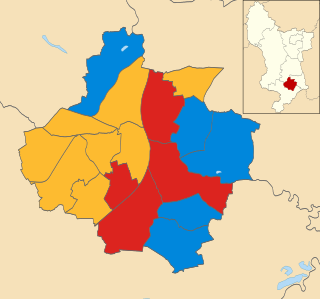
The 2006 St Albans City and District Council election took place on 4 May 2006 to elect members of St Albans District Council in Hertfordshire, England. One third of the council was up for election and the Liberal Democrats gained overall control of the council from no overall control.
The 2007 St Albans City and District Council election took place on 3 May 2007 to elect members of St Albans District Council in Hertfordshire, England. One third of the council was up for election and the Liberal Democrats lost overall control of the council to no overall control.
The 2010 St Albans City and District Council election took place on 6 May 2010 to elect members of St Albans District Council in Hertfordshire, England. One third of the council was up for election and the Liberal Democrats stayed in overall control of the council.
The 2011 Wealden District Council election took place on 5 May 2011 to elect members of Wealden District Council in East Sussex, England. The whole council was up for election and the Conservative Party stayed in overall control of the council.
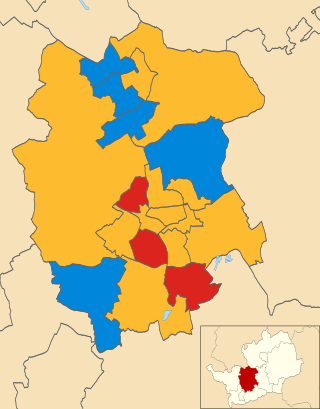
The 2012 St Albans City and District Council election took place on 3 May 2012 to elect members of St Albans District Council in Hertfordshire, England. One third of the council was up for election and the council stayed under no overall control.
The 2011 St Albans City and District Council election took place on 5 May 2011 to elect members of St Albans District Council in Hertfordshire, England. One third of the council was up for election and the Liberal Democrats lost overall control of the council to no overall control.
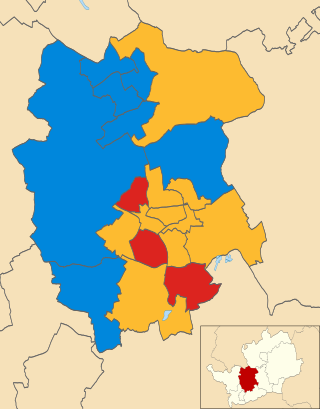
The 2014 St Albans City and District Council election took place on 22 May 2014 to elect members of St Albans District Council in Hertfordshire, England. One third of the council was up for election and the council stayed under no overall control.
The 2008 Huntingdonshire District Council election took place on 1 May 2008 to elect members of Huntingdonshire District Council in Cambridgeshire, England. One third of the council was up for election and the Conservative Party stayed in overall control of the council.
The 2010 Harlow District Council election took place on 6 May 2010 to elect members of Harlow District Council in Essex, England. One third of the council was up for election and the Conservative party stayed in overall control of the council.