2022 St Albans City and District Council election

Last updated

2022 St Albans City and District Council election
FlagOfHertfordshire.PNG
  2021 5 May 2022 (2022-05-05) 2023  

All 56 seats to St Albans City and District Council
29 seats needed for a majority
 First partySecond party
  No image wide.svg No image wide.svg
Party Liberal Democrats Conservative
Last election30 seats, 41.2%22 seats, 34.3%
Seats won504
Seat changeIncrease2.svg 20Decrease2.svg 18
Popular vote28,20814,153
Percentage47.9%24.0%
SwingIncrease2.svg 6.7%Decrease2.svg 10.3%

 Third partyFourth party
  No image wide.svg No image wide.svg
Party Green Independent
Last election1 seat, 12.0%0 seats, 1.2%
Seats won11
Seat changeSteady2.svgIncrease2.svg 1
Popular vote8,7691,457
Percentage14.9%2.5%
SwingIncrease2.svg 2.9%Increase2.svg 1.3%

St Albans UK ward map 2022.svg
Winner of each seat at the 2022 St Albans City and District Council election

Council control before election


Liberal Democrats

Council control after election


Liberal Democrats

The 2022 St Albans City and District Council election took place on 5 May 2022, to elect members of St Albans City and District Council in England. [1] It was on the same day as other local elections.

Contents

The whole council was up for election on new boundaries. [2] At the election, the Liberal Democrats retained control of the council with a greatly increased majority, while Labour were eliminated from the council entirely. [3]

Summary

Election result

2022 St Albans City and District Council election
PartyCandidatesSeatsGainsLossesNet gain/lossSeats %Votes %Votes+/−
  Liberal Democrats 5450200Increase2.svg 2089.347.928,208+6.7
  Conservative 414018Decrease2.svg 187.124.014,153–10.3
  Green 38100Steady2.svg1.814.98,769+2.9
  Independent 3110Increase2.svg 11.82.51,457+1.3
  Labour 25003Decrease2.svg 30.010.46,156–0.7
  CPA 1000Steady2.svg0.00.2127N/A
  Communist 1000Steady2.svg0.00.175N/A

Ward results

Candidates seeking re-election are marked with an asterisk (*).

Batchwood

Batchwood (3)
PartyCandidateVotes%±%
Liberal Democrats Liz Needham* 1,499 60.1
Liberal Democrats Sinéad Howland* 1,441 57.8
Liberal Democrats Jenni Murray 1,399 56.1
Labour Mal Pakenham49920.0
Labour Iain Grant49419.8
Conservative Louise Tallon46218.5
Green Danielle Durant-Taylor36914.8
Green Lucy Swift36814.8
Turnout 2,49344.34
Liberal Democrats hold Swing
Liberal Democrats gain from Labour Swing

Bernards Heath

Bernards Heath (3)
PartyCandidateVotes%±%
Liberal Democrats Helen Campbell* 1,846 68.5
Liberal Democrats Jez Levy 1,503 55.7
Liberal Democrats Mangala Patil Mead 1,326 49.2
Green Nadia Bishara76828.5
Conservative Ambrose Killen57021.1
Labour Jane Cloak33012.2
Green Stephane Farenga29410.9
Green Pam Maisey28810.7
Turnout 2,69646.65
Liberal Democrats win (new seat)

Clarence

Clarence (3)
PartyCandidateVotes%±%
Liberal Democrats Josie Madoc* 2,045 66.0
Liberal Democrats Chris White* 1,910 61.7
Liberal Democrats Mark Pedroz* 1,443 46.6
Green Matthew Fisher1,42245.9
Labour Ed Bailey46214.9
Conservative David Kaloczi43213.9
Green Gregory Riener37011.9
Green Gabriel Roberts36111.7
Turnout 3,09750.78
Liberal Democrats hold Swing

Colney Heath

Colney Heath (1)
PartyCandidateVotes%±%
Liberal Democrats Chris Brazier* 461 59.1
Conservative Graham Leonard21427.4
Green Rosalind Paul678.6
Labour Laurence Chester384.9
Turnout 78437.28
Liberal Democrats hold Swing

Cunningham

Cunningham (3)
PartyCandidateVotes%±%
Liberal Democrats Robert Donald* 1,679 72.0
Liberal Democrats Roly Everall 1,511 64.8
Liberal Democrats Geoff Harrison* 1,476 63.3
Conservative Rachael Drewitt45119.3
Labour John Paton35715.3
Green Caroline Hall34114.6
Green Phil Fletcher25911.1
Turnout 2,33141.02
Liberal Democrats hold Swing

Harpenden East

Harpenden East (3)
PartyCandidateVotes%±%
Liberal Democrats Pip Liver* 1,435 58.1
Liberal Democrats Paul de Kort* 1,434 58.1
Liberal Democrats Dason Canning 1,293 52.4
Conservative Teresa Heritage85934.8
Conservative Mary Maynard*85934.8
Conservative Kieran Mitchell70828.7
Green Ian Troughton32213.0
Labour Christopher Gillen2208.9
Turnout 2,46843.28
Liberal Democrats hold Swing
Liberal Democrats gain from Conservative Swing

Harpenden North & Rural

Harpenden North & Rural (3)
PartyCandidateVotes%±%
Liberal Democrats Ed Moore 1,610 61.3
Liberal Democrats Allison Wren* 1,500 57.1
Liberal Democrats Ayesha Rohale 1,264 48.2
Conservative Paul Cousin*86132.8
Conservative Bert Pawle*84632.2
Conservative Alexia D'Rosario76129.0
Green Stephen Folwell2439.3
Green Candy Whittome2218.4
Labour Linda Spiri1826.9
Turnout 2,62544.78
Liberal Democrats win (new seat)

Harpenden South

Harpenden South (3)
PartyCandidateVotes%±%
Conservative David Heritage* 1,152 50.1
Conservative Brian Ellis* 1,074 46.7
Conservative Mark Beashel* 1,056 46.0
Liberal Democrats Zoe Galvin1,03044.8
Liberal Democrats Maddy Liver81235.3
Liberal Democrats Melanie Priggen71130.9
Green Sally Leonard28712.5
Labour David Crew27111.8
Green Anne McQuade2028.8
Turnout 2,29841.19
Conservative hold Swing

Harpenden West

Harpenden West (3)
PartyCandidateVotes%±%
Liberal Democrats Gill Haynes 1,479 49.7
Liberal Democrats John Galvin 1,447 48.7
Liberal Democrats Fiona Gaskell 1,318 44.3
Conservative Matt Cowley1,13338.1
Conservative Julian Daly*1,09436.8
Conservative Susan Griffiths1,04235.0
Green Kyle Riley59219.9
Green Louise Schlich2568.6
Labour Philip Moura2006.7
Green Julian Wathen1364.6
Turnout 2,97349.13
Liberal Democrats gain from Conservative Swing

Hill End

Hill End (3)
PartyCandidateVotes%±%
Liberal Democrats Jamie Day* 1,798 69.9
Liberal Democrats Anthony Rowlands* 1,742 67.8
Liberal Democrats Azmat Mughal 1,467 57.1
Conservative Sudha Bharadia40515.8
Independent Peter Cook36414.2
Green Lesley Baker33613.1
Green Marianne Jordan30011.7
Labour Steven Clarke28511.1
Turnout 2,57146.12
Liberal Democrats win (new seat)

London Colney

London Colney (3)
PartyCandidateVotes%±%
Liberal Democrats Tony Lillico 704 37.4
Conservative Simon Calder 637 33.8
Liberal Democrats Guy Gampbell 596 31.6
Labour Katherine Gardner*58831.2
Conservative Sarah Tallon*58330.9
Liberal Democrats Winston Davis54228.8
Conservative Liz Winstone52327.8
Labour Jim Hopkins44023.4
Labour Andy Osborne41922.2
Green Sarah Gillhespy1719.1
Green Matthew Maddock1256.6
Turnout 1,88431.87
Liberal Democrats gain from Labour Swing
Conservative hold Swing
Liberal Democrats gain from Labour Swing

Marshalswick East & Jersey Farm

Marshalswick East & Jersey Farm (3)
PartyCandidateVotes%±%
Liberal Democrats Lorraine Kirby 1,488 55.1
Liberal Democrats Elissa Dacosta-Waldman 1,420 52.6
Liberal Democrats Raj Visram* 1,318 48.8
Conservative Lyn Bolton93434.6
Conservative Frances Leonard*91333.8
Conservative Beric Read*86932.2
Green Stephen Clough28510.6
Green James Lomas2649.8
Labour Nick Pullinger2368.7
Turnout 2,70147.77
Liberal Democrats win (new seat)

Marshalswick West

Marshalswick West (2)
PartyCandidateVotes%±%
Liberal Democrats Michael Jones 1,150 60.2
Liberal Democrats Simon Mostyn 1,103 57.7
Conservative Tom Clegg*50826.6
Conservative Don Deepthi48225.2
Green Clare Sayce20610.8
Green Rachel Timbs1628.5
Labour Anthony Nicolson1337.0
Turnout 1,91049.61
Liberal Democrats win (new seat)

Park Street

Park Street (3)
PartyCandidateVotes%±%
Liberal Democrats Syed Abidi* 1,303 50.3
Liberal Democrats John Parry 1,296 50.0
Liberal Democrats Nuala Webb 1,154 44.5
Conservative Stella Nash*95436.8
Conservative Alexandra Clark95036.6
Conservative Richard Curthoys*95036.6
Green Alison Park-Crowne2579.9
Labour Martin McGrath2489.6
Green Mark Park-Crowne1666.4
Turnout 2,59341.11
Liberal Democrats hold Swing
Liberal Democrats gain from Conservative Swing

Redbourn

Redbourn (2)
PartyCandidateVotes%±%
Independent David Mitchell* 886 49.2
Liberal Democrats Lucinda Carney 874 48.5
Conservative Victoria Mead*64135.6
Conservative Jane West34118.9
Green Dee Thomas21311.8
Labour Symon Vegro1729.6
Labour Andy Hayes1679.3
Turnout 1,80141.92
Independent hold Swing
Liberal Democrats gain from Conservative Swing

Sandridge & Wheathampstead

Sandridge & Wheathampstead (3)
PartyCandidateVotes%±%
Liberal Democrats Lynn Cunningham 1,358 48.5
Liberal Democrats Kristian Gavan 1,298 46.4
Liberal Democrats Sharon Hollingsworth 1,254 44.8
Conservative Gill Clark*1,24044.3
Conservative Claudio Duran1,12540.2
Conservative Salih Gaygusuz98435.2
Green Oliver Hitch43215.4
Labour Jon Hegerty2749.8
Turnout 2,79846.03
Liberal Democrats win (new seat)

Sopwell

Sopwell (3)
PartyCandidateVotes%±%
Liberal Democrats Sarwar Shamsher 1,440 61.9
Liberal Democrats Emma Matanle* 1,412 60.7
Liberal Democrats Muki Gorar 1,237 53.2
Labour Janet Smith55023.6
Labour Jagat Chatrath44219.0
Green Jack Easton32213.8
Conservative Heather Rench31713.6
Green Tricia Gibbons29512.7
Independent Pia Honey2078.9
Communist Mark Ewington753.2
Turnout 2,32642.79
Liberal Democrats hold Swing

St Peter's

St Peter's (3)
PartyCandidateVotes%±%
Liberal Democrats Jacqui Taylor* 1,588 65.5
Liberal Democrats Danny Clare* 1,531 63.1
Green Simon Grover* 1,478 60.9
Labour David Byatt56923.5
Conservative Georgie Callé40316.6
Conservative Paul Verity33613.9
Turnout 2,42539.56
Liberal Democrats hold Swing
Green hold Swing

St Stephen

St Stephen (3)
PartyCandidateVotes%±%
Liberal Democrats Ajanta Hilton 1,444 49.8
Liberal Democrats Giles Fry 1,400 48.3
Liberal Democrats Vladimir Jirasek 1,187 40.9
Conservative Aaron Jacob*1,14539.5
Conservative Dave Winstone1,11238.4
Conservative Joshua Varghese1,04836.2
Labour Janet Blackwell2859.8
Green Kate Bennett2639.1
Green Susana Garcia2027.0
CPA Adrian Ruffhead1274.4
Turnout 2,89944.19
Liberal Democrats gain from Conservative Swing

Verulam

Verulam (3)
PartyCandidateVotes%±%
Liberal Democrats Dawn Gamble 1,977 67.0
Liberal Democrats Edgar Hill* 1,941 65.8
Liberal Democrats Andrew Warwick-Thompson 1,705 57.8
Conservative Susan Devi83528.3
Green Veronique Corney39513.4
Green Jordan Barnes33311.3
Labour Geoff Meade2628.9
Turnout 2,95251.12
Liberal Democrats hold Swing

Related Research Articles

<span class="mw-page-title-main">St Albans City and District</span> Local authority district in England

St Albans, also known as the City and District of St Albans, is a local government district with city status in Hertfordshire, England. Its council is based in St Albans, the largest settlement in the district. The district also includes the town of Harpenden and several villages. The district borders North Hertfordshire, Welwyn Hatfield, Hertsmere, Watford, Three Rivers, Dacorum, and Central Bedfordshire.

<span class="mw-page-title-main">Southampton Test (UK Parliament constituency)</span>

Southampton Test is a constituency represented in the House of Commons of the UK Parliament since 1997 by Alan Whitehead, a member of the Labour Party.

<span class="mw-page-title-main">Romford (UK Parliament constituency)</span> Parliamentary constituency in the United Kingdom, 1885 onwards

Romford is a constituency in Greater London represented in the House of Commons of the UK Parliament since 2001 by Andrew Rosindell, a Conservative.

St Albans City and District Council elections are held three years out of every four to elect members of St Albans City and District Council in Hertfordshire, England. Since the last boundary changes in 2022 the council has comprised 56 councillors, with the district being divided into 20 wards. Elections to Hertfordshire County Council are held in the fourth year of the cycle when there are no district council elections.

<span class="mw-page-title-main">2008 St Albans City and District Council election</span>

The 2008 St Albans City and District Council election took place on 1 May 2008 to elect members of St Albans District Council in Hertfordshire, England. One third of the council was up for election and the Liberal Democrats gained overall control of the council from no overall control.

<span class="mw-page-title-main">1999 St Albans City and District Council election</span>

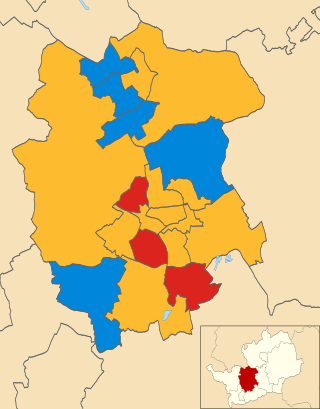
The 1999 St Albans City and District Council election took place on 6 May 1999 to elect members of St Albans City and District Council in Hertfordshire, England. The whole council was up for election with boundary changes since the last election in 1998 increasing the number of seats by 1. The Liberal Democrats lost overall control of the council to no overall control.

<span class="mw-page-title-main">2002 St Albans City and District Council election</span>

The 2002 St Albans City and District Council election took place on 2 May 2002 to elect members of St Albans District Council in Hertfordshire, England. One third of the council was up for election and the council stayed under no overall control.

<span class="mw-page-title-main">2003 St Albans City and District Council election</span>

The 2003 St Albans City and District Council election took place on 1 May 2003 to elect members of St Albans District Council in Hertfordshire, England. One third of the council was up for election and the council stayed under no overall control.

<span class="mw-page-title-main">2004 St Albans City and District Council election</span>

The 2004 St Albans City and District Council election took place on 10 June 2004 to elect members of St Albans District Council in Hertfordshire, England. One third of the council was up for election and the council stayed under no overall control.

<span class="mw-page-title-main">2007 St Albans City and District Council election</span>

The 2007 St Albans City and District Council election took place on 3 May 2007 to elect members of St Albans District Council in Hertfordshire, England. One third of the council was up for election and the Liberal Democrats lost overall control of the council to no overall control.

<span class="mw-page-title-main">2010 St Albans City and District Council election</span>

The 2010 St Albans City and District Council election took place on 6 May 2010 to elect members of St Albans District Council in Hertfordshire, England. One third of the council was up for election and the Liberal Democrats stayed in overall control of the council.

<span class="mw-page-title-main">2012 St Albans City and District Council election</span> 2012 UK local government election

The 2012 St Albans City and District Council election took place on 3 May 2012 to elect members of St Albans District Council in Hertfordshire, England. One third of the council was up for election and the council stayed under no overall control.

<span class="mw-page-title-main">2011 St Albans City and District Council election</span>

The 2011 St Albans City and District Council election took place on 5 May 2011 to elect members of St Albans District Council in Hertfordshire, England. One third of the council was up for election and the Liberal Democrats lost overall control of the council to no overall control.

<span class="mw-page-title-main">2014 St Albans City and District Council election</span> English local election

The 2014 St Albans City and District Council election took place on 22 May 2014 to elect members of St Albans District Council in Hertfordshire, England. One third of the council was up for election and the council stayed under no overall control.

<span class="mw-page-title-main">2019 St Albans City and District Council election</span> Election

The 2019 St Albans City and District Council election took place on 2 May 2019 to elect members of St Albans City and District Council in England. This was on the same day as other local elections. At the elections, the Conservatives lost control of the council

<span class="mw-page-title-main">2022 United Kingdom local elections</span> Elections to local councils and mayoralties

The 2022 United Kingdom local elections took place on Thursday 5 May 2022. These included elections for all London borough councils, for all local authorities in Wales and Scotland. Most seats in England were last up for election in 2018 and in Scotland and Wales in 2017. The elections coincided with the 2022 Northern Ireland Assembly election. In 91 cases, most of them in Wales, council seats were uncontested, each having only one candidate. Three seats in Scotland remained unfilled as no one nominated to fill them.

<span class="mw-page-title-main">2021 St Albans City and District Council election</span> Election

The 2021 St Albans City and District Council election took place on 6 May 2021, delayed by one year due to the COVID-19 pandemic, to elect members of St Albans City and District Council in England. This was on the same day as other local elections. At the elections, the Liberal Democrats achieved a majority for the first time since 2011 and took the council back from no overall control.

<span class="mw-page-title-main">2022 Westminster City Council election</span> 2022 local election in Westminster

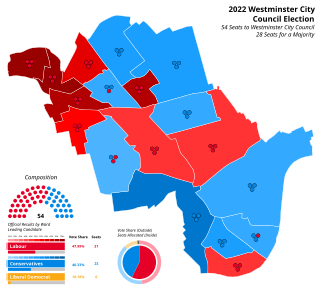
The 2022 Westminster City Council election took place on 5 May 2022. All 54 members of Westminster City Council have been elected. The elections took place alongside local elections in the other London boroughs and elections to local authorities across the United Kingdom.

<span class="mw-page-title-main">2022 St Helens Metropolitan Borough Council election</span> 2022 local election in St Helens

The 2022 St Helens Metropolitan Borough Council election took place on 5 May 2022. Due to boundary changes, all 48 councillors were elected at the same time, with the council moving to a system of all-out elections every four years. The election took place alongside other local elections across the United Kingdom.

<span class="mw-page-title-main">2023 United Kingdom local elections</span> Elections to local councils and mayoralties

The 2023 United Kingdom local elections were held on Thursday, 4 May 2023 in England and on Thursday 18 May 2023 in Northern Ireland. These included district councils, unitary authorities, and directly elected mayors in England, and included all local councils in Northern Ireland. Notably, these elections were the first to be held under the Elections Act 2022, a new voter identification law that is controversial, meaning voters were required to show photo ID when attending a polling station.

References

  1. "St Albans City and District Council". St Albans City and District Council. Retrieved 10 April 2022.
  2. "LGBCE". LGBCE . Retrieved 10 April 2022.
  3. "BBC". BBC . Retrieved 13 June 2022.