| |||||||||||||||||||||||||||||||||||||
17 of the 48 seats to Southampton City Council 25 seats needed for a majority | |||||||||||||||||||||||||||||||||||||
---|---|---|---|---|---|---|---|---|---|---|---|---|---|---|---|---|---|---|---|---|---|---|---|---|---|---|---|---|---|---|---|---|---|---|---|---|---|
| |||||||||||||||||||||||||||||||||||||
Map showing the election results. Each ward represents 1 seat | |||||||||||||||||||||||||||||||||||||
|
Elections to Southampton City Council took place on Thursday 5 May 2022, alongside nationwide local elections, alongside other local elections across the country. The seats up for election were last contested in 2018. The Labour Party regained control of the council from the Conservative Party, which it had lost at the previous year's elections. [1]
2022 Southampton City Council election | ||||||||||
---|---|---|---|---|---|---|---|---|---|---|
Party | This election | Full council | This election | |||||||
Seats | Net | Seats % | Other | Total | Total % | Votes | Votes % | +/− | ||
Labour | 13 | 3 | 76.5 | 13 | 26 | 54.2 | 26,863 | 46.7 | +8.9 | |
Conservative | 3 | 4 | 17.6 | 18 | 21 | 43.8 | 20,548 | 35.7 | –7.1 | |
Liberal Democrats | 1 | 1 | 5.9 | 0 | 1 | 2.1 | 5,197 | 9.0 | +0.5 | |
Green | 0 | 0.0 | 0 | 0 | 0.0 | 4,056 | 7.1 | –2.0 | ||
TUSC | 0 | 0.0 | 0 | 0 | 0.0 | 832 | 1.4 | +0.4 | ||
Party | Candidate | Votes | % | ±% | |
---|---|---|---|---|---|
Labour | Sarah Bogle | 1,696 | 58.7 | +12.7 | |
Conservative | Charles Perez-Storey | 751 | 26.0 | -4.6 | |
Green | Joe Cox | 241 | 8.3 | -2.1 | |
Liberal Democrats | Josh Smith | 150 | 5.2 | -1.4 | |
TUSC | Graham Henry | 52 | 1.8 | -0.2 | |
Majority | 945 | 32.7 | |||
Turnout | 2,908 | 23.32 | |||
Labour hold | Swing | ||||
Party | Candidate | Votes | % | ±% | |
---|---|---|---|---|---|
Liberal Democrats | Richard Blackman | 2,108 | 52.6 | +18.6 | |
Conservative | Neil Sahota | 1,406 | 35.1 | -9.3 | |
Labour | Christian Michael Cox | 446 | 11.1 | -4.1 | |
TUSC | Michael Marx | 51 | 1.3 | +0.7 | |
Majority | 702 | 17.5 | |||
Turnout | 4,027 | 42.65 | |||
Liberal Democrats gain from Conservative | Swing | ||||
Party | Candidate | Votes | % | ±% | |
---|---|---|---|---|---|
Labour | Toqeer Ahmed Kataria | 2,230 | 70.8 | +12.4 | |
Conservative | Pritheepal Singh Roath | 430 | 13.7 | -2.1 | |
Green | Ronald Nicholas Meldrum | 255 | 8.1 | -1.9 | |
Liberal Democrats | Amy Eve Greenwood | 178 | 5.7 | +0.6 | |
TUSC | Nicholas Philip Chaffey | 56 | 1.8 | +0.6 | |
Majority | 1,800 | 57.1 | |||
Turnout | 3,165 | 29.62 | |||
Labour hold | Swing | ||||
Party | Candidate | Votes | % | ±% | |
---|---|---|---|---|---|
Conservative | Terry Michael Streets | 1,248 | 47.1 | -8.4 | |
Labour | Andrew John Frampton | 1,097 | 41.4 | +7.7 | |
Green | Michael Charles John Mawle | 141 | 5.3 | -0.8 | |
Liberal Democrats | Nicholas McGeorge | 117 | 4.4 | +0.5 | |
TUSC | Clara Oswin Asher | 47 | 1.8 | N/A | |
Majority | 151 | 5.7 | |||
Turnout | 2,659 | 26.83 | |||
Conservative hold | Swing | ||||
Party | Candidate | Votes | % | ±% | |
---|---|---|---|---|---|
Labour | Anthony Wyatt Bunday | 1,828 | 47.4 | +16.5 | |
Conservative | Robert Craig Harwood | 1,573 | 40.8 | -8.2 | |
Green | Helen Mary Makrakis | 394 | 10.2 | -3.4 | |
TUSC | Vanessa Antonia Fileman | 61 | 1.6 | N/A | |
Majority | 255 | 6.6 | |||
Turnout | 3877 | 37.79 | +0.1 | ||
Labour gain from Conservative | Swing | ||||
Party | Candidate | Votes | % | ±% | |
---|---|---|---|---|---|
Labour | Matthew Renyard | 1,429 | 44.8 | +11.7 | |
Conservative | Paul James Patrick Nolan | 1,338 | 42.0 | -10.4 | |
Liberal Democrats | Sam Philip Chapman | 199 | 6.2 | -0.8 | |
Green | Lucy Michelle Mundell | 162 | 5.1 | +0.2 | |
TUSC | Margaret Lorna Fricker | 41 | 1.3 | -0.6 | |
Majority | 91 | ||||
Turnout | 3,187 | 31.43 | |||
Labour hold | Swing | ||||
Party | Candidate | Votes | % | ±% | |
---|---|---|---|---|---|
Labour | Stephen John Leggett | 1,989 | 57.4 | +11.7 | |
Conservative | Michaela Dowse | 903 | 26.1 | -5.7 | |
Green | Lindsi Bluemel | 261 | 7.5 | -3.6 | |
Liberal Democrats | Andrew Thomas Beal | 238 | 6.9 | -0.8 | |
TUSC | Catherine Bernadette Clarke | 74 | 2.1 | +0.6 | |
Majority | 1086 | ||||
Turnout | 3,478 | 31.11 | |||
Labour hold | Swing | ||||
Party | Candidate | Votes | % | ±% | |
---|---|---|---|---|---|
Conservative | Valerie Laurent | 1,645 | 50.4 | -5.9 | |
Labour | Paul Robert Kenny | 1,201 | 36.8 | +2.8 | |
Green | Christopher Francis Bluemel | 208 | 6.4 | +0.3 | |
Liberal Democrats | Benjamin Button Curd | 161 | 4.9 | +1.6 | |
TUSC | Levi Joshua Wellman | 50 | 1.5 | N/A | |
Majority | 444 | ||||
Turnout | 3,278 | 31.55 | |||
Conservative hold | Swing | ||||
Party | Candidate | Votes | % | ±% | |
---|---|---|---|---|---|
Labour | David Furnell | 1,622 | 46.9 | +10.7 | |
Conservative | Stephen Graham Patrick Galton | 1,511 | 43.6 | -6.1 | |
Green | Jonathan Simon Bean | 281 | 8.1 | -0.9 | |
TUSC | Donna Dee | 48 | 1.4 | N/A | |
Majority | 111 | 3.2 | |||
Turnout | 3,484 | 31.63 | |||
Labour gain from Conservative | Swing | ||||
Party | Candidate | Votes | % | ±% | |
---|---|---|---|---|---|
Labour | Eamonn Francis Keogh | 2,046 | 54.3 | +12.1 | |
Conservative | Thomas James Bell | 1,339 | 35.5 | -12.0 | |
Liberal Democrats | Robert William Naish | 187 | 5.0 | +0.9 | |
Green | Rosanna Elizabeth Newey | 169 | 4.5 | -0.3 | |
TUSC | Bevis Fenner | 30 | 0.8 | -0.1 | |
Majority | 707 | 18.8 | |||
Turnout | 3,780 | 36.00 | |||
Labour gain from Conservative | Swing | ||||
Party | Candidate | Votes | % | ±% | |
---|---|---|---|---|---|
Labour | Lisa Mitchell | 1,749 | 47.4 | +11.0 | |
Green | Katherine Jane Barbour | 1,435 | 38.9 | +11.8 | |
Conservative | Wai Kee Cheng | 456 | 12.4 | -4.4 | |
TUSC | Derek Anthony Twine | 47 | 1.3 | +0.3 | |
Majority | 314 | 8.5 | |||
Turnout | 3,704 | 39.56 | |||
Labour hold | Swing | ||||
Party | Candidate | Votes | % | ±% | |
---|---|---|---|---|---|
Labour | Katherine Lipton McEwing | 1,320 | 45.3 | +1.1 | |
Conservative | David Austin Peter Smith | 1,243 | 42.7 | -4.4 | |
Liberal Democrats | Simon David Stokes | 157 | 5.3 | +2.3 | |
Green | Angela Mary Cotton | 139 | 4.8 | +1.3 | |
TUSC | Peter Michael Wyatt | 44 | 1.5 | +0.1 | |
Majority | 77 | 2.6 | |||
Turnout | 2,913 | 26.60 | |||
Labour hold | Swing | ||||
Party | Candidate | Votes | % | ±% | |
---|---|---|---|---|---|
Labour | Hannah Katherine Amy Coombes | 2,237 | 52.7 | +9.8 | |
Labour | Alexander Winning | 1,852 | 43.6 | +0.7 | |
Conservative | Andrew Hetherton | 1,592 | 37.5 | +0.3 | |
Conservative | Simon Dominic Howell | 1,336 | 31.5 | -5.7 | |
Liberal Democrats | Sarah Louise Wood | 557 | 13.1 | +3.3 | |
Liberal Democrats | Colin Stuart McDougall | 391 | 9.2 | -0.6 | |
TUSC | Andrew Howe | 94 | 2.2 | +1.2 | |
Turnout | 4,264 | 40.86 | |||
Labour hold | |||||
Labour hold | |||||
Party | Candidate | Votes | % | ±% | |
---|---|---|---|---|---|
Conservative | Marley George Guthrie | 1,660 | 50.0 | -11.4 | |
Labour | Carol Anne Cunio | 1,283 | 38.7 | +10.5 | |
Green | Charlotte Beth Cutt | 180 | 5.4 | -0.2 | |
Liberal Democrats | Sharon Pamela Hopkins | 165 | 5.0 | +1.4 | |
TUSC | Declan Peter Clune | 31 | 0.9 | -0.9 | |
Majority | 377 | 11.4 | |||
Turnout | 3,333 | 31.40 | |||
Conservative hold | Swing | ||||
Party | Candidate | Votes | % | ±% | |
---|---|---|---|---|---|
Labour | Lorna Fielker | 1,233 | 49.4 | +9.9 | |
Conservative | Calvin Smith | 801 | 32.1 | -8.2 | |
Liberal Democrats | Thomas Gravatt | 424 | 17.0 | +9.5 | |
TUSC | Neil Kelly | 38 | 1.5 | ±0.0 | |
Majority | 432 | 17.3 | |||
Turnout | 2,496 | 42.65 | |||
Labour gain from Conservative | Swing | ||||
Party | Candidate | Votes | % | ±% | |
---|---|---|---|---|---|
Labour | Susan Jane Blatchford | 1,605 | 47.7 | +9.6 | |
Conservative | Jaden William Beaurain | 1,316 | 39.1 | -9.0 | |
Green | Clive George Hillman | 190 | 5.6 | -0.8 | |
Liberal Democrats | Colin Anthony Bleach | 165 | 4.9 | +0.4 | |
TUSC | Susan Anne Atkin | 68 | 2.0 | -0.2 | |
Majority | 289 | 8.6 | |||
Turnout | 3,364 | 30.2 | +0.9 | ||
Labour hold | Swing | ||||
Hampshire County Council (HCC) is the upper-tier local authority for the non-metropolitan county of Hampshire in England. The council was created in 1889. The county council provides county-level services to eleven of the thirteen districts geographically located within the ceremonial county of Hampshire. The county council acts as the upper tier of local government to approximately 1.4 million people. It is one of 21 county councils in England.
The Borough of Eastleigh is a local government district with borough status in Hampshire, England. It is named after its main town of Eastleigh, where the council is based. The borough also contains the town of Hedge End along with several villages, many of which form part of the South Hampshire urban area.
Southampton City Council is the local authority of the city of Southampton. It is a unitary authority, having the powers of a non-metropolitan county and district council combined. It provides a full range of local government services including council tax billing, libraries, social services, processing planning applications, waste collection and disposal, and it is a local education authority. The council uses a leader and cabinet structure. Labour has been in control of the council since 2022.
Southampton, Itchen is a constituency represented in the House of Commons of the UK Parliament since 2015 by Royston Smith, a Conservative member of parliament. Discounting the Speaker returned in the early 1970s in two elections, local voters have elected the MP from only two parties alternately for various periods, with one party reaffiliation (defection) between elections when the Labour Party split in the 1980s.
Southampton City Council elections are held three out of every four years to elect members of Southampton City Council, the local authority for the city of Southampton in Hampshire, England. Since 1 April 1997 Southampton has been a unitary authority responsible for all local government functions; prior to this it was a non-metropolitan district beneath Hampshire County Council.
Trade Unionist and Socialist Coalition (TUSC) is a socialist electoral alliance in Britain. It was originally launched for the 2010 general election.
The 1998 Southampton Council election took place on 7 May 1998 to elect members of Southampton Unitary Council in Hampshire, England. One third of the council was up for election and the Labour party stayed in overall control of the council.
The 1999 Southampton Council election took place on 6 May 1999 to elect members of Southampton Unitary Council in Hampshire, England. One third of the council was up for election and the Labour party stayed in overall control of the council.
The 2000 Southampton Council election took place on 4 May 2000 to elect members of Southampton Unitary Council in Hampshire, England. One third of the council was up for election and the Labour Party lost overall control of the council to no overall control.
The 2006 Southampton Council election took place on 4 May 2006 to elect members of Southampton Unitary Council in Hampshire, England. One third of the council was up for election and the council stayed under no overall control.
The 2007 Southampton Council election took place on 3 May 2007 to elect members of Southampton Unitary Council in Hampshire, England. One third of the council was up for election and the council stayed under no overall control.
The 2008 Southampton Council election took place on 1 May 2008 to elect members of Southampton Unitary Council in Hampshire, England. One third of the council was up for election and the Conservative Party gained overall control of the council from no overall control.
The 2010 Southampton Council election took place on 6 May 2010 to elect members of Southampton Unitary Council in Hampshire, England. One third of the council was up for election and the Conservative Party stayed in overall control of the council.
Elections to Southampton City Council took place on Thursday 3 May 2018, alongside nationwide local elections, alongside other local elections across the country. The elections saw no changes in the overall composition of the council, however saw seats being exchanged. The Labour Party lost Bitterne, Millbrook and Peartree to the Conservative party while the Conservatives lost Freemantle, Portswood and Swaythling to Labour. This led to the Labour leader of the council, Simon Letts, and the leader of the Conservative group in the city, Jeremy Moulton, losing their seats.
Elections to Southampton City Council took place on Thursday 2 May 2019, alongside other local elections across the country. The Labour Party held a narrow majority of two at the last election and the seats contested in this election were last contested in 2015. Labour were defending 6 seats, the Conservatives were defending 8, whilst independent councillors, who held two seats, were not standing re-elections. Following a by-election in the Coxford ward where Labour gained the seat formerly held by an independent.
The 2021 Southampton City Council election took place in on 6 May 2021, on the same day as other local elections, to elect members of Southampton City Council. The election was originally due to take place in May 2020, to elect to the seats of councillors last elected in 2016, but was postponed due to the COVID-19 pandemic.
The 2022 Birmingham City Council election took place on 5 May 2022, with all 101 council seats up for election across 37 single-member and 32 two-member wards. The election was held alongside other local elections across Great Britain and town council elections in Sutton Coldfield.
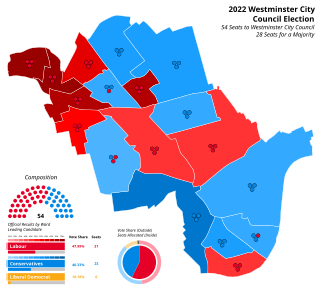
The 2022 Westminster City Council election took place on 5 May 2022. All 54 members of Westminster City Council have been elected. The elections took place alongside local elections in the other London boroughs and elections to local authorities across the United Kingdom.
The 2022 Oldham Metropolitan Borough Council election took place on 5 May 2022. One third—20 out of 60—of councillors on Oldham Council was elected. The election took place alongside other local elections across the United Kingdom.
The 2023 United Kingdom local elections were held on Thursday, 4 May 2023 in England and on Thursday 18 May 2023 in Northern Ireland. These included district councils, unitary authorities, and directly elected mayors in England, and included all local councils in Northern Ireland. Notably, these elections were the first to be held under the Elections Act 2022, a new voter identification law that is controversial, meaning voters were required to show photo ID when attending a polling station.