| |||||||||||||||||||||||||||||
14 of 38 seats to Havant Borough Council 20 seats needed for a majority | |||||||||||||||||||||||||||||
---|---|---|---|---|---|---|---|---|---|---|---|---|---|---|---|---|---|---|---|---|---|---|---|---|---|---|---|---|---|
| |||||||||||||||||||||||||||||
Results by Ward | |||||||||||||||||||||||||||||
|
The 2006 Havant Borough Council election took place on 4 May 2006 to elect members of Havant Borough Council in Hampshire, England. One third of the council was up for election and the Conservative Party stayed in overall control of the council. [1]
After the election, the composition of the council was:
After the last election in 2004 the Conservatives had 27 seats, compared to 6 for Labour and 5 for the Liberal Democrats. [3] However, in 2005 a Liberal Democrat councillor for Hart Plain, Ron Purkis, defected to the Conservatives. [4]
The Conservatives increased their majority on the council to hold 30 of the 38 seats on the council after getting a swing in their favour. [5] Labour lost 2 seats in Leigh Park, with sitting councillors Ralph Cousins and Barry Gardner losing to the Conservatives and Liberal Democrats respectively. [5] Overall turnout at the election was 33.5%. [6]
Following the election Conservative David Gillett remained as leader of the council after surviving a leadership challenge within the Conservative group from David Guest by 4 votes. [7]
Party | Seats | Gains | Losses | Net gain/loss | Seats % | Votes % | Votes | +/− | |
---|---|---|---|---|---|---|---|---|---|
Conservative | 11 | 2 | 0 | +2 | 78.6 | 53.8 | 16,178 | +2.3% | |
Liberal Democrats | 1 | 1 | 1 | 0 | 7.1 | 24.1 | 7,234 | -2.4% | |
Labour | 2 | 0 | 2 | -2 | 14.3 | 13.3 | 3,989 | -1.2% | |
Green | 0 | 0 | 0 | 0 | 0 | 7.3 | 2,187 | +1.8% | |
UKIP | 0 | 0 | 0 | 0 | 0 | 0.9 | 272 | +0.9% | |
English Democrat | 0 | 0 | 0 | 0 | 0 | 0.6 | 190 | +0.6% | |
Party | Candidate | Votes | % | ±% | |
---|---|---|---|---|---|
Conservative | George Fairhurst | 465 | 44.0 | -4.1 | |
Labour | Ralph Cousins | 284 | 26.9 | -1.8 | |
UKIP | Stephen Harris | 164 | 15.5 | +15.5 | |
Liberal Democrats | Michael Ponsonby | 143 | 13.5 | -9.7 | |
Majority | 181 | 17.1 | -2.2 | ||
Turnout | 1,056 | 24.8 | +2.4 | ||
Conservative gain from Labour | Swing | ||||
Party | Candidate | Votes | % | ±% | |
---|---|---|---|---|---|
Labour | June Hanan | 346 | 31.9 | -2.3 | |
Liberal Democrats | Raymond Cobbett | 328 | 30.2 | +12.4 | |
Conservative | Ronald Purkis | 275 | 25.3 | -11.3 | |
Green | Louise Palmer | 136 | 12.5 | +1.1 | |
Majority | 18 | 1.7 | |||
Turnout | 1,085 | 23.1 | +1.2 | ||
Labour hold | Swing | ||||
Party | Candidate | Votes | % | ±% | |
---|---|---|---|---|---|
Conservative | Jennifer Wride | 1,321 | 46.1 | +3.2 | |
Liberal Democrats | Faith Ponsonby | 1,081 | 37.7 | -3.8 | |
English Democrat | George Herbert | 190 | 6.6 | +6.6 | |
Labour | Anne Edwards | 178 | 6.2 | -3.3 | |
Green | Terry Mitchell | 96 | 3.3 | -2.8 | |
Majority | 240 | 8.4 | +6.9 | ||
Turnout | 2,866 | 41.6 | -0.4 | ||
Conservative gain from Liberal Democrats | Swing | ||||
Party | Candidate | Votes | % | ±% | |
---|---|---|---|---|---|
Liberal Democrats | Susan Stocker | 608 | 46.2 | +21.0 | |
Labour | Barry Gardner | 479 | 36.4 | -12.6 | |
Conservative | Thelma Carpenter | 228 | 17.3 | -8.6 | |
Majority | 129 | 9.8 | |||
Turnout | 1,315 | 27.2 | +4.6 | ||
Liberal Democrats gain from Labour | Swing | ||||
Party | Candidate | Votes | % | ±% | |
---|---|---|---|---|---|
Conservative | Anthony Briggs | 1,359 | 60.5 | -1.8 | |
Liberal Democrats | John Jacobs | 458 | 20.4 | -5.4 | |
Green | Ann Gleed | 259 | 11.5 | +11.5 | |
Labour | Kenneth Monks | 170 | 7.6 | -4.4 | |
Majority | 901 | 40.1 | +3.6 | ||
Turnout | 2,246 | 31.2 | -4.4 | ||
Conservative hold | Swing | ||||
Party | Candidate | Votes | % | ±% | |
---|---|---|---|---|---|
Conservative | David Gillett | 2,071 | 59.2 | -1.1 | |
Liberal Democrats | Hugh Benzie | 949 | 27.1 | +3.1 | |
Green | Mary Youle | 262 | 7.5 | +1.7 | |
Labour | Derek Smith | 218 | 6.2 | -3.7 | |
Majority | 1,122 | 32.1 | -4.2 | ||
Turnout | 3,500 | 45.8 | -1.8 | ||
Conservative hold | Swing | ||||
Party | Candidate | Votes | % | ±% | |
---|---|---|---|---|---|
Conservative | Michael Cheshire | 1,089 | 48.2 | ||
Liberal Democrats | Ann Bazley | 880 | 39.0 | ||
Labour | Kim Vassallo | 170 | 7.5 | ||
Green | Barry Gleed | 119 | 5.3 | ||
Majority | 209 | 9.2 | |||
Turnout | 2,258 | 31.2 | -1.8 | ||
Conservative hold | Swing | ||||
Party | Candidate | Votes | % | ±% | |
---|---|---|---|---|---|
Conservative | John Smith | 1,567 | 63.1 | ||
Labour | Sheila Mealy | 344 | 13.8 | ||
Liberal Democrats | Margaret Causer | 337 | 13.6 | ||
Green | Gillian Leek | 236 | 9.5 | ||
Majority | 1,223 | 49.3 | |||
Turnout | 2,484 | 35.0 | +0.5 | ||
Conservative hold | Swing | ||||
Party | Candidate | Votes | % | ±% | |
---|---|---|---|---|---|
Conservative | Francis Pearce | 1,848 | 68.1 | +4.1 | |
Liberal Democrats | Janis Shawashi | 364 | 13.4 | -3.0 | |
Labour | Colin Blunden | 260 | 9.6 | -1.9 | |
Green | Susan Dawes | 243 | 9.0 | +0.8 | |
Majority | 1,484 | 54.7 | +7.2 | ||
Turnout | 2,715 | 39.8 | +0.2 | ||
Conservative hold | Swing | ||||
Party | Candidate | Votes | % | ±% | |
---|---|---|---|---|---|
Conservative | Gwen Blackett | 1,507 | 63.5 | +14.5 | |
Liberal Democrats | Stephen Marshall | 332 | 14.0 | +3.2 | |
Labour | Nicola Potts | 283 | 11.9 | -0.5 | |
Green | Julie Blenkharn | 250 | 10.5 | +10.5 | |
Majority | 1,175 | 49.5 | +28.2 | ||
Turnout | 2,372 | 33.1 | -2.2 | ||
Conservative hold | Swing | ||||
Party | Candidate | Votes | % | ±% | |
---|---|---|---|---|---|
Conservative | Jacqueline Branson | 1,574 | 52.5 | -1.7 | |
Liberal Democrats | Jane Briggs | 789 | 26.3 | -0.1 | |
Green | Timothy Dawes | 391 | 13.0 | +2.3 | |
Labour | Frederick Barnes | 245 | 8.2 | -0.5 | |
Majority | 785 | 26.2 | -1.6 | ||
Turnout | 2,999 | 43.7 | -0.8 | ||
Conservative hold | Swing | ||||
Party | Candidate | Votes | % | ±% | |
---|---|---|---|---|---|
Conservative | Olwyn Kennedy | 955 | 54.0 | +4.1 | |
Labour | Barry Steel | 335 | 19.0 | +1.0 | |
Liberal Democrats | Susan Pook | 282 | 16.0 | -6.0 | |
Green | Wendy Smith | 195 | 11.0 | +0.8 | |
Majority | 620 | 35.1 | +7.2 | ||
Turnout | 1,767 | 24.5 | -0.5 | ||
Conservative hold | Swing | ||||
Party | Candidate | Votes | % | ±% | |
---|---|---|---|---|---|
Labour | Richard Brown | 369 | 42.4 | +2.3 | |
Conservative | Richard Galloway | 236 | 27.1 | -6.9 | |
Liberal Democrats | Jennifer Moore-Blunt | 158 | 18.1 | -7.8 | |
UKIP | Brian Hines | 108 | 12.4 | +12.4 | |
Majority | 133 | 15.3 | +9.1 | ||
Turnout | 871 | 19.6 | +2.3 | ||
Labour hold | Swing | ||||
Party | Candidate | Votes | % | ±% | |
---|---|---|---|---|---|
Conservative | Wendy Brown | 1,683 | 66.9 | +8.4 | |
Liberal Democrats | Michael Bolt | 525 | 20.9 | -1.2 | |
Labour | Margaret Beauvoison | 308 | 12.2 | +1.4 | |
Majority | 1,158 | 46.0 | +9.5 | ||
Turnout | 2,516 | 33.9 | -4.0 | ||
Conservative hold | Swing | ||||
A by-election was held in Battins ward on 2 November 2006 after the death of Conservative councillor Jane Rayner. [9] The seat was gained for the Liberal Democrats by Faith Ponsonby with a majority of 137 votes. [10]
Party | Candidate | Votes | % | ±% | |
---|---|---|---|---|---|
Liberal Democrats | Faith Ponsonby | 401 | 41.9 | +11.7 | |
Conservative | Wendy Osgood | 264 | 27.6 | +2.3 | |
Labour | Ralph Cousins | 236 | 24.7 | -7.2 | |
Green | Louise Palmer | 55 | 5.8 | -6.7 | |
Majority | 137 | 14.3 | |||
Turnout | 956 | 20.3 | -2.8 | ||
Liberal Democrats gain from Conservative | Swing | ||||
A by-election was held in Hart Plain ward on 30 November 2006 after Liberal Democrat councillor Tricia Pearce resigned from the council. [9] Conservative Elaine Shimbart gained the seat from the Liberal Democrats by a majority of 246 votes. [9]
Party | Candidate | Votes | % | ±% | |
---|---|---|---|---|---|
Conservative | Elaine Shimbart | 839 | 55.3 | +7.1 | |
Liberal Democrats | John Jacobs | 593 | 39.1 | +0.1 | |
Labour | Kenneth Monks | 84 | 5.6 | -1.9 | |
Majority | 246 | 16.2 | +6.9 | ||
Turnout | 1,516 | 21.8 | -9.4 | ||
Conservative gain from Liberal Democrats | Swing | ||||
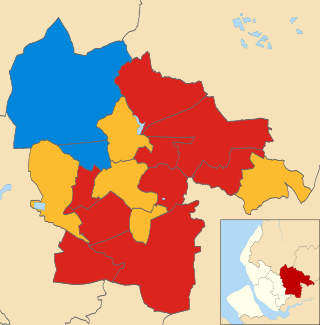
The 2008 St Helens Metropolitan Borough Council election took place on 1 May 2008 to elect members of St Helens Metropolitan Borough Council in Merseyside, England. One third of the council was up for election and the council stayed under no overall control.
The 1999 Southend-on-Sea Council election took place on 6 May 1999 to elect members of Southend-on-Sea Unitary Council in Essex, England. One third of the council was up for election and the council stayed under no overall control.
The 2006 Solihull Metropolitan Borough Council election took place on 4 May 2006 to elect members of Solihull Metropolitan Borough Council in the West Midlands, England. One third of the council was up for election and the Conservative Party stayed in overall control of the council.
The 2007 Solihull Metropolitan Borough Council election took place on 4 May 2007 to elect members of Solihull Metropolitan Borough Council in the West Midlands, England. One third of the council was up for election and the Conservative Party lost overall control of the council to no overall control.
The 2006 Pendle Borough Council election took place on 4 May 2006 to elect members of Pendle Borough Council in Lancashire, England. One third of the council was up for election and the Liberal Democrats stayed in overall control of the council.
The 2006 Hertsmere Borough Council election took place on 4 May 2006 to elect members of Hertsmere Borough Council in Hertfordshire, England. One third of the council was up for election and the Conservative Party stayed in overall control of the council.
The 2004 Colchester Borough Council election took place on 10 June 2004 to elect members of Colchester Borough Council in Essex, England. This was the same day as the other 2004 United Kingdom local elections and as the 2004 European Parliament Elections. One third of the seats were up for election and the council stayed under no overall control.
The 2012 Pendle Borough Council election took place on 3 May 2012 to elect members of Pendle Borough Council in Lancashire, England. One third of the council was up for election and the council stayed under no overall control.
The 2014 Pendle Borough Council election took place on 22 May 2014 to elect members of Pendle Borough Council in Lancashire, England. One third of the council was up for election and the council stayed under no overall control.
The 2002 Havant Borough Council election took place on 2 May 2002 to elect members of Havant Borough Council in Hampshire, England. The whole council was up for election after boundary changes reduced the number of seats by 4. The Conservative Party gained overall control of the council from no overall control.
The 2004 Havant Borough Council election took place on 10 June 2004 to elect members of Havant Borough Council in Hampshire, England. One third of the council was up for election and the Conservative Party stayed in overall control of the council.
The 2007 Havant Borough Council election took place on 3 May 2007 to elect members of Havant Borough Council in Hampshire, England. One third of the council was up for election and the Conservative Party stayed in overall control of the council.
The 2008 Havant Borough Council election took place on 1 May 2008 to elect members of Havant Borough Council in Hampshire, England. One third of the council was up for election and the Conservative Party stayed in overall control of the council.
The 2010 Havant Borough Council election took place on 6 May 2010 to elect members of Havant Borough Council in Hampshire, England. One third of the council was up for election and the Conservative Party stayed in overall control of the council.
The 2011 Havant Borough Council election took place on 5 May 2011 to elect members of Havant Borough Council in Hampshire, England. One third of the council was up for election and the Conservative Party stayed in overall control of the council.
The 2012 Havant Borough Council election took place on 3 May 2012 to elect members of Havant Borough Council in Hampshire, England. One third of the council was up for election and the Conservative Party stayed in overall control of the council.
The 2014 Havant Borough Council election took place on 22 May 2014 to elect members of Havant Borough Council in Hampshire, England. One third of the council was up for election and the Conservative Party stayed in overall control of the council.
The 2007 Rother District Council election took place on 3 May 2007 to elect members of Rother District Council in East Sussex, England. The whole council was up for election and the Conservative Party stayed in overall control of the council.
The 2014 Brent London Borough Council election took place on 22 May 2014 to elect members of Brent London Borough Council in London, England. The whole council was up for election and the Labour Party stayed in overall control of the council.
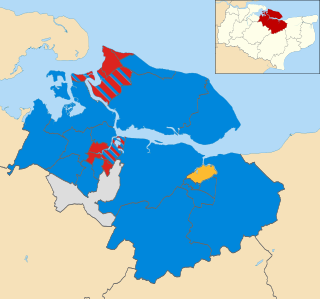
The 2011 Swale Borough Council election took place on 5 May 2011 to elect members of Swale Borough Council in Kent, England. The whole council was up for election and the Conservative Party stayed in overall control of the council.