| |||||||||||||||||||||||||||||||||||||
All 54 seats to Basingstoke and Deane Borough Council 28 seats needed for a majority | |||||||||||||||||||||||||||||||||||||
---|---|---|---|---|---|---|---|---|---|---|---|---|---|---|---|---|---|---|---|---|---|---|---|---|---|---|---|---|---|---|---|---|---|---|---|---|---|
| |||||||||||||||||||||||||||||||||||||
Map of the results | |||||||||||||||||||||||||||||||||||||
|
Elections to Basingstoke and Deane Borough Council took place on 6 May 2021 as part of the 2021 United Kingdom local elections. [1] They took place at the same time as the elections for Hampshire County Council and the Hampshire Police and Crime Commissioner. [2]
Whilst an election for the County Council had already been planned, District Council Elections were delayed due to the ongoing COVID-19 pandemic, meaning that they are due to be held at the same time as the Hampshire County Council Elections. [3]
The Conservatives won 12 seats at the previous election, with Labour and the Liberal Democrats winning 4 each. Subsequent to the 2019 election, initially nine former Labour Councillors joined with existing independent councillors to form the Basingstoke & Deane Independent Group, [4] which by May 2021 had 10 borough councillors, sitting as part of The Independent Forum alongside an independent. [5] Alongside the Basingstoke & Deane Independents, the newly founded county-wide Hampshire Independents are also standing several candidates.
The Statement of persons nominated was revealed on Friday 9 April 2021. [6]
The Conservatives won 33 seats across the district, whilst Labour won 10, the Liberal Democrats and Basingstoke & Deane Independents won 5 seats each, and a non-affiliated independent won a seat. [7]
Party | Seats | Gains | Losses | Net gain/loss | Seats % | Votes % | Votes | +/− | |
---|---|---|---|---|---|---|---|---|---|
Conservative | 33 | 0 | 0 | 61.1 | 48.8 | 61,992 | |||
Labour | 10 | 0 | 0 | 11 | 18.5 | 19.4 | 24,677 | ||
Liberal Democrats | 5 | 0 | 0 | 2 | 9.3 | 18.1 | 22,925 | ||
B&D Independents | 5 | 0 | 0 | 5 | 9.3 | 6.1 | 7,800 | ||
Independent | 1 | 0 | 0 | 1.9 | 2.3 | 2,903 | |||
Hampshire Ind. | 0 | 0 | 0 | 0.0 | 3.7 | 4,681 | |||
Green | 0 | 0 | 0 | 0.0 | 1.2 | 1,461 | |||
Women's Equality | 0 | 0 | 0 | 0.0 | 0.3 | 422 | |||
TUSC | 0 | 0 | 0 | 0.0 | 0.1 | 129 |
Party | Candidate | Votes | % | ±% | |
---|---|---|---|---|---|
Conservative | Sven Howard Godesen | 2,207 | 63.8 | ||
Conservative | Onnalee Virginia Cubitt | 2,118 | 61.2 | ||
Conservative | Mark Beresford Ruffell | 1,960 | 56.6 | ||
Liberal Democrats | Richard Mark Lilleker | 675 | 19.5 | ||
Liberal Democrats | James Anthony Kennan | 624 | 18.0 | ||
Labour | Beth Lowe | 623 | 18.0 | ||
Hampshire Independents | Anna Moynihan | 467 | 13.5 | ||
Majority | |||||
Turnout | 3,461 | ||||
Conservative win (new seat) | |||||
Conservative win (new seat) |
Party | Candidate | Votes | % | ±% | |
---|---|---|---|---|---|
Conservative | Nick Robinson | 1,426 | 53.1 | ||
B&D Independents | Chris Tomblin | 1,259 | 46.9 | ||
Conservative | Simon Heelum Mahaffey | 1,142 | 42.5 | ||
Conservative | Nalin Mahinda Jayawardena | 1,098 | 40.9 | ||
Liberal Democrats | Mark Edmund Scott | 649 | 24.2 | ||
Labour | Lydia Massey | 475 | 17.7 | ||
Hampshire Independents | Christine Heath | 428 | 15.9 | ||
Majority | |||||
Turnout | 2,686 | ||||
Conservative win (new seat) | |||||
B&D Independents win (new seat) | |||||
Conservative win (new seat) |
Party | Candidate | Votes | % | ±% | |
---|---|---|---|---|---|
Liberal Democrats | Andy Konieczko | 868 | 35.7 | ||
Labour | Andy McCormick | 824 | 33.9 | ||
Liberal Democrats | Andrea Karen Bowes | 725 | 29.8 | ||
Conservative | Simon Leigh Carr | 665 | 27.3 | ||
Labour | Kim Rosemarie Taylor | 647 | 26.6 | ||
Liberal Democrats | Peter Roy Hird Whitaker | 614 | 25.2 | ||
Labour | Stephen John Rolfe | 589 | 24.2 | ||
Conservative | William Damian Stuart Rouse | 569 | 23.4 | ||
Conservative | Praveen Singh | 509 | 20.9 | ||
Hampshire Independents | Alan Harvey Stone | 237 | 9.7 | ||
TUSC | Ben McDonnell | 66 | 2.7 | ||
Majority | |||||
Turnout | 2,434 | ||||
Liberal Democrats win (new seat) | |||||
Labour win (new seat) | |||||
Liberal Democrats win (new seat) |
Party | Candidate | Votes | % | ±% | |
---|---|---|---|---|---|
Conservative | Arun Mummalaneni | 945 | 36.7 | ||
Conservative | Sam Jeans | 860 | 33.4 | ||
Labour | Michael Howard-Sorrell | 806 | 31.3 | ||
Labour | Simon James Martin | 774 | 30.0 | ||
Labour | Julie Katherine Pierce | 727 | 28.2 | ||
Conservative | Edward Michael Norman | 666 | 25.8 | ||
Liberal Democrats | Ryan James Hickling | 631 | 24.5 | ||
Liberal Democrats | Francesca Delfina Maritan | 512 | 19.9 | ||
Liberal Democrats | Scott Richard Lawrence | 461 | 17.9 | ||
Hampshire Independents | Stan Tennison | 301 | 11.7 | ||
Majority | 85 | ||||
Turnout | 2,577 | ||||
Conservative win (new seat) | |||||
Labour win (new seat) |
Party | Candidate | Votes | % | ±% | |
---|---|---|---|---|---|
Conservative | Laura Jane Edwards | 1,711 | 64.2 | ||
Conservative | Paul Edward Miller | 1,478 | 55.5 | ||
Conservative | Jenny Vaux | 1,335 | 50.1 | ||
Green | Jonathan Edward Jenkin | 551 | 20.7 | ||
Independent | Jo Walke | 532 | 20.0 | ||
Labour | Maria Ines French | 432 | 16.2 | ||
Liberal Democrats | Stephen David Whitechurch | 304 | 11.4 | ||
Labour | Nigel Wooldridge | 303 | 11.4 | ||
Green | Richard John Musson | 230 | 8.6 | ||
Green | Stephen Murray Philpotts | 206 | 7.7 | ||
Hampshire Independents | Dave Watson | 197 | 7.4 | ||
Majority | |||||
Turnout | 2,664 | ||||
Conservative win (new seat) | |||||
Conservative win (new seat) |
Party | Candidate | Votes | % | ±% | |
---|---|---|---|---|---|
Liberal Democrats | Ronald John Hussey | 1,459 | 55.2 | ||
Liberal Democrats | James Gavin | 1,312 | 49.6 | ||
Liberal Democrats | John Gavin Neil McKay | 1,211 | 45.8 | ||
Conservative | Effie Grant | 565 | 21.4 | ||
Conservative | Seb Courtois | 562 | 21.2 | ||
Conservative | Steve Vaux | 526 | 19.9 | ||
Labour | Kieran James Kerswell | 443 | 16.7 | ||
Women's Equality | Priya Ishwari Brown | 422 | 16.0 | ||
Labour | Andrew Robert Wilson | 313 | 11.8 | ||
Hampshire Independents | Seem Alsasa | 148 | 5.6 | ||
Majority | |||||
Turnout | 2,645 | ||||
Liberal Democrats win (new seat) | |||||
Liberal Democrats win (new seat) |
Party | Candidate | Votes | % | ±% | |
---|---|---|---|---|---|
Conservative | Graham Falconer | 2,007 | 66.5 | ||
Conservative | John Ricahrd Izett | 1,954 | 64.7 | ||
Conservative | Samuel David Carr | 1,635 | 54.1 | ||
Liberal Democrats | Pauleen Malone | 897 | 29.7 | ||
Liberal Democrats | Linda Rosemary Stepney | 651 | 21.6 | ||
Labour | Robert George Thomas | 544 | 18.0 | ||
Majority | |||||
Turnout | 3,020 | ||||
Conservative win (new seat) | |||||
Conservative win (new seat) |
Party | Candidate | Votes | % | ±% | |
---|---|---|---|---|---|
Conservative | Rebecca Louise Bean | 1,299 | 51.6 | ||
Conservative | Dan Putty | 1,261 | 50.1 | ||
Conservative | Samir Sureshchandra Kotecha | 918 | 36.5 | ||
Labour | Trish Case | 682 | 27.1 | ||
Labour | Tom Cusack | 648 | 25.7 | ||
Liberal Democrats | Ted Blackmore-Squires | 586 | 23.3 | ||
Hampshire Independents | Spencer Cleary | 538 | 21.4 | ||
Majority | |||||
Turnout | 2,518 | ||||
Conservative win (new seat) | |||||
Conservative win (new seat) |
Party | Candidate | Votes | % | ±% | |
---|---|---|---|---|---|
Conservative | Richard Court | 1,668 | 55.1 | ||
Conservative | Peter Aji | 1,387 | 45.9 | ||
Conservative | Hayley Kristina Eachus | 1,352 | 44.7 | ||
Labour | Walter Bell McCormick | 729 | 24.1 | ||
Labour | David Ferguson Bell | 715 | 23.6 | ||
Labour | Karl James Stewart | 553 | 18.3 | ||
Green | Bill Farrington | 474 | 15.7 | ||
Liberal Democrats | Marion Ruth Wolstencroft | 452 | 14.9 | ||
Liberal Democrats | Stav O'Doherty | 387 | 12.8 | ||
Hampshire Independents | David John White | 241 | 8.0 | ||
Majority | |||||
Turnout | 3,025 | ||||
Conservative win (new seat) | |||||
Conservative win (new seat) |
Party | Candidate | Votes | % | ±% | |
---|---|---|---|---|---|
B&D Independents | Laura James | 1,052 | 46.1 | ||
B&D Independents | Paul Duncan Harvey | 1,005 | 44.0 | ||
Labour | Carolyn Moorhouse Wooldridge | 815 | 35.7 | ||
Labour | Jack Murphy | 669 | 29.3 | ||
Labour | Stephen William Drake | 634 | 27.8 | ||
Conservative | Michael Robert Archer | 507 | 22.2 | ||
Conservative | Andrew Peter John Clarke | 397 | 17.4 | ||
Conservative | Jim Holder | 340 | 14.9 | ||
Hampshire Independents | Phil Heath | 283 | 12.4 | ||
Liberal Democrats | Jardine Ian Barrington-Cook | 218 | 9.6 | ||
TUSC | Mayola Evelien Demmenie | 63 | 2.8 | ||
Majority | |||||
Turnout | 2,282 | ||||
B&D Independents win (new seat) | |||||
Labour win (new seat) |
Party | Candidate | Votes | % | ±% | |
---|---|---|---|---|---|
Conservative | Diane Marilyn Taylor | 1,906 | 62.1 | ||
Conservative | Hannah Elizabeth Golding | 1,900 | 61.9 | ||
Conservative | Paul Gaskell | 1,532 | 49.9 | ||
Liberal Democrats | Paula Baker | 800 | 26.1 | ||
Liberal Democrats | Robert Charles Cooper | 696 | 22.7 | ||
Labour | Ian Peter Edney | 539 | 17.6 | ||
Hampshire Independents | Lucy Dean | 441 | 14.4 | ||
Majority | |||||
Turnout | 3,070 | ||||
Conservative win (new seat) | |||||
Conservative win (new seat) |
Party | Candidate | Votes | % | ±% | |
---|---|---|---|---|---|
Labour | Sajish Tom | 857 | 41.1 | ||
Labour | Jacky Tustain | 775 | 37.1 | ||
Labour | Grant Donohoe | 754 | 36.1 | ||
B&D Independents | David Alan Potter | 638 | 30.6 | ||
Conservative | Satya Sookhun | 512 | 24.5 | ||
Conservative | Mark Graham Budden | 487 | 23.3 | ||
Conservative | Deborah Elizabeth Moss | 399 | 19.1 | ||
Hampshire Independents | Steve James-Bailey | 275 | 13.2 | ||
Liberal Democrats | Lindsay Alistair Benjamin | 220 | 10.5 | ||
Liberal Democrats | Michael Berwick-Gooding | 220 | 10.5 | ||
Majority | |||||
Turnout | 2,087 | ||||
Labour win (new seat) | |||||
Labour win (new seat) |
Party | Candidate | Votes | % | ±% | |
---|---|---|---|---|---|
Conservative | Simon Edward Bound | 1,403 | 57.4 | ||
Conservative | Jay Ganesh | 1,185 | 48.4 | ||
Conservative | Tristan Wyatt Robinson | 1,160 | 47.4 | ||
Labour | Samir Chekini | 679 | 27.8 | ||
Labour | Criss Connor | 653 | 26.7 | ||
Liberal Democrats | Martin John Baker | 571 | 23.3 | ||
Hampshire Independents | Pete King | 266 | 10.9 | ||
Majority | |||||
Turnout | 2,446 | ||||
Conservative win (new seat) | |||||
Conservative win (new seat) |
Party | Candidate | Votes | % | ±% | |
---|---|---|---|---|---|
Labour | Stephanie Jane | 1,074 | 47.9 | ||
Labour | Gary John Watts | 990 | 44.1 | ||
Labour | Tony Jones | 891 | 39.7 | ||
Conservative | Lillian Phoebe Turner | 799 | 35.6 | ||
Conservative | David Peter O'Donnell | 722 | 32.2 | ||
Conservative | Neil Madresfield | 795 | 35.4 | ||
Hampshire Independents | Duncan Philip Stone | 247 | 11.0 | ||
Liberal Democrats | Madeline Hussey | 205 | 9.1 | ||
Liberal Democrats | Michael Gavin McKay | 178 | 7.9 | ||
Majority | |||||
Turnout | 2,244 | ||||
Labour win (new seat) | |||||
Labour win (new seat) |
Party | Candidate | Votes | % | ±% | |
---|---|---|---|---|---|
Conservative | David Alan Leeks | 1,678 | 52.6 | ||
Conservative | Kerri Elizbeth Carruthers | 1,583 | 49.6 | ||
Conservative | Derek Preston Mellor | 1,480 | 46.4 | ||
Liberal Democrats | Jo Slimin | 1,004 | 31.4 | ||
Liberal Democrats | Mike Bound | 819 | 25.6 | ||
Liberal Democrats | Steve Gibbons | 638 | 20.0 | ||
Labour | Elliott Oliver Gardiner | 396 | 12.4 | ||
Labour | Simon David Reeves | 374 | 11.7 | ||
Labour | Matt Russell | 356 | 11.1 | ||
Hampshire Independents | Charlotte Beatrice Margaret | 253 | 7.9 | ||
Majority | |||||
Turnout | 3,193 | ||||
Conservative win (new seat) | |||||
Conservative win (new seat) |
Party | Candidate | Votes | % | ±% | |
---|---|---|---|---|---|
Conservative | Ken Rhatigan | 1,759 | 52.2 | ||
Conservative | Stuart Michael Frost | 1,591 | 47.3 | ||
Conservative | Geoff Poland | 1,404 | 41.7 | ||
Liberal Democrats | Warwick Godfrey Lovegrove | 1,106 | 32.8 | ||
Liberal Democrats | Kerry Morrow | 843 | 25.0 | ||
Liberal Democrats | Ria Meiszner | 831 | 24.7 | ||
Independent | Ray Peach | 481 | 14.3 | ||
Labour | Lee Morgan | 421 | 12.5 | ||
Labour | Stephen David Rothman | 364 | 10.8 | ||
Majority | |||||
Turnout | 3,367 | ||||
Conservative win (new seat) | |||||
Conservative win (new seat) |
Party | Candidate | Votes | % | ±% | |
---|---|---|---|---|---|
B&D Independents | Colin John William Phillimore | 1,935 | 52.2 | ||
B&D Independents | Ian Tilbury | 1,911 | 51.6 | ||
Independent | Lucie Follett Maitland | 1,890 | 51.0 | ||
Conservative | James William Aris | 921 | 24.9 | ||
Liberal Democrats | Lucy Sloane Williams | 654 | 17.7 | ||
Conservative | Johanna Elizabeth | 648 | 17.5 | ||
Conservative | Jonathan Richards | 594 | 16.0 | ||
Liberal Democrats | Alex Hands | 513 | 13.8 | ||
Labour | Marc Connor | 438 | 11.8 | ||
Liberal Democrats | Adi Harris | 205 | 5.5 | ||
Hampshire Independents | Robert John Holliday | 201 | 5.4 | ||
Majority | |||||
Turnout | 3,704 | ||||
B&D Independents win (new seat) | |||||
Independent win (new seat) |
Party | Candidate | Votes | % | ±% | |
---|---|---|---|---|---|
Conservative | Abigail Compton-Burnett | 902 | 45.6 | ||
Labour | Angie Freeman | 852 | 43.0 | ||
Conservative | Sean Patmore Dillow | 799 | 40.4 | ||
Conservative | Mike Patchett | 766 | 38.7 | ||
Labour | Alex Lee | 667 | 33.7 | ||
Labour | Declan Huxley | 652 | 32.9 | ||
Liberal Democrats | Wendy Elizabeth McKay | 186 | 9.4 | ||
Hampshire Independents | Scott Neville | 158 | 8.0 | ||
Majority | |||||
Turnout | 1,980 | ||||
Conservative win (new seat) | |||||
Labour win (new seat) | |||||
Conservative win (new seat) |
Hampshire County Council (HCC) is an English council that governs eleven of the thirteen districts geographically located within the ceremonial county of Hampshire. As one of twenty-four county councils in England, it acts as the upper tier of local government to approximately 1.4 million people.
The City of Winchester is a local government district in Hampshire, England, with a city status.
The 2002 Basingstoke and Deane Council election took place on 2 May 2002 to elect members of Basingstoke and Deane Borough Council in Hampshire, England. The whole council was up for election with boundary changes since the last election in 2000 increasing the number of seats by 3. The council stayed under no overall control.
The 2003 Basingstoke and Deane Council election took place on 1 May 2003 to elect members of Basingstoke and Deane Borough Council in Hampshire, England. One third of the council was up for election and the council stayed under no overall control.
The 2004 Basingstoke and Deane Council election took place on 10 June 2004 to elect members of Basingstoke and Deane Borough Council in Hampshire, England. One third of the council was up for election and the council stayed under no overall control.
The 2006 Basingstoke and Deane Council election took place on 4 May 2006 to elect members of Basingstoke and Deane Borough Council in Hampshire, England. One third of the council was up for election and the council stayed under no overall control.
The 2007 Basingstoke and Deane Council election took place on 3 May 2007 to elect members of Basingstoke and Deane Borough Council in Hampshire, England. One third of the council was up for election and the Conservative Party stayed in overall control of the council.
The 2008 Basingstoke and Deane Council election took place on 1 May 2008 to elect members of Basingstoke and Deane Borough Council in Hampshire, England. The whole council was up for election with boundary changes since the 2007 election. The Conservative Party gained overall control of the council from no overall control.
The 2010 Basingstoke and Deane Council election took place on 6 May 2010 to elect members of Basingstoke and Deane Borough Council in Hampshire, England. It was part of the wider English Local Elections, which were postponed from their usual date of the first Thursday of May so that they could coincide with the General Election of that year. One third of the council was up for election and the Conservative Party stayed in overall control of the council.
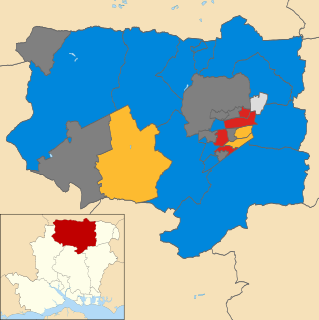
The 2011 Basingstoke and Deane Council election took place on 5 May 2011 to elect members of Basingstoke and Deane Borough Council in Hampshire, England. One third of the council was up for election and the Conservative Party stayed in overall control of the council.
The 2012 Basingstoke and Deane Council election was held on 3 May 2012 to elect members of Basingstoke and Deane Borough Council in Hampshire, England. 21 out of 60 seats were up for reelection; Popley East had two council seats up for reelection. The Conservative Party retained control of the council with 32 out of 60 seats, losing one seat to the Labour Party in Buckskin and losing another seat in Bramley and Sherfield to an Independent. Labour overtook the Liberal Democrats to become the largest opposition party and won two seats from them in Brighton Hill South and Brookvale and Kings Furlong.
The 2014 Basingstoke and Deane Borough Council election took place on 22 May 2014 to elect members of Basingstoke and Deane Borough Council in England. This was on the same day as other local elections. These elections were postponed from the usual first Thursday of May in order to coincide with the 2014 European Parliamentary Elections.
The 2017 Hampshire County Council election took place on 4 May 2017 as part of the 2017 local elections in the United Kingdom. All councillors were elected from electoral divisions by first-past-the-post voting for a four-year term of office. The electoral divisions were somewhat changed from the previous election, with some being split, merged or with boundary changes. No elections were held in Portsmouth and Southampton, which are unitary authorities and hold their elections in other years. Similarly the districts within Hampshire did also not hold elections this year.
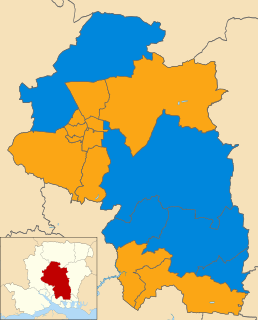
Elections to Winchester City Council took place on Thursday 2 May 2019, alongside other local elections across the country. The Conservatives Party held a narrow majority of one at the last election, with the seats contested in this election being last contested in 2016 election. The Conservatives defended 10 seats, whilst the Liberal Democrats defended 4. Town and parish councils in the city boundary were also up for election.
The 2018 Basingstoke and Deane Borough Council election took place on 3 May 2018 to elect 20 members to Basingstoke and Deane Borough Council, as part of the wider local elections. The seats were last up for election in 2014. The councillor for Basing up for election this year, Onnalee Cubitt, had rejoined the Conservative Party prior to the election and held her seat as a Conservative.
Elections to Hampshire County Council took on 6 May 2021 as part of the 2021 United Kingdom local elections. All 78 seats were up for election, with each ward returning either one or two councillors by first-past-the-post voting for a four-year term of office. This took place at the same time as the elections for the Hampshire Police and Crime Commissioner and district councils.
Elections to Gosport Borough Council took place on 6 May 2021 as part of the 2021 United Kingdom local elections. These took place at the same time as the elections for Hampshire County Council and the Hampshire Police and Crime Commissioner.
The 2022 Camden London Borough Council election took place on 5 May 2022. All 55 members of Camden London Borough Council were elected. The elections took place alongside local elections in the other London boroughs and elections to local authorities across the United Kingdom.
The 2022 Bury Metropolitan Borough Council election is currently taking place as of 5 May 2022. Due to boundary changes, all 51 councillors will be elected at the same time. The election will take place alongside other local elections across the United Kingdom.
The 2022 Bolton Metropolitan Borough Council election is currently taking place as of 5 May 2022. One third of councillors—20 out of 60—will be elected. The election will take place alongside other local elections across the United Kingdom.