The 2021 Cherwell District Council election was held on 6 May 2021 to elect members of Cherwell District Council in England. [1] This was on the same day as other local elections. The elections were postponed from May 2020 due to the COVID-19 pandemic [2]
2021 Cherwell District Council election | ||||||||||
---|---|---|---|---|---|---|---|---|---|---|
Party | This election | Full council | This election | |||||||
Seats | Net | Seats % | Other | Total | Total % | Votes | Votes % | +/− | ||
Conservative | 11 | 1 | 68.8 | 20 | 32 | 66.7 | 20,486 | 47.7 | +4.8 | |
Labour | 3 | 18.8 | 6 | 9 | 18.8 | 9,779 | 22.8 | +0.3 | ||
Liberal Democrats | 1 | 1 | 6.3 | 2 | 3 | 6.3 | 6,492 | 15.1 | +1.6 | |
Independent | 1 | 6.3 | 2 | 3 | 6.3 | 2,005 | 4.7 | -2.6 | ||
Green | 0 | 0.0 | 1 | 1 | 2.1 | 4,149 | 9.7 | -1.7 | ||
Reform UK | 0 | 0.0 | 0 | 0 | 0.0 | 37 | 0.1 | New | ||
Party | Candidate | Votes | % | ±% | |
---|---|---|---|---|---|
Conservative | Adam Nell | 1,512 | 51.9 | -0.3 | |
Liberal Democrats | David Hingley | 878 | 30.2 | +17.2 | |
Labour Co-op | Blue Watson | 522 | 17.9 | +1.4 | |
Majority | 634 | 21.7 | -12.2 | ||
Turnout | 2,932 | 39.21 | +6.4 | ||
Conservative hold | Swing | ||||
Party | Candidate | Votes | % | ±% | |
---|---|---|---|---|---|
Conservative | Kieron Mallon | 1,792 | 55.9 | +2.7 | |
Labour Co-op | Alicja Kokot | 754 | 23.5 | -2.3 | |
Green | Julia Middleton | 350 | 10.9 | N/A | |
Liberal Democrats | Ash Haeger | 204 | 6.4 | -14.6 | |
Independent | John Brown | 107 | 3.3 | N/A | |
Majority | 1,038 | 32.4 | +5.0 | ||
Turnout | 3,250 | 38.66 | +8.0 | ||
Conservative hold | Swing | ||||
Party | Candidate | Votes | % | ±% | |
---|---|---|---|---|---|
Labour | Matt Hodgson | 1,114 | 45.2 | -3.3 | |
Conservative | Fiaz Ahmed | 941 | 38.2 | +1.1 | |
Green | Linda Ward | 293 | 11.9 | N/A | |
Liberal Democrats | Robert Pattenden | 116 | 4.7 | -9.7 | |
Majority | 173 | 7.0 | -4.4 | ||
Turnout | 2,495 | 34.04 | +2.3 | ||
Labour hold | Swing | ||||
Party | Candidate | Votes | % | ±% | |
---|---|---|---|---|---|
Labour Co-op | Andrew Beere | 1,091 | 48.2 | -1.0 | |
Conservative | David Beverly | 797 | 35.2 | +5.1 | |
Green | Aaron Bliss | 243 | 10.7 | -10.0 | |
Liberal Democrats | David Yeomans | 133 | 5.9 | N/A | |
Majority | 294 | 13.0 | -6.1 | ||
Turnout | 2,309 | 32.77 | +3.7 | ||
Labour Co-op hold | Swing | ||||
Party | Candidate | Votes | % | ±% | |
---|---|---|---|---|---|
Conservative | John Donaldson | 981 | 47.5 | -2.2 | |
Labour | Simon Garrett | 692 | 33.5 | +8.1 | |
Independent | Berenice Westwood | 155 | 7.5 | N/A | |
Green | Christopher Manley | 133 | 6.4 | -6.7 | |
Liberal Democrats | James Hartley | 66 | 3.2 | N/A | |
Reform UK | Stephen Hartley | 37 | 1.8 | N/A | |
Majority | 289 | 14.0 | -10.3 | ||
Turnout | 2,074 | 29.11 | +2.9 | ||
Conservative hold | Swing | ||||
Party | Candidate | Votes | % | ±% | |
---|---|---|---|---|---|
Labour Co-op | Mark Cherry | 947 | 51.6 | -2.3 | |
Conservative | Jayne Strangwood | 676 | 36.9 | +3.7 | |
Green | Carol Broom | 132 | 7.2 | N/A | |
Liberal Democrats | Steve Buckwell | 79 | 4.3 | -8.6 | |
Majority | 271 | 14.7 | -6.0 | ||
Turnout | 1,849 | 26.69 | +2.9 | ||
Labour Co-op hold | Swing | ||||
Party | Candidate | Votes | % | ±% | |
---|---|---|---|---|---|
Conservative | Sandy Dallimore | 1,134 | 49.0 | +8.9 | |
Green | Peter Maguire | 537 | 23.2 | -10.4 | |
Labour Co-op | Gary Holder | 443 | 19.1 | +0.2 | |
Independent | Antony Peckham | 201 | 8.7 | N/A | |
Majority | 597 | 25.8 | +19.3 | ||
Turnout | 2,350 | 37.24 | +6.2 | ||
Conservative hold | Swing | ||||
Party | Candidate | Votes | % | ±% | |
---|---|---|---|---|---|
Conservative | Lynn Pratt | 1,108 | 52.7 | +4.8 | |
Labour | Sian Roscoe | 435 | 20.7 | +4.2 | |
Green | Clelia Bevillard | 302 | 14.4 | -3.6 | |
Liberal Democrats | Simon Lytton | 258 | 12.3 | -5.3 | |
Majority | 573 | 32.0 | +2.1 | ||
Turnout | 2,121 | 32.84 | +5.4 | ||
Conservative hold | Swing | ||||
Party | Candidate | Votes | % | ±% | |
---|---|---|---|---|---|
Conservative | Dan Sames | 1,374 | 42.9 | +12.6 | |
Liberal Democrats | Sam Decombel | 1,312 | 41.0 | N/A | |
Labour | Jane Clements | 516 | 16.1 | +2.8 | |
Majority | 62 | 1.9 | |||
Turnout | 3,220 | 35.95 | +6.6 | ||
Conservative hold | Swing | ||||
Party | Candidate | Votes | % | ±% | |
---|---|---|---|---|---|
Independent | Les Sibley | 1,542 | 63.2 | +5.7 | |
Conservative | Sundeep Singh | 473 | 19.4 | -7.3 | |
Labour | Celia Kavuma | 317 | 13.0 | -2.8 | |
Liberal Democrats | Chris Pruden | 106 | 4.3 | N/A | |
Majority | 1,069 | 43.8 | +10.0 | ||
Turnout | 2,464 | 36.85 | +2.4 | ||
Independent hold | Swing | ||||
Party | Candidate | Votes | % | ±% | |
---|---|---|---|---|---|
Conservative | George Reynolds | 1,995 | 65.3 | +6.5 | |
Labour | Anne Cullen | 614 | 20.1 | +4.5 | |
Green | Karl Kwiatkowski | 444 | 14.5 | N/A | |
Majority | 1,381 | 45.2 | +12.0 | ||
Turnout | 3,082 | 45.75 | +5.0 | ||
Conservative hold | Swing | ||||
Party | Candidate | Votes | % | ±% | |
---|---|---|---|---|---|
Conservative | Bryn Williams | 1,855 | 57.6 | +7.7 | |
Liberal Democrats | Nigel Davis | 686 | 21.3 | +4.0 | |
Labour | Amanda Watkins | 680 | 21.1 | +7.2 | |
Majority | 1,169 | 36.3 | +5.4 | ||
Turnout | 3,246 | 43.47 | +5.0 | ||
Conservative hold | Swing | ||||
Party | Candidate | Votes | % | ±% | |
---|---|---|---|---|---|
Conservative | Patrick Clarke | 1,662 | 60.1 | +4.9 | |
Green | Jenny Tamblyn | 673 | 24.3 | +5.4 | |
Labour | Christopher Howells | 430 | 15.6 | N/A | |
Majority | 989 | 35.8 | -0.4 | ||
Turnout | 2,790 | 40.28 | +5.4 | ||
Conservative hold | Swing | ||||
Party | Candidate | Votes | % | ±% | |
---|---|---|---|---|---|
Conservative | Maurice Billington | 1,524 | 50.5 | +12.8 | |
Green | Fiona Mawson | 1,042 | 34.5 | -5.9 | |
Labour | Catherine Arakelian | 450 | 14.9 | +0.9 | |
Majority | 482 | 16.0 | |||
Turnout | 3,047 | 42.53 | +4.3 | ||
Conservative hold | Swing | ||||
Party | Candidate | Votes | % | ±% | |
---|---|---|---|---|---|
Liberal Democrats | Dorothy Walker | 1,638 | 50.2 | -0.2 | |
Conservative | Helen Kingsley | 1,255 | 38.5 | +11.0 | |
Labour | Edward Lowe | 369 | 11.3 | -2.3 | |
Majority | 383 | 11.7 | |||
Turnout | 3,285 | 46.37 | +5.4 | ||
Liberal Democrats gain from Conservative | Swing | ||||
Party | Candidate | Votes | % | ±% | |
---|---|---|---|---|---|
Conservative | Simon Holland | 1,407 | 49.8 | -7.8 | |
Liberal Democrats | Calum Miller | 1,016 | 35.9 | N/A | |
Labour | Joanne Howells | 405 | 14.3 | -28.1 | |
Majority | 389 | 13.9 | |||
Turnout | 2,855 | 44.62 | +8.9 | ||
Conservative hold | Swing | ||||
Cherwell is a local government district in northern Oxfordshire, England. The district was created in 1974 and takes its name from the River Cherwell, which drains south through the region to flow into the River Thames at Oxford. Towns in Cherwell include Banbury and Bicester. Kidlington is a contender for largest village in England.
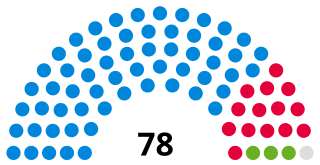
One third of Cherwell District Council in Oxfordshire, England is elected each year, followed by one year without election. Since the last comprehensive boundary changes in 2016, 48 councillors have been elected from 16 wards.
The 1998 Cherwell District Council election took place on 7 May 1998 to elect members of Cherwell District Council in Oxfordshire, England. One third of the council was up for election and the council stayed under no overall control.
The 1999 Cherwell District Council election took place on 6 May 1999 to elect members of Cherwell District Council in Oxfordshire, England. One third of the council was up for election and the council stayed under no overall control.
The 2000 Cherwell District Council election took place on 4 May 2000 to elect members of Cherwell District Council in Oxfordshire, England. One third of the council was up for election and the Conservative Party gained overall control of the council from no overall control.
The 2002 Cherwell District Council election took place on 2 May 2002 to elect members of Cherwell District Council in Oxfordshire, England. The whole council was up for election with boundary changes since the last election in 2000 reducing the number of seats by 2. The Conservative Party stayed in overall control of the council.
The 2003 Cherwell District Council election took place on 1 May 2003 to elect members of Cherwell District Council in Oxfordshire, England. One third of the council was up for election and the Conservative Party stayed in overall control of the council.
The 2006 Cherwell District Council election took place on 4 May 2006 to elect members of Cherwell District Council in Oxfordshire, England. One third of the council was up for election and the Conservative Party stayed in overall control of the council.
The 2011 Cherwell District Council election took place on 5 May 2011 to elect members of Cherwell District Council in Oxfordshire, England. One third of the council was up for election and the Conservative Party stayed in overall control of the council.
The 2012 Cherwell District Council election was held on 3 May 2012 to elect members of the Cherwell Council in England. This was the same day as other 2012 United Kingdom local elections.
The 2014 Cherwell District Council election took place on 22 May 2014 to elect members of Cherwell District Council in England. This was on the same day as other local elections.
The 2015 Cherwell District Council election took place on 7 May 2015 to elect members of the Cherwell District Council in England. This was on the same day as other local elections.
The 2016 Cherwell District Council election took place on 5 May 2016 to elect members of Cherwell District Council in England. This was on the same day as other local elections.
The 2021 United Kingdom local elections were held on Thursday 6 May 2021. More than 145 English local councils, around 5,000 councillor seats, thirteen directly elected mayors in England, and 39 police and crime commissioners in England and Wales were contested. On the same day, the 2021 Hartlepool by-election took place, and there were also elections to the Scottish Parliament, Senedd and London Assembly, the last in conjunction with the London mayoral election.
The 2018 Cherwell District Council election was held on 3 May 2018 to elect members of Cherwell District Council in England. This was on the same day as other local elections.
Elections of police and crime commissioners in England and Wales were held on 6 May 2021, on the same day as the Senedd election in Wales and the local elections in England. This was the third time police and crime commissioner elections have been held. The elections were originally due to take place in May 2020 but were postponed by 12 months in view of the COVID-19 pandemic. Turnout was an average of 34.1% across the elections, with Wales having much higher turnout mainly due to the simultaneous Senedd election held across Wales, whereas only parts of England had simultaneous local elections.
The 2019 Cherwell District Council election was held on 2 May 2019 to elect members of Cherwell District Council in England. This was on the same day as other local elections.
The 2021 North Northamptonshire Council election took place alongside nationwide local elections. The election was originally due to take place in May 2020, but was postponed due to the COVID-19 pandemic.
The 2021 Tandridge District Council election took place on 6 May 2021 to elect members of Tandridge District Council in England. This was on the same day as other local elections.
The 2022 Cherwell District Council election was held on 5 May 2022 to elect members of Cherwell District Council in England. This was on the same day as other local elections.