| |||||||||||||||||||||||||||||||||||||||||||||||||||||||||||
All 53 seats to Gloucestershire County Council 27 seats needed for a majority | |||||||||||||||||||||||||||||||||||||||||||||||||||||||||||
---|---|---|---|---|---|---|---|---|---|---|---|---|---|---|---|---|---|---|---|---|---|---|---|---|---|---|---|---|---|---|---|---|---|---|---|---|---|---|---|---|---|---|---|---|---|---|---|---|---|---|---|---|---|---|---|---|---|---|---|
| |||||||||||||||||||||||||||||||||||||||||||||||||||||||||||
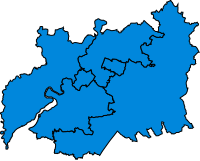
Map showing the results of the 2021 Gloucestershire County Council election | |||||||||||||||||||||||||||||||||||||||||||||||||||||||||||
|
The 2021 Gloucestershire County Council election took place on 6 May 2021 alongside other local elections. All 53 seats to Gloucestershire County Council were up for election. [1] The Conservatives retained their majority, albeit a smaller one than in 2017. [2]
In the 2017 Gloucestershire County Council election, the Conservatives won overall control of the council. [3]
At the 2019 United Kingdom general election, the Labour Party lost their only parliamentary seat in Gloucestershire.
Before the election, the council consisted of 28 Conservatives, 13 Liberal Democrats, 5 Labour (4 being Labour Co-op), 2 Green, 1 People Against Bureaucracy, 3 Independents and 1 vacant seat. [4]
There was some controversy over alleged delivery of election material and campaigning due to the ongoing COVID-19 pandemic in the United Kingdom. One candidate in the election was reported to the Gloucestershire Constabulary for allegedly breaching lockdown regulations but she denied this and claimed that the leaflets were not election related. The Liberal Democrats in the county claimed that it was a politically motivated attack on their campaign by the Conservative Party. [5]
After 2017 election [6] | Before 2021 election [4] | After 2021 election [2] | ||||||
---|---|---|---|---|---|---|---|---|
Party | Seats | Party | Seats | Party | Seats | |||
Conservative | 31 | Conservative | 28 | Conservative | 28 | |||
Liberal Democrats | 14 | Liberal Democrats | 13 | Liberal Democrats | 16 | |||
Labour | 3 | Labour Co-op | 4 | Labour Co-op | 4 | |||
Green | 2 | Independent | 3 | Green | 4 | |||
Labour Co-op | 2 | Green | 2 | Labour | 1 | |||
PAB | 1 | Labour | 1 | |||||
PAB | 1 | |||||||
Vacant | 1 |
2021 Gloucestershire County Council election | ||||||||||
---|---|---|---|---|---|---|---|---|---|---|
Party | Candidates | Seats | Gains | Losses | Net gain/loss | Seats % | Votes % | Votes | +/− | |
Conservative | 53 | 28 | 4 | 7 | 3 | 52.8 | 43.9 | 87,833 | –1.2 | |
Liberal Democrats | 44 | 16 | 3 | 1 | 2 | 30.2 | 24.8 | 49,528 | –2.6 | |
Labour | 49 | 5 | 2 | 2 | 9.4 | 15.4 | 30,832 | +1.0 | ||
Green | 39 | 4 | 3 | 1 | 2 | 7.5 | 13.0 | 25,916 | +5.3 | |
Independent | 14 | 0 | 0 | 0 | 0.0 | 2.2 | 4,340 | +1.0 | ||
Reform UK | 2 | 0 | 0 | 0 | 0.0 | 0.2 | 432 | N/A | ||
Freedom Alliance (UK) | 3 | 0 | 0 | 0 | 0.0 | 0.2 | 315 | N/A | ||
TUSC | 5 | 0 | 0 | 0 | 0.0 | 0.1 | 179 | N/A | ||
Libertarian | 2 | 0 | 0 | 0 | 0.0 | 0.1 | 169 | N/A | ||
UKIP | 1 | 0 | 0 | 0 | 0.0 | 0.1 | 91 | –3.1 | ||
Liberal | 1 | 0 | 0 | 0 | 0.0 | <0.1 | 77 | N/A | ||
Heritage | 1 | 0 | 0 | 0 | 0.0 | <0.1 | 68 | N/A | ||
PAB | 0 | 0 | 0 | 1 | 1 | 0.0 | 0.0 | 0 | –0.9 |
Party | Candidate | Votes | % | ±% | |
---|---|---|---|---|---|
Liberal Democrats | Colin Hay | 1,385 | 47.00 | −6 | |
Conservative | Jake Hardy | 897 | 30.44 | −1 | |
Green | Jessica West | 396 | 13.44 | +6 | |
Labour | Isobel Laing | 269 | 9.13 | −1 | |
Majority | 488 | 16.56 | −5 | ||
Turnout | 2,947 | 34.78 | +2.01 | ||
Liberal Democrats hold | Swing |
Party | Candidate | Votes | % | ±% | |
---|---|---|---|---|---|
Conservative | Matt Babbage | 1,988 | 45 | −1 | |
Liberal Democrats | Paul McCloskey | 1,767 | 40 | −5 | |
Green | Lorraine Mason | 430 | 10 | +5 | |
Labour | Ella Rees | 216 | 5 | ±0 | |
Majority | 221 | 5 | +4 | ||
Turnout | 4,401 | 48.49 | +2.15 | ||
Conservative hold | Swing |
Party | Candidate | Votes | % | ±% | |
---|---|---|---|---|---|
Liberal Democrats | Roger Whyborn | 2,037 | 50 | −2 | |
Conservative | Jonathan Beeston | 1,557 | 38 | −2 | |
Green | Samantha Hodges | 360 | 9 | +5 | |
Labour | Robin Carey | 148 | 4 | ±0 | |
Majority | 480 | 12 | ±0 | ||
Turnout | 4,102 | 50.77 | +4.43 | ||
Liberal Democrats hold | Swing |
Party | Candidate | Votes | % | ±% | |
---|---|---|---|---|---|
Liberal Democrats | Paul Baker | 2,106 | 48 | −13 | |
Conservative | Graham Bocking | 1,608 | 37 | +5 | |
Green | Sharon Wallington | 432 | 10 | +6 | |
Labour | Robert Arnott | 216 | 5 | +2 | |
Majority | 498 | 11 | −18 | ||
Turnout | 4,362 | 52.57 | +5.64 | ||
Liberal Democrats hold | Swing |
Party | Candidate | Votes | % | ±% | |
---|---|---|---|---|---|
Liberal Democrats | Suzanne Williams | 1,333 | 48 | −6 | |
Conservative | Laura Haley | 972 | 35 | +5 | |
Labour | Thomas Johnson | 252 | 9 | +1 | |
Green | Adrian Becker | 220 | 8 | +5 | |
Majority | 361 | 13 | −11 | ||
Turnout | 2,777 | 27.82 | +1.51 | ||
Liberal Democrats hold | Swing |
Party | Candidate | Votes | % | ±% | |
---|---|---|---|---|---|
Conservative | Tim Harman | 2,101 | 48 | −2 | |
Liberal Democrats | Paul Wheat | 1,636 | 38 | −4 | |
Green | Stephen Bell | 620 | 14 | +10 | |
Majority | 465 | 10 | +2 | ||
Turnout | 4,357 | 48.07 | −2.15 | ||
Conservative hold | Swing |
Party | Candidate | Votes | % | ±% | |
---|---|---|---|---|---|
Conservative | Margaret Nelson | 1,982 | 42 | −1 | |
Liberal Democrats | Iain Dobie | 1,878 | 40 | −9 | |
Green | Peter Frings | 684 | 15 | +11 | |
Labour | Ian White | 133 | 3 | −1 | |
Majority | 104 | 2 | −4 | ||
Turnout | 4,677 | 53.70 | +3.48 | ||
Conservative gain from Liberal Democrats | Swing |
Party | Candidate | Votes | % | ±% | |
---|---|---|---|---|---|
Conservative | Stephan Fifield | 2,327 | 53 | +32 | |
Liberal Democrats | Jason Potter-Peachey | 1,143 | 26 | −9 | |
Green | Billy Wassell | 561 | 13 | +10 | |
Labour | Julie Farmer | 375 | 9 | +6 | |
Majority | 1,184 | 27 | +24 | ||
Turnout | 4,406 | 45.82 | +0.79 | ||
Conservative gain from PAB | Swing |
Party | Candidate | Votes | % | ±% | |
---|---|---|---|---|---|
Liberal Democrats | David Willingham | 1,651 | 49 | −10 | |
Conservative | Daniel Ruff | 941 | 28 | +5 | |
Green | Malcolm Allison | 404 | 12 | +5 | |
Labour | Clive Harriss | 344 | 10 | +2 | |
Majority | 710 | 21 | −15 | ||
Turnout | 3,340 | 32.71 | +1.96 | ||
Liberal Democrats hold | Swing |
Party | Candidate | Votes | % | ±% | |
---|---|---|---|---|---|
Liberal Democrats | Bernie Fisher | 1,135 | 40 | −10 | |
Conservative | Rhiannon Evans | 755 | 27 | +3 | |
Green | Tabi Joy | 650 | 23 | +16 | |
Labour | Kenneth Syme | 297 | 10 | −8 | |
Majority | 380 | 13 | −13 | ||
Turnout | 2,837 | 32.52 | +5.26 | ||
Liberal Democrats hold | Swing |
Party | Candidate | Votes | % | ±% | |
---|---|---|---|---|---|
Liberal Democrats | Paul Hodgkinson | 2,136 | 56 | −4 | |
Conservative | Tom Bradley | 1,241 | 32 | −8 | |
Labour | Timothy Davies | 242 | 6 | +6 | |
Green | Bob Irving | 150 | 4 | +4 | |
Liberal | Byron Hadley | 77 | 2 | +2 | |
Majority | 895 | 24 | +4 | ||
Turnout | 3,846 | 43.69 | −2.71 | ||
Liberal Democrats hold | Swing |
Party | Candidate | Votes | % | ±% | |
---|---|---|---|---|---|
Conservative | Lynden Stowe | 2,323 | 63 | −5 | |
Green | Clare Turner | 735 | 20 | +15 | |
Reform UK | Robert McNeil-Wilson | 359 | 10 | +7 | |
Labour | John Callinan | 290 | 8 | +8 | |
Majority | 1,588 | 43 | −2 | ||
Turnout | 3,707 | 43.20 | +4.70 | ||
Conservative hold | Swing |
Party | Candidate | Votes | % | ±% | |
---|---|---|---|---|---|
Liberal Democrats | Joe Harris | 2,085 | 54 | −4 | |
Conservative | David Fowles | 1,422 | 37 | +3 | |
Green | Erin Hughes | 207 | 5 | +1 | |
Labour | Sebastian Parkinson | 126 | 3 | +3 | |
TUSC | Alan Mackenzie | 33 | 1 | +1 | |
Majority | 663 | 17 | −7 | ||
Turnout | 3,873 | 43.41 | +4.61 | ||
Liberal Democrats hold | Swing |
Party | Candidate | Votes | % | ±% | |
---|---|---|---|---|---|
Liberal Democrats | Rebecca Halifax | 1,824 | 54 | −9 | |
Conservative | Robert Gibson | 1,106 | 33 | +6 | |
Green | Ariana Strait | 225 | 7 | +5 | |
Labour | Robin Layfield | 215 | 6 | +1 | |
Majority | 718 | 21 | −15 | ||
Turnout | 3,370 | 40.49 | −1.01 | ||
Liberal Democrats hold | Swing |
Party | Candidate | Votes | % | ±% | |
---|---|---|---|---|---|
Conservative | Dom Morris | 2,326 | 59 | +4 | |
Liberal Democrats | Tony Dale | 1,344 | 34 | +2 | |
Labour | Sharon Aldrick | 261 | 7 | +1 | |
Majority | 982 | 25 | +2 | ||
Turnout | 3,931 | 45.20 | +5.40 | ||
Conservative hold | Swing |
Party | Candidate | Votes | % | ±% | |
---|---|---|---|---|---|
Liberal Democrats | Lisa Spivey | 2,133 | 51 | +3 | |
Conservative | Shaun Parsons | 1,816 | 43 | −6 | |
Labour | Maggie Elsey | 189 | 4 | +4 | |
Reform UK | Simon Moxon | 77 | 2 | +2 | |
Majority | 317 | 8 | +7 | ||
Turnout | 4,215 | 48.38 | +6.38 | ||
Liberal Democrats gain from Conservative | Swing |
Party | Candidate | Votes | % | ±% | |
---|---|---|---|---|---|
Conservative | Mark Mackenzie-Charrington | 2,272 | 53 | −10 | |
Liberal Democrats | Clive Webster | 1,780 | 42 | +15 | |
Labour | John Beer | 226 | 5 | +5 | |
Majority | 492 | 11 | −25 | ||
Turnout | 4,278 | 41.54 | +3.84 | ||
Conservative hold | Swing |
Party | Candidate | Votes | % | ±% | |
---|---|---|---|---|---|
Conservative | Stephen Hirst | 2,006 | 56 | −13 | |
Green | Sabrina Poole | 1,155 | 32 | +7 | |
Labour | Simon Bye | 425 | 12 | +12 | |
Majority | 851 | 24 | −20 | ||
Turnout | 3,586 | 41.16 | +4.16 | ||
Conservative hold | Swing |
Party | Candidate | Votes | % | ±% | |
---|---|---|---|---|---|
Green | Beki Hoyland | 1,345 | 34 | +24 | |
Conservative | Richard Boyles | 1,328 | 34 | +1 | |
Independent | Richard Leppington | 662 | 17 | −11 | |
Labour | Khady Gueye | 622 | 16 | −4 | |
Majority | 17 | 0.4 | −5 | ||
Turnout | 3,957 | 42 | |||
Green gain from Conservative | Swing |
Party | Candidate | Votes | % | ±% | |
---|---|---|---|---|---|
Labour | Graham Morgan | 1,125 | 51 | −3 | |
Conservative | Carol Thomas | 736 | 33 | +8 | |
Green | Alison Bruce | 264 | 12 | +4 | |
Liberal Democrats | Peter Brown | 65 | 3 | ±0 | |
TUSC | Ian Quick | 22 | 1 | +1 | |
Majority | 489 | 18 | −11 | ||
Turnout | 2,212 | 27 | |||
Labour hold | Swing |
Party | Candidate | Votes | % | ±% | |
---|---|---|---|---|---|
Conservative | Carole Allaway-Martin | 1,149 | 44 | −4 | |
Labour | Matt Bishop | 688 | 26 | ±0 | |
Independent | Ian Whitburn | 633 | 24 | +24 | |
Liberal Democrats | Peter Taylor | 158 | 6 | −4 | |
Majority | 461 | 18 | −4 | ||
Turnout | 2,628 | 31 | |||
Conservative hold | Swing |
Party | Candidate | Votes | % | ±% | |
---|---|---|---|---|---|
Conservative | Terry Hale | 1,039 | 33 | ±0 | |
Independent | Thom Forester | 804 | 26 | +26 | |
Labour Co-op | Di Martin | 775 | 25 | −1 | |
Green | Sid Phelps | 411 | 13 | +13 | |
Liberal Democrats | Andrew Cooley | 73 | 2 | −3 | |
Majority | 235 | 7 | +5 | ||
Turnout | 3,102 | 38 | |||
Conservative hold | Swing |
Party | Candidate | Votes | % | ±% | |
---|---|---|---|---|---|
Conservative | Alan Preest | 1,514 | 54 | +8 | |
Labour | Mel Farrant | 566 | 20 | −4 | |
Green | Andy Wright | 417 | 15 | +4 | |
Liberal Democrats | Terry Tull | 137 | 5 | −1 | |
UKIP | Alan Grant | 91 | 3 | −11 | |
TUSC | Claude Mickleson | 63 | 2 | +2 | |
Majority | 948 | 34 | +12 | ||
Turnout | 2,788 | 34 | |||
Conservative hold | Swing |
Party | Candidate | Votes | % | ±% | |
---|---|---|---|---|---|
Conservative | Philip Robinson | 1,669 | 48 | −7 | |
Independent | Brian Robinson | 795 | 23 | −32 | |
Labour | Shaun Stammers | 565 | 16 | +2 | |
Green | Jackie Dale | 429 | 12 | +7 | |
Majority | 874 | 25 | −10 | ||
Turnout | 3,458 | 41 | |||
Conservative hold | Swing |
Party | Candidate | Votes | % | ±% | |
---|---|---|---|---|---|
Liberal Democrats | Gill Moseley | 1,651 | 51 | +42 | |
Conservative | Will Windsor-Clive | 1,579 | 49 | −14 | |
Majority | 72 | 2 | −50 | ||
Turnout | 3,230 | 38 | |||
Liberal Democrats gain from Conservative | Swing |
Party | Candidate | Votes | % | ±% | |
---|---|---|---|---|---|
Green | Chris McFarling | 2,326 | 61 | +38 | |
Conservative | Patrick Molyneux | 1,492 | 39 | ±0 | |
Majority | 834 | 22 | +6 | ||
Turnout | 3,818 | 47 | |||
Green gain from Conservative | Swing |
Party | Candidate | Votes | % | ±% | |
---|---|---|---|---|---|
Conservative | Andrew Gravells | 2,499 | 65 | −5 | |
Liberal Democrats | Alwin Wiederhold | 712 | 19 | +7 | |
Labour | Sam Maynard | 607 | 16 | −2 | |
Majority | 1,787 | 46 | −6 | ||
Turnout | 3,818 | 40.59 | |||
Conservative hold | Swing |
Party | Candidate | Votes | % | ±% | |
---|---|---|---|---|---|
Liberal Democrats | David Brown | 2,173 | 51 | +1 | |
Conservative | Fred Ramsey | 1,416 | 33 | −8 | |
Labour | Trevor Howard | 376 | 9 | +2 | |
Green | Frances Griffiths | 148 | 3 | +1 | |
Independent | Jim Woods | 107 | 2 | +2 | |
Green | Anthony Bergonzi | 66 | 2 | ±0 | |
Majority | 757 | 18 | +9 | ||
Turnout | 4,286 | 46.13 | |||
Liberal Democrats hold | Swing |
Party | Candidate | Votes | % | ±% | |
---|---|---|---|---|---|
Conservative | Sajid Patel | 1,791 | 54 | +3 | |
Labour | Usman Bhaimia | 1,194 | 36 | −4 | |
Independent | Simon Collins | 154 | 5 | +5 | |
Liberal Democrats | Sandra Adams | 152 | 5 | +1 | |
Majority | 525 | 18 | +7 | ||
Turnout | 3,291 | 37.29 | |||
Conservative hold | Swing |
Party | Candidate | Votes | % | ±% | |
---|---|---|---|---|---|
Conservative | Alastair Chambers | 1,271 | 51 | +14 | |
Labour | Lesley Williams | 677 | 27 | −16 | |
Liberal Democrats | Luke Shervey | 215 | 9 | −1 | |
Independent | Robert McCormick | 157 | 6 | +6 | |
Green | Adam Shearing | 152 | 6 | +6 | |
TUSC | Susan Powell | 30 | 1 | +1 | |
Majority | 594 | 24 | +18 | ||
Turnout | 2,502 | 29.95 | |||
Conservative gain from Labour | Swing |
Party | Candidate | Votes | % | ±% | |
---|---|---|---|---|---|
Conservative | David Norman | 1,774 | 57 | ±0 | |
Labour | Gary Mills | 725 | 23 | −2 | |
Green | Robert Brookes | 236 | 8 | +4 | |
Independent | Scott Clacher | 213 | 7 | +7 | |
Liberal Democrats | Paul Caiden | 169 | 5 | −2 | |
Majority | 1,049 | 34 | +2 | ||
Turnout | 3,117 | 30.40 | |||
Conservative hold | Swing |
Party | Candidate | Votes | % | ±% | |
---|---|---|---|---|---|
Conservative | Pam Tracey | 1,365 | 42 | −8 | |
Labour | Jake Pier | 803 | 25 | −5 | |
Liberal Democrats | Rebecca Trimnell | 746 | 23 | +14 | |
Green | Mike Byfield | 213 | 7 | +2 | |
Independent | Philip Nash | 94 | 3 | +3 | |
Majority | 563 | 17 | −3 | ||
Turnout | 3,221 | 35.30 | |||
Conservative hold | Swing |
Party | Candidate | Votes | % | ±% | |
---|---|---|---|---|---|
Liberal Democrats | Jeremy Hilton | 1,574 | 50 | −2 | |
Conservative | Peter Sheehy | 779 | 25 | +1 | |
Labour | Ola Kareem | 500 | 16 | −2 | |
Green | Jonathan Ingleby | 196 | 6 | +3 | |
Independent | John McStay | 73 | 2 | +2 | |
Majority | 795 | 25 | −3 | ||
Turnout | 3,122 | 38.46 | |||
Liberal Democrats hold | Swing |
Party | Candidate | Votes | % | ±% | |
---|---|---|---|---|---|
Conservative | Kathy Williams | 2,087 | 52 | +3 | |
Liberal Democrats | Sarah Sawyer | 1,350 | 33 | −3 | |
Labour | Ellis Fincham | 461 | 11 | +3 | |
Libertarian | Matthew Young | 101 | 2 | −2 | |
Independent | Stuart Love | 46 | 1 | +1 | |
Majority | 737 | 19 | +6 | ||
Turnout | 4,045 | 43.10 | |||
Conservative hold | Swing |
Party | Candidate | Votes | % | ±% | |
---|---|---|---|---|---|
Conservative | Mark Hawthorne | 1,633 | 53 | +3 | |
Liberal Democrats | Liam Harries | 665 | 22 | −6 | |
Labour | Jack Fayter | 438 | 14 | +2 | |
No Description | Anna Mozol | 296 | 10 | −18 | |
Freedom Alliance | Rhondda Lee | 29 | 1 | +1 | |
Majority | 968 | 31 | +9 | ||
Turnout | 3,061 | 35.29 | |||
Conservative hold | Swing |
Party | Candidate | Votes | % | ±% | |
---|---|---|---|---|---|
Conservative | Andrew Miller | 1,817 | 51 | −1 | |
Labour | Tracy Millard | 1,006 | 28 | −8 | |
Liberal Democrats | Sebastian Field | 327 | 9 | +3 | |
Green | Sharon Byfield | 244 | 7 | +7 | |
Independent | Gary Cleaver | 187 | 5 | +5 | |
Majority | 811 | 23 | +7 | ||
Turnout | 3,581 | 37.97 | |||
Conservative hold | Swing |
Party | Candidate | Votes | % | ±% | |
---|---|---|---|---|---|
Conservative | Susan Williams | 2,386 | 47 | −3 | |
Green | Alan Mossman | 2,001 | 39 | +11 | |
Labour Co-op | Helen Fenton | 694 | 14 | +14 | |
Majority | 385 | 8 | −14 | ||
Turnout | 5,081 | 52 | |||
Conservative hold | Swing |
Party | Candidate | Votes | % | ±% | |
---|---|---|---|---|---|
Conservative | Brian Tipper | 2,431 | 55 | +1 | |
Labour Co-op | Natalie Bennett | 1,231 | 28 | −8 | |
Green | Martyn Cutcher | 417 | 9 | +9 | |
Liberal Democrats | Richard Blackwell-Whitehead | 331 | 8 | −2 | |
Majority | 1,200 | 27 | +9 | ||
Turnout | 4,410 | 42 | |||
Conservative hold | Swing |
Party | Candidate | Votes | % | ±% | |
---|---|---|---|---|---|
Labour Co-op | Wendy Thomas | 2,080 | 50.45 | +12 | |
Conservative | Loraine Patrick | 2,043 | 49.55 | +5 | |
Majority | 37 | 0.90 | −6 | ||
Turnout | 4,123 | 45 | |||
Labour gain from Conservative | Swing |
Party | Candidate | Votes | % | ±% | |
---|---|---|---|---|---|
Conservative | Stephen Davies | 2,197 | 61 | +3 | |
Labour | Oakley Pollard | 857 | 24 | +8 | |
Liberal Democrats | Mike Stayte | 551 | 15 | −2 | |
Majority | 1,340 | 37 | −4 | ||
Turnout | 3,605 | 39 | |||
Conservative hold | Swing |
Party | Candidate | Votes | % | ±% | |
---|---|---|---|---|---|
Green | Chloe Turner | 3,390 | 61 | +11 | |
Conservative | Julia Judd | 2,041 | 37 | −13 | |
Freedom Alliance | Karen McWalter | 103 | 2 | +2 | |
Majority | 1,349 | 24 | +24 | ||
Turnout | 5,534 | 54 | |||
Green hold | Swing |
Party | Candidate | Votes | % | ±% | |
---|---|---|---|---|---|
Labour Co-op | Steve Robinson | 2,582 | 54 | +12 | |
Conservative | Ewan Denning | 1,732 | 37 | −1 | |
Liberal Democrats | Rhianna Wilsher | 424 | 9 | ±0 | |
Majority | 850 | 17 | +13 | ||
Turnout | 4,738 | 52 | |||
Labour hold | Swing |
Party | Candidate | Votes | % | ±% | |
---|---|---|---|---|---|
Labour Co-op | John Bloxsom | 1,598 | 35 | −10 | |
Conservative | Bob Trusty | 1,306 | 29 | −2 | |
Green | Philip Blomberg | 1,048 | 23 | +8 | |
Independent | Graham Stanley | 415 | 9 | +9 | |
Liberal Democrats | Adam Cain | 125 | 3 | −6 | |
Heritage | Richard Nurse | 68 | 1 | +1 | |
Majority | 292 | 6 | −8 | ||
Turnout | 4,560 | 44 | |||
Labour hold | Swing |
Party | Candidate | Votes | % | ±% | |
---|---|---|---|---|---|
Conservative | Nicholas Housden | 1,244 | 43 | +11 | |
Labour Co-op | Taz Jones | 790 | 27 | −19 | |
Green | Carol Kambites | 651 | 22 | +14 | |
Liberal Democrats | Robert Jewell | 128 | 4 | −3 | |
Libertarian | Glenville Gogerly | 68 | 2 | −4 | |
TUSC | Chris Moore | 31 | 1 | +1 | |
Majority | 454 | 16 | +2 | ||
Turnout | 2,912 | 37 | |||
Conservative gain from Labour | Swing |
Party | Candidate | Votes | % | ±% | |
---|---|---|---|---|---|
Labour Co-op | David Drew | 2,265 | 43.90 | +14 | |
Green | Molly Scott Cato | 1,668 | 32.33 | −9 | |
Conservative | Anthony Blackburn | 1,019 | 19.75 | −4 | |
Freedom Alliance | Arthur Edwards | 118 | 2.29 | +2 | |
Liberal Democrats | George James | 90 | 1.76 | −4 | |
Majority | 597 | 11.57 | |||
Turnout | 5,160 | 49 | |||
Labour gain from Green | Swing |
Party | Candidate | Votes | % | ±% | |
---|---|---|---|---|---|
Liberal Democrats | Linda Cohen | 1,899 | 46 | −1 | |
Conservative | Graham Smith | 1,777 | 43 | +2 | |
Labour | David Carter | 451 | 11 | +2 | |
Majority | 122 | 3 | −3 | ||
Turnout | 4,127 | 48 | |||
Liberal Democrats hold | Swing |
Party | Candidate | Votes | % | ±% | |
---|---|---|---|---|---|
Liberal Democrats | Alex Hegenbarth | 2,655 | 54 | +27 | |
Conservative | Robert Bird | 1,910 | 39 | −22 | |
Labour | Andrew Williams | 327 | 7 | −1 | |
Freedom Alliance | Richard Brooke | 65 | 1 | +1 | |
Majority | 745 | 15 | −19 | ||
Turnout | 4,957 | 40.39 | |||
Liberal Democrats gain from Conservative | Swing |
Party | Candidate | Votes | % | ±% | |
---|---|---|---|---|---|
Conservative | Robert Vines | 2,073 | 53 | ±0 | |
Labour | Joe Ambrose | 967 | 25 | +25 | |
Liberal Democrats | Clare Softley | 846 | 22 | −10 | |
Majority | 1,106 | 28 | +7 | ||
Turnout | 3,886 | 32.28 | |||
Conservative hold | Swing |
Party | Candidate | Votes | % | ±% | |
---|---|---|---|---|---|
Liberal Democrats | Ben Evans | 1,978 | 59 | +8 | |
Conservative | Paul Grierson | 1,003 | 30 | −10 | |
Labour | Rosy Varden | 234 | 7 | −2 | |
Green | Campbell Milne | 149 | 4 | +4 | |
Majority | 975 | 29 | +18 | ||
Turnout | 3,364 | 40.14 | |||
Liberal Democrats hold | Swing |
Party | Candidate | Votes | % | ±% | |
---|---|---|---|---|---|
Conservative | Phil Awford | 2,723 | 66.22 | −5 | |
Green | Su Billington | 492 | 11.96 | +5 | |
Liberal Democrats | Martin Griffiths | 458 | 11.14 | +1 | |
Labour | Stephen Miller | 439 | 10.68 | −2 | |
Majority | 2,231 | 54.26 | −4 | ||
Turnout | 4,112 | 37.69 | |||
Conservative hold | Swing |
Party | Candidate | Votes | % | ±% | |
---|---|---|---|---|---|
Green | Cate Cody | 1,781 | 52 | +52 | |
Conservative | Kevin Cromwell | 1,444 | 42 | +1 | |
Labour | Simon O’Rourke | 219 | 6 | −3 | |
Majority | 337 | 10 | +8 | ||
Turnout | 3,444 | 41.43 | |||
Green gain from Conservative | Swing |
Party | Candidate | Votes | % | ±% | |
---|---|---|---|---|---|
Conservative | Vernon Smith | 1,510 | 46 | −18 | |
Liberal Democrats | Christopher Coleman | 1,145 | 35 | +18 | |
Labour | Zoe Darlington | 328 | 10 | −4 | |
Green | Jan Millett | 269 | 8 | +3 | |
Majority | 365 | 11 | −36 | ||
Turnout | 3,252 | 35.14 | |||
Conservative hold | Swing |
Party | Candidate | Votes | % | ±% | |
---|---|---|---|---|---|
Conservative | David Gray | 2,416 | 53 | −11 | |
Liberal Democrats | Nigel Adcock | 1,358 | 30 | +5 | |
Labour | Susan Sturgeon | 418 | 9 | +2 | |
Green | Stuart Galey | 374 | 8 | +3 | |
Majority | 1,058 | 23 | −16 | ||
Turnout | 4,566 | 44.90 | |||
Conservative hold | Swing |
Party | Candidate | Votes | % | ±% | |
---|---|---|---|---|---|
Conservative | Paul McLain | 2,041 | 50.7 | −15.5 | |
Liberal Democrats | James Joyce | 1,411 | 35.1 | +24.0 | |
Green | Jonathan Bristow | 572 | 14.2 | +2.2 | |
Majority | 630 | 15.7 | |||
Turnout | 4,024 | ||||
Conservative hold | Swing |
The city of Bristol, England, is a unitary authority, represented by four MPs representing seats wholly within the city boundaries. The overall trend of both local and national representation became left of centre during the latter 20th century. The city has a tradition of local activism, with environmental issues and sustainable transport being prominent issues in the city.
Elections to Suffolk County Council were held on 4 June 2009 as part of the 2009 United Kingdom local elections on the same day as the elections to the European Parliament. 75 councillors were elected from 63 electoral divisions, which returned either one or two county councillors each by first-past-the-post voting for a four-year term of office. The electoral divisions were the same as those used at the previous election in 2005.
Thanet District Council elections are held every four years to elect Thanet District Council in Kent, England. Since the last boundary changes in 2003 the council has comprised 56 councillors representing 23 wards.
An election to Hampshire County Council took place on 2 May 2013 as part of the 2013 United Kingdom local elections. 78 councillors were elected from 75 electoral divisions, which returned either one or two county councillors each by first-past-the-post voting for a four-year term of office. The electoral divisions were the same as those of the previous election in 2009. No elections were held in Portsmouth and Southampton, which are unitary authorities outside the area covered by the County Council. The election saw the Conservative Party retain overall control of the council, with a reduced majority of five councillors.
An election to Lincolnshire County Council took place on 2 May 2013 as part of the 2013 United Kingdom local elections. 77 electoral divisions returned one county councillor each by first-past-the-post voting for a four-year term of office. The electoral divisions were the same as those used at the previous election in 2009. No elections were held in North Lincolnshire or North East Lincolnshire, which are unitary authorities outside the area covered by the County Council.
Elections to Gloucestershire County Council took place on 2 May 2013 as part of the 2013 United Kingdom local elections. 53 electoral divisions elected one county councillor each by first-past-the-post voting for a four-year term of office. No elections were held in South Gloucestershire, which is a unitary authority outside the area covered by the County Council.
Elections to Suffolk County Council took place on 2 May 2013 as part of the 2013 United Kingdom local elections. 75 councillors were elected from 63 electoral divisions, which returned either one or two county councillors each by first-past-the-post voting for a four-year term of office. The electoral divisions were the same as those used at the previous election in 2009.
The 2015 Aylesbury Vale District Council election took place on 7 May 2015 to elect members of Aylesbury Vale District Council in Buckinghamshire, England. The whole council was up for election with boundary changes since the last election in 2011. The Conservative Party remained in overall control of the council.
The 2017 Gloucestershire County Council election took place on 4 May 2017 as part of the 2017 local elections in the United Kingdom. All 53 councillors were elected from electoral divisions which returned one county councillor each by first-past-the-post voting for a four-year term of office. Control of the council went from a Conservative Party minority to a majority administration.
The 2017 Cornwall Council election was held on 4 May 2017 as part of the 2017 local elections in the United Kingdom. 122 councillors were elected from the 121 electoral divisions of Cornwall Council, which returned either one or two councillors each by first-past-the-post voting for a four-year term of office. Although originally scheduled to take place on the same day, the election in the Bodmin St Petroc ward was countermanded following the death of Liberal Democrat candidate Steve Rogerson and was held on 8 June.
The 2019 Spelthorne Borough Council election took place on 2 May 2019 to elect all members of Spelthorne Borough Council in England. The Conservatives retained control of the council, but with a reduced majority of 7, down from 31.
The 2021 Cornwall Council election took place on 6 May 2021 as part of the 2021 United Kingdom local elections. It was contested under new division boundaries as the number of seats on the council falls from 123 to 87. The election was won by the Conservative Party, who took an overall majority of seats.
The 2021 Nottinghamshire County Council election took place on 6 May 2021 as part of the 2021 local elections in the United Kingdom. All 66 councillors were elected from 56 electoral divisions, which returned either one or two county councillors each by first-past-the-post voting for a four-year term of office.
The 2022 Birmingham City Council election took place on 5 May 2022, with all 101 council seats up for election across 37 single-member and 32 two-member wards. The election was held alongside other local elections across Great Britain and town council elections in Sutton Coldfield.
The 2022 Barnet London Borough Council election took place on 5 May 2022, alongside local elections in the other London boroughs and elections to local authorities across the United Kingdom. All 63 members of Barnet London Borough Council were elected. The Labour Party took overall control, winning 41 of the seats to the Conservative Party's 22. This was the first time Labour had won the council outright; previously, the Conservatives had always won the most seats, usually with an overall majority.
The 2022 Bexley London Borough Council election took place on 5 May 2022. 45 members of Bexley London Borough Council were elected. The elections took place alongside local elections in the other London boroughs and elections to local authorities across the United Kingdom.
The 2022 Cardiff Council election took place on 5 May 2022 to elect 79 members to Cardiff Council. On the same day, elections were held to the other 21 local authorities and to community councils in Wales as part of the 2022 Welsh local elections.
The 2022 Kirklees Metropolitan Borough Council election took place on 5 May 2022. One third of councillors—23 out of 69—on Kirklees Metropolitan Borough Council were elected. The election took place alongside other local elections across the United Kingdom.
The 2022 Sunderland City Council election took place on 5 May 2022 to elect members of Sunderland City Council. This is on the same day as other elections across the United Kingdom.