| |||||||||||||||||||||||||||||||||||||
12 of 39 seats to Eastleigh Borough Council 20 seats needed for a majority | |||||||||||||||||||||||||||||||||||||
---|---|---|---|---|---|---|---|---|---|---|---|---|---|---|---|---|---|---|---|---|---|---|---|---|---|---|---|---|---|---|---|---|---|---|---|---|---|
| |||||||||||||||||||||||||||||||||||||
Results by ward in 2021. White denotes no election held in this ward this year | |||||||||||||||||||||||||||||||||||||
|
The 2021 Eastleigh Borough Council election took place on 6 May 2021 to elect 12 councillors to Eastleigh Borough Council. Every ward apart from the two member wards of West End North and West End South elected one councillor each. [1] This took place at the same time as the elections for Hampshire County Council and the Hampshire Police and Crime Commissioner. [2]
The Liberal Democrats and Conservatives each gained one seat from each other, meaning that the council composition remained the same.
2021 Eastleigh Borough Council election [3] | ||||||||||
---|---|---|---|---|---|---|---|---|---|---|
Party | This election | Full council | This election | |||||||
Seats | Net | Seats % | Other | Total | Total % | Votes | Votes % | +/− | ||
Liberal Democrats | 10 | 83.3 | 22 | 32 | 82.1 | 15,625 | 44.1 | -8.0 | ||
Independent | 1 | 8.3 | 4 | 5 | 12.8 | 1,967 | 5.6 | -0.3 | ||
Conservative | 1 | 8.3 | 1 | 2 | 5.1 | 12,940 | 36.5 | +17.0 | ||
Labour | 0 | 0.0 | 0 | 0 | 0.0 | 4,031 | 11.4 | +4.5 | ||
Green | 0 | 0.0 | 0 | 0 | 0.0 | 602 | 1.7 | -4.3 | ||
Hampshire Independents | 0 | 0.0 | 0 | 0 | 0.0 | 146 | 0.4 | New | ||
Reform UK | 0 | 0.0 | 0 | 0 | 0.0 | 88 | 0.2 | New | ||
TUSC | 0 | 0.0 | 0 | 0 | 0.0 | 38 | 0.1 | New |
Party | Candidate | Votes | % | ±% | |
---|---|---|---|---|---|
Independent | Gin Tidrige | 1,731 | 46.3 | ±0.0 | |
Liberal Democrats | Anne Winstanley | 972 | 26.0 | -11.8 | |
Conservative | Ben Burcombe-Filer | 728 | 19.5 | +13.2 | |
Labour | Steve Phillips | 269 | 7.2 | +3.2 | |
TUSC | Robert Lovell | 38 | 1.0 | N/A | |
Majority | 759 | 20.3 | +9.8 | ||
Turnout | 3,373 | 44.4 | +1.1 | ||
Independent hold | Swing | ||||
Party | Candidate | Votes | % | ±% | |
---|---|---|---|---|---|
Liberal Democrats | Dave Kinloch | 970 | 48.7 | -0.9 | |
Conservative | Joy Haythorne | 854 | 42.9 | +7.2 | |
Labour | Alison Phillips | 166 | 8.3 | +0.3 | |
Majority | 116 | 5.8 | -8.1 | ||
Turnout | 2,012 | 39.0 | -1.6 | ||
Liberal Democrats hold | Swing | ||||
There was no election in Botley in 2019, so changes are shown from 2018.
Party | Candidate | Votes | % | ±% | |
---|---|---|---|---|---|
Liberal Democrats | Steve Holes | 1,442 | 60.6 | -0.6 | |
Conservative | Paul Redding | 723 | 30.4 | +9.9 | |
Labour | Catherine Cronin | 216 | 9.1 | +1.8 | |
Majority | 719 | 30.2 | -10.1 | ||
Turnout | 2,399 | 32.5 | +2.4 | ||
Liberal Democrats hold | Swing | ||||
Party | Candidate | Votes | % | ±% | |
---|---|---|---|---|---|
Liberal Democrats | David Pragnell | 1,745 | 49.8 | -5.0 | |
Conservative | Shelagh Lee | 1,452 | 41.5 | +17.9 | |
Labour | Greg Phillips | 305 | 8.7 | +3.1 | |
Majority | 293 | 8.3 | -22.8 | ||
Turnout | 3,521 | 42.0 | +4.0 | ||
Liberal Democrats hold | Swing | ||||
Party | Candidate | Votes | % | ±% | |
---|---|---|---|---|---|
Liberal Democrats | Wayne Irish | 943 | 37.1 | -12.6 | |
Labour Co-op | Josh Constable | 735 | 28.9 | +11.3 | |
Conservative | Chris Yates | 631 | 24.8 | +13.0 | |
Hampshire Independents | Sukhdev Raj | 146 | 5.7 | N/A | |
Reform UK | Alexander Culley | 88 | 3.5 | N/A | |
Majority | 208 | 8.2 | -23.0 | ||
Turnout | 2,565 | 33.0 | +1.8 | ||
Liberal Democrats hold | Swing | ||||
Party | Candidate | Votes | % | ±% | |
---|---|---|---|---|---|
Liberal Democrats | Tanya Park | 1,140 | 44.3 | -4.9 | |
Conservative | Lisa Crosher | 951 | 37.0 | +25.8 | |
Labour | Kathy O'Neill | 482 | 18.7 | +8.9 | |
Majority | 189 | 7.3 | -29.6 | ||
Turnout | 2,589 | 35.2 | +2.5 | ||
Liberal Democrats hold | Swing | ||||
Party | Candidate | Votes | % | ±% | |
---|---|---|---|---|---|
Liberal Democrats | Alex Bourne | 996 | 42.6 | -12.0 | |
Conservative | Simon Payne | 731 | 31.2 | +18.7 | |
Labour | Sam Jordan | 613 | 26.2 | +9.6 | |
Majority | 265 | 11.4 | -26.4 | ||
Turnout | 2,354 | 29.6 | +1.0 | ||
Liberal Democrats hold | Swing | ||||
Party | Candidate | Votes | % | ±% | |
---|---|---|---|---|---|
Conservative | Steve Broomfield | 1,720 | 48.0 | +20.5 | |
Liberal Democrats | Nick Couldrey | 1,057 | 29.5 | -10.8 | |
Green | Ben Parry | 388 | 10.8 | -3.1 | |
Independent | Martin Lyon | 236 | 6.6 | -6.5 | |
Labour | Jacob Phillips | 179 | 5.0 | -0.2 | |
Majority | 663 | 18.5 | |||
Turnout | 3,598 | 42.8 | +4.3 | ||
Conservative gain from Liberal Democrats | Swing | ||||
Party | Candidate | Votes | % | ±% | |
---|---|---|---|---|---|
Liberal Democrats | Malcolm Cross | 1,771 | 55.9 | -3.2 | |
Conservative | Mike Preston | 1,030 | 32.5 | +16.2 | |
Labour | Hayley Homer | 368 | 11.6 | +5.4 | |
Majority | 741 | 23.4 | -19.1 | ||
Turnout | 3,196 | 39.7 | +4.7 | ||
Liberal Democrats hold | Swing | ||||
Party | Candidate | Votes | % | ±% | |
---|---|---|---|---|---|
Liberal Democrats | Derek Pretty | 1,215 | 49.2 | -10.4 | |
Conservative | Susan Hall | 855 | 34.6 | +16.6 | |
Green | Glynn Fleming | 214 | 8.7 | -0.2 | |
Labour | Steve Willoughby | 187 | 7.6 | +1.0 | |
Majority | 360 | 14.6 | -26.8 | ||
Turnout | 2,486 | 32.6 | +4.5 | ||
Liberal Democrats hold | Swing | ||||
Party | Candidate | Votes | % | ±% | |
---|---|---|---|---|---|
Liberal Democrats | Keith House | 1,779 | 51.9 | -9.7 | |
Conservative | Jerry Hall | 1,412 | 41.2 | +19.4 | |
Labour | Betty Layland | 237 | 6.9 | +2.7 | |
Majority | 367 | 10.7 | -28.8 | ||
Turnout | 3,458 | 39.7 | +4.5 | ||
Liberal Democrats hold | Swing | ||||
Party | Candidate | Votes | % | ±% | |
---|---|---|---|---|---|
Liberal Democrats | Anne Buckley | 1,962 | 48.0 | -2.6 | |
Conservative | Margaret Atkinson | 1,853 | 45.3 | +8.9 | |
Labour | Gwyneth Hubert | 274 | 6.7 | +3.8 | |
Majority | 109 | 2.7 | |||
Turnout | 4,109 | 49.9 | +3.8 | ||
Liberal Democrats gain from Conservative | Swing | ||||
Party | Candidate | Votes | % | ±% | |
---|---|---|---|---|---|
Liberal Democrats | Bhavin Dedhia | 802 | 44.5 | +7.4 | |
Labour Co-op | Josh Constable | 433 | 24.0 | -4.9 | |
Conservative | Simon Payne | 362 | 20.1 | -4.7 | |
Green | Jack Stapleton | 140 | 7.8 | New | |
Reform UK | Clare Fawcett | 64 | 3.6 | +0.1 | |
Majority | 369 | 20.5 | +12.3 | ||
Turnout | 1,801 | 23.9 | -9.1 | ||
Liberal Democrats hold | Swing | +6.2 | |||
The Borough of Eastleigh is a local government district with borough status in Hampshire, England, bordering the unitary authority of Southampton, Test Valley, the City of Winchester and the Borough of Fareham. Eastleigh is separated from the New Forest by Southampton Water. Water bounds much of the borough, with Southampton Water and the River Hamble bordering the east and southwest of the district. The built-up nature of neighbouring Southampton and the urban area around the town of Eastleigh contrast with the rural nature of much of the borough, which lies within the Hampshire Basin.
The Borough of Fareham is a local government district with borough status in Hampshire, England. Its council is based in Fareham. Other places within the borough include Portchester, Hill Head, Sarisbury, Stubbington, Titchfield and Warsash. The borough covers much of the semi-urban area between the cities of Southampton and Portsmouth, and is part of the South Hampshire conurbation. The neighbouring districts are Eastleigh, Winchester, Portsmouth and Gosport. The district's southern boundary is the coast of the Solent.
Winchester, commonly known as the City of Winchester, is a non-metropolitan district in Hampshire, England, with city status.
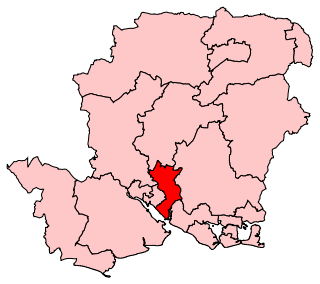
Eastleigh is a constituency represented in the House of Commons of the UK Parliament since 2019 by Paul Holmes, a Conservative.
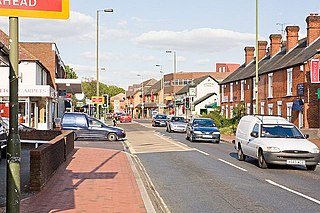
Chandler's Ford is a largely residential area and civil parish in the Borough of Eastleigh in Hampshire, England. It has a population of 21,436 in the 2011 Census.
One-third of Rushmoor Borough Council in Hampshire, England, is elected each year, followed by one year without election. From 1979, the council had 15 three-member wards, reduced to 14 wards in 2002 and 13 in 2012. Each ward elects 3 of the 39 councillors, one in each election year, for a term of four years, except in years when ward boundaries are changed when all councillors are elected for terms depending on their position in the poll.
One third of Eastleigh Borough Council is elected each year, followed by one year without election.
One-third of Runnymede Borough Council in Surrey, England, is elected each year, followed by one year where there is an election to Surrey County Council instead. The council is divided up into 14 wards, electing 41 councillors, since the last boundary changes in 2019.
Milton Keynes City Council is the local authority for the City of Milton Keynes, a unitary authority in Buckinghamshire, England. Until 1 April 1997 it was a non-metropolitan district.
Michael Douglas Thornton is a British politician and former Liberal Democrat Member of Parliament for Eastleigh in Hampshire. He was elected at the Eastleigh by-election held on 28 February 2013, a seat which he lost at the 2015 general election.
One third of Havant Borough Council in Hampshire, England is elected each year, followed by one year without election. Since the last boundary changes in 2002, 38 councillors have been elected from 14 wards.
The 2017 Hampshire County Council election took place on 4 May 2017 as part of the 2017 local elections in the United Kingdom. All councillors were elected from electoral divisions by first-past-the-post voting for a four-year term of office. The electoral divisions were somewhat changed from the previous election, with some being split, merged or with boundary changes. No elections were held in Portsmouth and Southampton, which are unitary authorities and hold their elections in other years. Similarly the districts within Hampshire did also not hold elections this year.
The 2019 Eastleigh Borough Council election took place on 2 May 2019 to elect one third of members of Eastleigh Borough Council. The outcome was a strengthened majority for the incumbent Liberal Democrats who gained two Conservative seats. No election was held in Botley, a two-member ward, this year.
Elections to Hampshire County Council took on 6 May 2021 as part of the 2021 United Kingdom local elections. All 78 seats were up for election, with each ward returning either one or two councillors by first-past-the-post voting for a four-year term of office. This took place at the same time as the elections for the Hampshire Police and Crime Commissioner and district councils.
The 2022 Ealing London Borough Council election took place on 5 May 2022, under new election boundaries, which increased the number of Ealing London Borough Council councillors to 70. The elections took place alongside local elections in the other London boroughs and elections to local authorities across the United Kingdom.
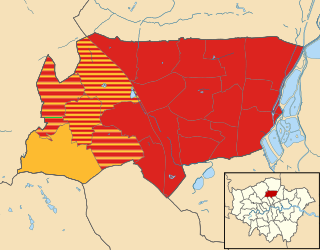
The 2022 Haringey London Borough Council election took place on 5 May 2022. All 57 members of Haringey London Borough Council were elected. The elections took place alongside local elections in the other London boroughs and elections to local authorities across the United Kingdom.
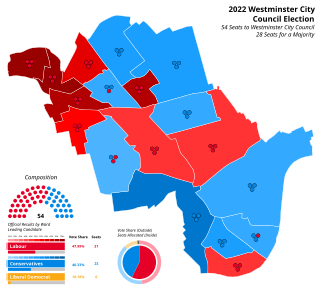
The 2022 Westminster City Councilelection took place on 5 May 2022. All 54 members of Westminster City Council have been elected. The elections took place alongside local elections in the other London boroughs and elections to local authorities across the United Kingdom.
The 2022 St Helens Metropolitan Borough Council election took place on 5 May 2022. Due to boundary changes, all 48 councillors were elected at the same time, with the council moving to a system of all-out elections every four years. The election took place alongside other local elections across the United Kingdom.
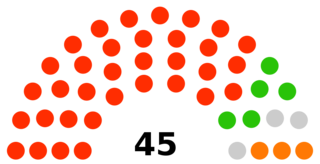
The 2022 Knowsley Metropolitan Borough Council election took place on 5 May 2022. One third of councillors — 15 out of 45 — on Knowsley Metropolitan Borough Council were elected. The election took place alongside other local elections across the United Kingdom.