| ||||||||||||||||||||||||||||
42 out of 42 seats to Chorley Borough Council 22 seats needed for a majority | ||||||||||||||||||||||||||||
---|---|---|---|---|---|---|---|---|---|---|---|---|---|---|---|---|---|---|---|---|---|---|---|---|---|---|---|---|
| ||||||||||||||||||||||||||||
|
Council elections for the Borough of Chorley were held on 6 May 2021 as part of the 2021 United Kingdom local elections.
Due to new boundaries for the district, all wards elected three councillors at this election before returning to its normal cycle of electing a third of councillors each year.
The result was a hold for the ruling Labour group. [1]
The results of the 2021 elections are summarised below. [2]
2021 Chorley Borough Council election | ||||||||||
---|---|---|---|---|---|---|---|---|---|---|
Party | This election | Full council | This election | |||||||
Seats | Net | Seats % | Other | Total | Total % | Votes | Votes % | +/− | ||
Labour | 29 | ![]() | 69.05 | 29 | 29 | 69.04 | 43115 | 49.3 | -3.3 | |
Conservative | 13 | ![]() | 30.95 | 13 | 13 | 30.95 | 34515 | 39.5 | +3.4 | |
Green | 0 | ![]() | 0.0 | 0 | 0 | 0.0 | 6051 | 6.9 | +3.1 | |
Liberal Democrats | 0 | ![]() | 0.0 | 0 | 0 | 0.0 | 1808 | 2.1 | -2.3 | |
Independent | 0 | ![]() | 0.0 | 0 | 0 | 0 | 1768 | 2.0 | +2.0 |
Party | Candidate | Votes | % | ±% | |
---|---|---|---|---|---|
Labour | Kim Snape | 1,436 | 59.6 | ||
Labour | Peter Francis Wilson | 1,232 | 51.1 | ||
Labour | June Molyneaux | 1,205 | 50.0 | ||
Conservative | Jeffrey Johnstone Green | 795 | 33.0 | ||
Conservative | Neil Gardiner Baglow | 790 | 32.8 | ||
Conservative | Paul Edward Lowe | 738 | 30.6 | ||
Green | Sally Felton | 237 | 9.8 | ||
Liberal Democrats | Phillip William Pilling | 167 | 6.9 | ||
Majority | |||||
Turnout | 2,409 | 39.12 | |||
Labour win (new seat) | |||||
Labour win (new seat) |
Party | Candidate | Votes | % | ±% | |
---|---|---|---|---|---|
Conservative | Aidy Riggott | 1,039 | 46.4 | ||
Conservative | John Phillip Walker | 941 | 42.0 | ||
Conservative | Christine Turner | 869 | 38.8 | ||
Labour | Dedrah Cecilia Moss | 837 | 37.4 | ||
Labour | Fiona Mary Gibson | 753 | 33.6 | ||
Labour | Michelle Le Marinel | 677 | 30.2 | ||
Green | Rachel Smith | 256 | 11.4 | ||
Independent | Stuart Anthony Clewlow | 255 | 11.4 | ||
Liberal Democrats | Gail Patricia Ormston | 139 | 6.2 | ||
Liberal Democrats | David Golden | 112 | 5.0 | ||
Liberal Democrats | Rowan Patrick Power | 56 | 2.5 | ||
Independent | Darrell Fisher Dunn | 50 | 2.2 | ||
Majority | |||||
Turnout | 2,240 | 32.46 | |||
Conservative win (new seat) | |||||
Conservative win (new seat) |
Party | Candidate | Votes | % | ±% | |
---|---|---|---|---|---|
Labour | Hasina Khan | 1,070 | 60.6 | ||
Labour | James Steven Nevett | 1,066 | 60.3 | ||
Labour | Zara Khan | 992 | 56.1 | ||
Conservative | Marie Elizabeth Gray | 409 | 23.1 | ||
Conservative | Patricia Mary Houghton | 386 | 21.8 | ||
Conservative | Sandra Mercer | 360 | 20.4 | ||
Green | Carl Antony Nuttall | 227 | 12.8 | ||
Majority | |||||
Turnout | 1,767 | 29.15 | |||
Labour win (new seat) | |||||
Labour win (new seat) |
Party | Candidate | Votes | % | ±% | |
---|---|---|---|---|---|
Labour | Adrian Lowe | 1,054 | 48.5 | ||
Labour | Jean Margaret Sherwood | 953 | 43.9 | ||
Labour | Alistair William Morwood | 899 | 41.4 | ||
Conservative | Grep Chapman | 736 | 33.9 | ||
Conservative | James Andrew Siswick | 710 | 32.7 | ||
Conservative | Stuart Jamieson | 694 | 31.9 | ||
Independent | Mark Perks | 359 | 16.5 | ||
Green | Kath Becker | 332 | 15.3 | ||
Majority | |||||
Turnout | 2,173 | 36.01 | |||
Labour win (new seat) | |||||
Labour win (new seat) |
Party | Candidate | Votes | % | ±% | |
---|---|---|---|---|---|
Labour | Margaret Mary France | 1,513 | 55.4 | ||
Labour | Gordon France | 1,375 | 50.3 | ||
Labour | Jenny Whiffen | 1,137 | 41.6 | ||
Conservative | Peter Malpas | 1,036 | 37.9 | ||
Conservative | Clive Tattum | 937 | 34.3 | ||
Conservative | Greg Morgan | 933 | 34.2 | ||
Green | Finty Maye Royle | 309 | 11.3 | ||
Green | Jon Royle | 239 | 8.8 | ||
Majority | |||||
Turnout | 2,731 | 49.27 | |||
Labour win (new seat) | |||||
Labour win (new seat) |
Party | Candidate | Votes | % | ±% | |
---|---|---|---|---|---|
Labour | Aaron Beaver | 1,352 | 55.0 | ||
Labour | Sarah Elizabeth Jane Ainsworth | 1,338 | 54.5 | ||
Labour | Matthew John Lynch | 1,143 | 46.5 | ||
Conservative | Carole Margaret Billouin | 732 | 29.8 | ||
Conservative | Geoffrey Turner | 707 | 28.8 | ||
Conservative | Mick Muncaster | 702 | 28.6 | ||
Green | Nicola Adshead | 320 | 13.0 | ||
Green | Anne Frances Calderbank | 286 | 11.6 | ||
Green | Mark Worsley Tebbutt | 213 | 8.7 | ||
Majority | |||||
Turnout | 2,456 | 41.37 | |||
Labour win (new seat) | |||||
Labour win (new seat) |
Party | Candidate | Votes | % | ±% | |
---|---|---|---|---|---|
Labour | Alistair Ward Bradley | 1,346 | 57.6 | ||
Labour | Bev Murray | 1,103 | 47.2 | ||
Labour | Samir Kahn | 938 | 40.2 | ||
Conservative | Ryan Anthony Kevin Grogan | 817 | 35.0 | ||
Conservative | Gillian Jamieson | 771 | 33.0 | ||
Conservative | Craig Southern | 624 | 26.7 | ||
Green | Eileen Larysa Hathaway | 233 | 10.0 | ||
Green | Emma Jayne Kilburn | 226 | 9.7 | ||
Green | Martin James Hathaway | 182 | 7.8 | ||
TUSC | Jenny Hurley | 152 | 6.5 | ||
Majority | |||||
Turnout | 2,336 | 35.00 | |||
Labour win (new seat) | |||||
Labour win (new seat) |
Party | Candidate | Votes | % | ±% | |
---|---|---|---|---|---|
Labour | Karen Margaret Derbyshire | 951 | 52.3 | ||
Labour | Roy Lees | 942 | 51.8 | ||
Labour | Terry Howarth | 875 | 48.2 | ||
Conservative | Kevin Michael Brown | 382 | 21.0 | ||
Green | Andy Hunter-Rossall | 380 | 20.9 | ||
Conservative | Susan Margaret Morris | 377 | 20.7 | ||
Green | Olga Maria Gomez-Cash | 350 | 19.3 | ||
Green | Jane Elizabeth Weston | 342 | 18.8 | ||
Conservative | Martin Andrew Topp | 336 | 18.5 | ||
Majority | |||||
Turnout | 1,817 | 33.33 | |||
Labour win (new seat) | |||||
Labour win (new seat) |
Party | Candidate | Votes | % | ±% | |
---|---|---|---|---|---|
Conservative | Alan Cullens | 948 | 38.7 | ||
Conservative | Sam Chapman | 925 | 37.8 | ||
Labour | Peter Alexander Gabbott Peter | 842 | 34.4 | ||
Conservative | Marie Walker | 823 | 33.6 | ||
Labour | Ann Elizabeth Harrison | 703 | 28.7 | ||
Independent | Steve Williams | 579 | 23.7 | ||
Labour | Ryan Lee James Quick | 564 | 23.0 | ||
Independent | Mike Graham | 525 | 21.5 | ||
Green | Jackie Robinson | 292 | 11.9 | ||
Liberal Democrats | Stephen John Fenn | 234 | 9.6 | ||
Majority | |||||
Turnout | 2,447 | 35.70 | |||
Conservative win (new seat) | |||||
Labour win (new seat) |
} } }
Party | Candidate | Votes | % | ±% | |
---|---|---|---|---|---|
Labour | Mark Clifford | 1,415 | 51.2 | ||
Conservative | Magdalene Margaret Cullens | 1,098 | 39.7 | ||
Conservative | William Simmance | 1,052 | 38.1 | ||
Conservative | Jocelyn Mary Morgan | 1,050 | 38.0 | ||
Labour | Yvonne Marie Hargreaves | 957 | 34.6 | ||
Labour | Neville Grant Whitman | 852 | 30.8 | ||
Green | Clare Elizabeth Hales | 379 | 13.7 | ||
Green | Robert Stewart Wade | 270 | 9.8 | ||
Liberal Democrats | Glenda Charlesworth | 230 | 8.3 | ||
Liberal Democrats | Richard Llewellyn Chandler-Jones | 107 | 3.9 | ||
Majority | |||||
Turnout | 2,763 | 42.15 | |||
Labour win (new seat) | |||||
Conservative win (new seat) | |||||
Conservative win (new seat) |
Party | Candidate | Votes | % | ±% | |
---|---|---|---|---|---|
Labour | Alex Martin Hilton | 1,127 | 58.8 | ||
Labour | Julia Louise Berry | 1,110 | 57.9 | ||
Labour | Steve Holgate | 1,047 | 54.6 | ||
Conservative | Paul Leadbetter | 566 | 29.5 | ||
Conservative | Valerie Marie Caunce | 508 | 26.5 | ||
Conservative | Scott Henry Caunce | 505 | 26.3 | ||
Green | Catherine Frances Hunter-Rossall | 159 | 8.3 | ||
Majority | |||||
Turnout | 1,917 | 31.35 | |||
Labour win (new seat) | |||||
Labour win (new seat) |
Party | Candidate | Votes | % | ±% | |
---|---|---|---|---|---|
Conservative | Keith Iddon | 1,555 | 55.8 | ||
Conservative | Martin William Boardman | 1,346 | 48.3 | ||
Conservative | Alan John Platt | 1,307 | 46.9 | ||
Labour | Caroline Elizabeth Turner | 786 | 28.2 | ||
Labour | Paul Mark Sloan | 715 | 25.7 | ||
Labour | Pam Sloan | 669 | 24.0 | ||
Liberal Democrats | John Patrick Wright | 416 | 14.9 | ||
Green | John Clare | 339 | 12.2 | ||
Majority | |||||
Turnout | 2,785 | 44.78 | |||
Conservative win (new seat) |
Party | Candidate | Votes | % | ±% | |
---|---|---|---|---|---|
Labour | Alan Whittaker | 1,294 | 51.1 | ||
Conservative | Harold Heaton | 1,073 | 42.4 | ||
Conservative | John Derek Dalton | 941 | 37.2 | ||
Labour | Martin John Fisher | 893 | 35.3 | ||
Conservative | Andrew Quickfall | 820 | 32.4 | ||
Labour | Gillian Frances Sharples | 719 | 28.4 | ||
Green | Dominique Clare | 267 | 10.6 | ||
Liberal Democrats | Mark Robert Frost | 214 | 8.5 | ||
Majority | |||||
Turnout | 2,530 | 43.80 | |||
Labour win (new seat) | |||||
Conservative win (new seat) | |||||
Conservative win (new seat) |
Party | Candidate | Votes | % | ±% | |
---|---|---|---|---|---|
Labour | Danny Gee | 1,186 | 47.8 | ||
Conservative | Debra Platt | 1,171 | 47.2 | ||
Labour | Tommy Gray | 1,080 | 43.5 | ||
Conservative | Philip Preston | 1,018 | 41.0 | ||
Conservative | Rosemary Russell | 988 | 39.8 | ||
Labour | Catherine Ann Donegan | 969 | 39.0 | ||
Green | Richard Taylor Kilburn | 213 | 8.6 | ||
Liberal Democrats | Diane Elizabeth Curtis | 133 | 5.4 | ||
Majority | |||||
Turnout | 2,482 | 41.88 | |||
Labour win (new seat) | |||||
Conservative win (new seat) | |||||
Labour win (new seat) |
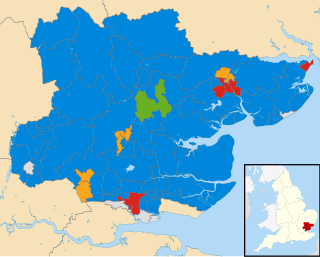
Elections to Essex County Council took place on 4 May 2017 as part of the 2017 local elections. All 75 councillors were elected from 70 electoral divisions, which each returned either one or two councillors by first-past-the-post voting for a four-year term of office.
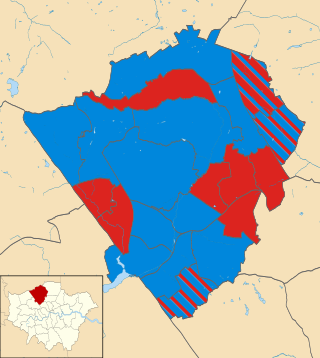
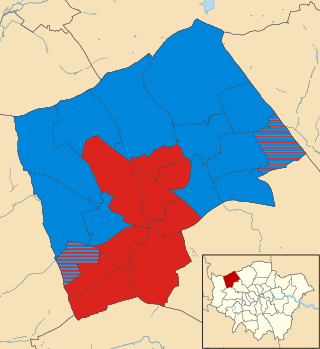
The 2018 Barnet Borough Council election took place on 3 May 2018 to elect members of Barnet Borough Council in England. It took place on the same day as other local elections in 2018. In the last election, the Conservatives won control of the council with 32 seats, compared to 30 for Labour and 1 for the Liberal Democrats. On 15 March 2018, following the resignation of a Conservative councillor, the council was in a state of no overall control. The election on 3 May 2018 saw the Conservatives take back overall control with a majority of 13.
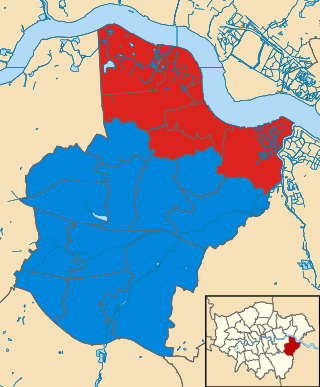
The 2018 Enfield Council election took place on Thursday 3 May 2018 to elect members of Enfield London Borough Council in London, England. The whole council was up for election and the Labour party retained overall control of the council.
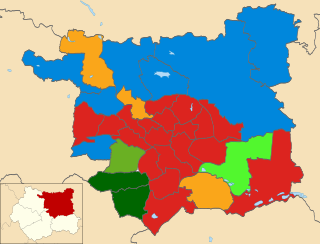
The 2019 Leeds City Council election took place on Thursday 2 May 2019 to elect members of Leeds City Council in England. It was held on the same day as other UK local elections across England and Northern Ireland.
Elections to Manchester City Council were held on 6 May 2021, as part of the 2021 United Kingdom local elections. They were originally scheduled for 2020 but were suspended for a year, due to the COVID-19 pandemic. In 2019 Labour had retained its majority on the council, with 93 seats, with the Liberal Democrats led by former MP John Leech increasing the number of opposition councillors to three, but this had fallen back to two in March 2021 when Councillor Greg Stanton defected to the Labour Party.
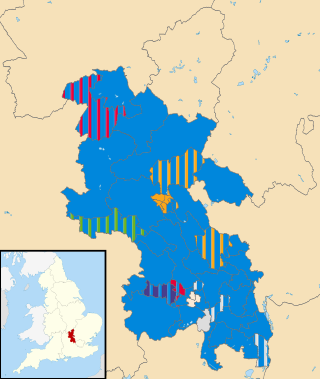
The 2021 Buckinghamshire Council election took place on 6 May 2021, alongside nationwide local elections. The election was originally due to take place in May 2020, but was postponed due to the COVID-19 pandemic.
Elections to Essex County Council took place on 6 May 2021 as part of the 2021 United Kingdom local elections. All 75 councillors were elected from 70 electoral divisions, with each returning either one or two councillors by first-past-the-post voting for a four-year term of office.
The 2022 United Kingdom local elections took place on Thursday 5 May 2022. These included elections for all London borough councils, for all local authorities in Wales and Scotland. Most seats in England were last up for election in 2018 and in Scotland and Wales in 2017. The elections coincided with the 2022 Northern Ireland Assembly election. In 91 cases, most of them in Wales, council seats were uncontested, each having only one candidate. Three seats in Scotland remained unfilled as no one nominated to fill them.
The 2022 Bexley London Borough Council election took place on 5 May 2022. 45 members of Bexley London Borough Council were elected. The elections took place alongside local elections in the other London boroughs and elections to local authorities across the United Kingdom.
In the 2022 Croydon London Borough Council election, on 5 May 2022, all 70 members of Croydon London Borough Council, and the Mayor of Croydon, were up for election. The elections took place alongside the local elections in the other London boroughs and elections to local authorities across the United Kingdom. Jason Perry of the Conservative Party narrowly won the mayoral election.
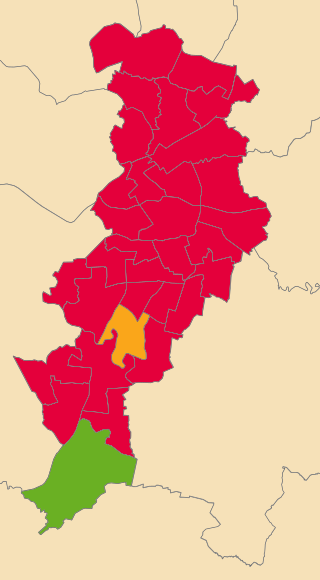
The 2022 Harrow London Borough Council election took place on 5 May 2022. All 55 members of Harrow London Borough Council were elected. The elections took place alongside local elections in the other London boroughs and elections to local authorities across the United Kingdom.
The 2022 Havering London Borough Council election is currently taking place as of 5 May 2022. All 55 members of Havering London Borough Council will be elected. The elections will take place alongside local elections in the other London boroughs and elections to local authorities across the United Kingdom.
The 2022 Hounslow London Borough Council election took place on 5 May 2022. All 62 members of Hounslow London Borough Council were elected. The elections took place alongside local elections in the other London boroughs and elections to local authorities across the United Kingdom.
The 2022 Lambeth London Borough Council election took place on 5 May 2022. All 63 members of Lambeth London Borough Council were elected. The elections took place alongside local elections in the other London boroughs and elections to local authorities across the United Kingdom.
Elections for the London Borough of Merton were held on 5 May 2022 to elect all 57 members of Merton London Borough Council in England. The elections took place alongside local elections in the other London boroughs and elections to local authorities across the United Kingdom.
The 2022 Newham London Borough Council election took place on 5 May 2022. All 66 members of Newham London Borough Council were elected. The election took place alongside local elections in the other London boroughs and elections to local authorities across the United Kingdom.
The 2022 Sutton London Borough Council election took place on 5 May 2022. All 55 members of Sutton London Borough Council were elected. The elections took place alongside local elections in the other London boroughs and elections to local authorities across the United Kingdom.
The 2022 Tower Hamlets London Borough Council election took place on 5 May 2022. All 45 members of Tower Hamlets London Borough Council were elected. The elections took place alongside local elections in the other London boroughs and elections to local authorities across the United Kingdom.
The City of Johannesburg Metropolitan Municipality council consists of 270 City Councillors elected by mixed-member proportional representation. The councillors are divided into two kinds: (a) 135 Ward councillors who have been elected by first-past-the-post voting in 135 wards; and (b) 135 councillors elected from party lists.
The 2022 Manchester City Council election took place on 5 May 2022. One third of councillors on Manchester City Council were elected. This election was a part of the other local elections across the United Kingdom.