| |||||||||||||||||||||||||||||||||||||
16 of the 48 seats to Southampton City Council 25 seats needed for a majority | |||||||||||||||||||||||||||||||||||||
---|---|---|---|---|---|---|---|---|---|---|---|---|---|---|---|---|---|---|---|---|---|---|---|---|---|---|---|---|---|---|---|---|---|---|---|---|---|
| |||||||||||||||||||||||||||||||||||||
Map showing the results of the 2021 Southampton City Council election | |||||||||||||||||||||||||||||||||||||
|
The 2021 Southampton City Council election took place in on 6 May 2021, on the same day as other local elections, [1] to elect members of Southampton City Council. [2] The election was originally due to take place in May 2020, to elect to the seats of councillors last elected in 2016, but was postponed due to the COVID-19 pandemic. [3]
Council elections for the Southampton City Council were last held on 2 May 2019 as part of the 2019 United Kingdom local elections. The 2019 Southampton City Council election resulted in an increased number of seats for the Labour Party, from 26 to 29.
All locally registered electors (British, Irish, Commonwealth and European Union citizens) who are aged 18 or over on polling day were entitled to vote in the local elections.
The Statement of Persons Nominated was published on Friday 9 April 2021. [4]
The Conservatives gained 6 seats from the Labour Party and one seat from an Independent giving them a total of 25 seats on the new council, as compared with 23 seats for Labour. This gave the Conservative Party control of the council for the first time since 2012.
In the Ward results which appear below, increases/decreases in shares of the vote, and resultant swings, are calculated by reference to the 2016 election, when these seats were last fought.
2021 Southampton City Council election | ||||||||||
---|---|---|---|---|---|---|---|---|---|---|
Party | This election | Full council | This election | |||||||
Seats | Net | Seats % | Other | Total | Total % | Votes | Votes % | +/− | ||
Conservative | 11 | 7 | 68.8 | 14 | 25 | 52.1 | 24,119 | 42.8 | +11.5 | |
Labour | 5 | 6 | 31.3 | 18 | 23 | 47.9 | 21,281 | 37.8 | -3.9 | |
Green | 0 | 0.0 | 0 | 0 | 0.0 | 5,118 | 9.1 | +3.0 | ||
Liberal Democrats | 0 | 0.0 | 0 | 0 | 0.0 | 4,760 | 8.5 | +1.5 | ||
TUSC | 0 | 0.0 | 0 | 0 | 0.0 | 590 | 1.0 | -0.9 | ||
Independent | 0 | 1 | 0.0 | 0 | 0 | 0.0 | 281 | 0.5 | -3.6 | |
Hampshire Independents | 0 | 0.0 | 0 | 0 | 0.0 | 98 | 0.2 | New | ||
Reform UK | 0 | 0.0 | 0 | 0 | 0.0 | 61 | 0.1 | New |
Party | Candidate | Votes | % | ±% | |
---|---|---|---|---|---|
Labour Co-op | Darren Paffey | 1,493 | 46.0 | -0.5 | |
Conservative | Charles Perez-Storey | 992 | 30.6 | -0.8 | |
Green | Joe Cox | 338 | 10.4 | +2.4 | |
Liberal Democrats | Josh Smith | 214 | 6.6 | +1.6 | |
Hampshire Independents | Kim Rose | 98 | 3.0 | N/A | |
TUSC | Graham Henry | 66 | 2.0 | N/A | |
Majority | 501 | 15.4 | |||
Turnout | 3,244 | 24.14 | +1.75 | ||
Labour hold | Swing | +0.2 | |||
Party | Candidate | Votes | % | ±% | |
---|---|---|---|---|---|
Conservative | John Hannides | 1,795 | 44.4 | -3.0 | |
Liberal Democrats | Richard Blackman | 1,373 | 34.0 | +0.6 | |
Labour | Ashley Minto | 614 | 15.2 | -2.6 | |
Green | Steve Gore | 204 | 5.0 | -1.7 | |
TUSC | Mike Marx | 24 | 0.6 | -0.3 | |
Majority | 422 | 10.4 | |||
Turnout | 4,041 | 40.42 | +9.22 | ||
Conservative hold | Swing | -6.9 | |||
Party | Candidate | Votes | % | ±% | |
---|---|---|---|---|---|
Labour | Mike Denness | 1,914 | 58.4 | -10.8 | |
Conservative | Michaela Dowse | 517 | 15.8 | +4.0 | |
Green | Ronald Meldrum | 329 | 10.0 | +2.4 | |
No description | Sam Shahid | 281 | 8.6 | N/A | |
Liberal Democrats | Vijay Chopra | 167 | 5.1 | +1.0 | |
TUSC | Larry Kazingizi | 40 | 1.2 | +0.1 | |
Majority | 1,397 | 42.6 | |||
Turnout | 3,279 | 27.53 | +1.13 | ||
Labour hold | Swing | -7.4 | |||
Party | Candidate | Votes | % | ±% | |
---|---|---|---|---|---|
Conservative | Matt Magee | 1,642 | 55.5 | +17.3 | |
Labour | Andy Frampton | 999 | 33.7 | -0.1 | |
Green | Michael Mawle | 182 | 6.1 | -1.3 | |
Liberal Democrats | Alex Clifton-Melhuish | 116 | 3.9 | -1.2 | |
Majority | 643 | 21.8 | |||
Turnout | 2,961 | 29.44 | +1.53 | ||
Conservative gain from Labour | Swing | +8.7 | |||
Party | Candidate | Votes | % | ±% | |
---|---|---|---|---|---|
Conservative | Ivan White | 1,927 | 49.0 | +7.0 | |
Labour | Victoria Ugwoeme | 1,213 | 30.9 | -5.8 | |
Green | Lindsi Bluemel | 533 | 13.6 | +3.3 | |
Liberal Democrats | Debbie Adebayo | 229 | 5.8 | -2.0 | |
Majority | 714 | 18.1 | |||
Turnout | 3,929 | 37.68 | +5.58 | ||
Conservative hold | Swing | +6.4 | |||
Party | Candidate | Votes | % | ±% | |
---|---|---|---|---|---|
Conservative | Diana Galton | 1,723 | 52.4 | +40.8 | |
Labour | Amanda Ford | 1,090 | 33.1 | +6.0 | |
Liberal Democrats | Sam Chapman | 229 | 7.0 | +3.7 | |
Green | Joelle Hawes | 162 | 4.9 | +2.8 | |
TUSC | Maggie Fricker | 63 | 1.9 | N/A | |
Majority | 633 | 19.3 | |||
Turnout | 3,291 | 32.08 | -1.1 | ||
Conservative gain from Independent | Swing | +17.4 | |||
Party | Candidate | Votes | % | ±% | |
---|---|---|---|---|---|
Labour Co-op | David Shields | 1,728 | 45.7 | -1.6 | |
Conservative | Vikkie Cheng | 1,201 | 31.8 | +0.8 | |
Green | Laura Crawford | 420 | 11.1 | +3.6 | |
Liberal Democrats | Andrew Beal | 292 | 7.7 | +2.5 | |
Reform UK | Guy Ireland | 61 | 1.6 | N/A | |
TUSC | Catherine Clarke | 58 | 1.5 | N/A | |
Majority | 527 | 13.9 | |||
Turnout | 3,781 | 32.59 | -0.5 | ||
Labour hold | Swing | -1.2 | |||
Party | Candidate | Votes | % | ±% | |
---|---|---|---|---|---|
Conservative | Peter Baillie | 2,020 | 56.3 | +9.8 | |
Labour Co-op | Alan Lloyd | 1,221 | 34.0 | +1.9 | |
Green | Chris Bluemel | 220 | 6.1 | -1.4 | |
Liberal Democrats | Catrine McDougall | 117 | 3.3 | -2.9 | |
Majority | 799 | 22.3 | |||
Turnout | 3,590 | 34.13 | +2.0 | ||
Conservative hold | Swing | +4.0 | |||
Party | Candidate | Votes | % | ±% | |
---|---|---|---|---|---|
Conservative | Jeremy Moulton | 1,804 | 49.7 | +13.3 | |
Labour Co-op | Lisa Fricker | 1,314 | 36.2 | -5.2 | |
Green | Jonathan Bean | 326 | 9.0 | +4.8 | |
Liberal Democrats | Nicholas McGeorge | 159 | 4.4 | -0.2 | |
Majority | 490 | 13.5 | |||
Turnout | 3,632 | 32.60 | -1.4 | ||
Conservative gain from Labour | Swing | +9.3 | |||
Party | Candidate | Votes | % | ±% | |
---|---|---|---|---|---|
Conservative | Joshua Payne | 1,910 | 47.5 | +15.5 | |
Labour | Eamonn Keogh | 1,696 | 42.2 | -2.8 | |
Green | Rosanna Newey | 193 | 4.8 | +0.4 | |
Liberal Democrats | Robert Naish | 166 | 4.1 | -0.8 | |
TUSC | Bevis Fenner | 35 | 0.9 | +0.3 | |
Majority | 214 | 5.3 | |||
Turnout | 4,020 | 38.45 | +2.7 | ||
Conservative gain from Labour | Swing | +9.2 | |||
Party | Candidate | Votes | % | ±% | |
---|---|---|---|---|---|
Labour | John Savage | 1,455 | 36.4 | +3.1 | |
Green | Katherine Barbour | 1,082 | 27.1 | +17.7 | |
Liberal Democrats | James Read | 718 | 18.0 | -6.8 | |
Conservative | Calvin Smith | 670 | 16.8 | -8.8 | |
TUSC | Tony Twine | 39 | 1.0 | 0 | |
Majority | 373 | 9.3 | |||
Turnout | 3,996 | 36.86 | +4.4 | ||
Labour hold | Swing | -7.3 | |||
Party | Candidate | Votes | % | ±% | |
---|---|---|---|---|---|
Conservative | Amanda Guest | 1,577 | 47.1 | +32.7 | |
Labour | Lee Whitbread | 1,480 | 44.2 | -2.2 | |
Green | Kathryn Cook | 116 | 3.5 | +1.0 | |
Liberal Democrats | Simon Stokes | 102 | 3.0 | -0.3 | |
TUSC | Peter Wyatt | 48 | 1.4 | N/A | |
Majority | 97 | 2.9 | |||
Turnout | 3,348 | 30.18 | +1.2 | ||
Conservative gain from Labour | Swing | +17.5 | |||
Party | Candidate | Votes | % | ±% | |
---|---|---|---|---|---|
Labour | Mark Chaloner | 1,790 | 42.9 | -3.3 | |
Conservative | Andrew Hetherton | 1,558 | 37.2 | +9.9 | |
Liberal Democrats | Colin McDougall | 409 | 9.8 | +3.8 | |
Green | Lucy Mundell | 341 | 8.2 | +3.5 | |
TUSC | Andrew Howe | 40 | 1.0 | N/A | |
Majority | 232 | 5.7 | |||
Turnout | 4,171 | 39.30 | -1.9 | ||
Labour hold | Swing | -6.6 | |||
Party | Candidate | Votes | % | ±% | |
---|---|---|---|---|---|
Conservative | James Baillie | 2,163 | 61.4 | +21.1 | |
Labour | Elaine Fullaway | 995 | 28.2 | -7.7 | |
Green | Helen Makrakis | 197 | 5.6 | +2.3 | |
Liberal Democrats | Roland Dauncey | 128 | 3.6 | +0.5 | |
TUSC | Declan Clune | 65 | 1.8 | +0.4 | |
Majority | 1,168 | 33.2 | |||
Turnout | 3,524 | 32.86 | -1.1 | ||
Conservative hold | Swing | +14.4 | |||
Party | Candidate | Votes | % | ±% | |
---|---|---|---|---|---|
Conservative | Spiros Vassiliou | 1,046 | 40.3 | +11.5 | |
Labour Co-op | Sharon Mintoff | 1,026 | 39.5 | -8.1 | |
Green | Angela Cotton | 265 | 10.2 | +0.2 | |
Liberal Democrats | Sarah Wood | 194 | 7.5 | -1.0 | |
TUSC | Nick Chaffey | 38 | 1.5 | -2.7 | |
Majority | 20 | 0.8 | |||
Turnout | 2,596 | 30.52 | +1.8 | ||
Conservative gain from Labour | Swing | +9.8 | |||
Party | Candidate | Votes | % | ±% | |
---|---|---|---|---|---|
Conservative | Rob Stead | 1,584 | 48.1 | +23.6 | |
Labour | Sue Blatchford | 1,253 | 38.1 | -11.5 | |
Green | Clive Hillman | 210 | 6.4 | -1.1 | |
Liberal Democrats | Colin Bleach | 147 | 4.5 | -5.0 | |
TUSC | Sue Atkins | 74 | 2.2 | -5.3 | |
Majority | 331 | 10.0 | |||
Turnout | 3,293 | 29.34 | +1.0 | ||
Conservative gain from Labour | Swing | +17.6 | |||
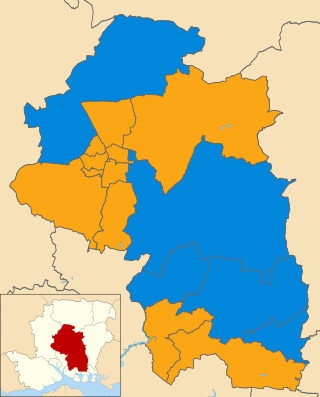
An election to Cambridgeshire County Council took place on 2 May 2013 as part of the 2013 United Kingdom local elections. 69 councillors were elected from 60 electoral divisions, which returned either one or two county councillors each by first-past-the-post voting for a four-year term of office. The electoral divisions were the same as those used at the previous election in 2009. No elections were held in Peterborough, which is a unitary authority outside the area covered by the County Council. The election saw the Conservative Party lose overall control of the council.
Local elections in parts of the United Kingdom were held on Thursday 2 May 2019, with 248 English local councils, six directly elected mayors in England, and all 11 local councils in Northern Ireland being contested.
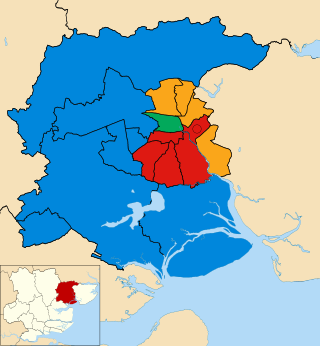
Elections to Southampton City Council took place on Thursday 2 May 2019, alongside other local elections across the country. The Labour Party held a narrow majority of two at the last election and the seats contested in this election were last contested in 2015. Labour were defending 6 seats, the Conservatives were defending 8, whilst independent councillors, who held two seats, were not standing re-elections. Following a by-election in the Coxford ward where Labour gained the seat formerly held by an independent.
Elections to Winchester City Council took place on Thursday 2 May 2019, alongside other local elections across the country. The Conservatives Party held a narrow majority of one at the last election, with the seats contested in this election being last contested in 2016 election. The Conservatives defended 10 seats, whilst the Liberal Democrats defended 4. Town and parish councils in the city boundary were also up for election.
Elections of police and crime commissioners in England and Wales were held on 6 May 2021, on the same day as the Senedd election in Wales and the local elections in England. This was the third time police and crime commissioner elections have been held. The elections were originally due to take place in May 2020 but were postponed by 12 months in view of the COVID-19 pandemic. Turnout was an average of 33.2% across the elections, with Wales having much higher turnout.
The 2021 Wigan Metropolitan Borough Council election took place on 6 May 2021 to elect members of Wigan Metropolitan Borough Council in England. This election was held on the same day as other local elections. The election was originally due to take place on 7 May 2020, but was postponed due to the COVID-19 pandemic. A by-election was held on the same day in Orrell ward to fill the seat left vacant by the death of Conservative councillor Richard Clayton.
Elections to Ipswich Borough Council were held on 6 May 2021. The elections included the seats that were planned to be elected on 7 May 2020, but were postponed due to the COVID-19 pandemic. Usually 16 seats – one in each of the 16 wards – are contested at each election. However, due to the resignation of former Labour Councillor and Mayor Jan Parry in Holywells ward, as well as Conservative Councillor Robin Vickery in Castle Hill, two by-elections were held on the same day. Thus, 18 seats were up for election.
Elections to Hampshire County Council took on 6 May 2021 as part of the 2021 United Kingdom local elections. All 78 seats were up for election, with each ward returning either one or two councillors by first-past-the-post voting for a four-year term of office. This took place at the same time as the elections for the Hampshire Police and Crime Commissioner and district councils.
The 2022 North Yorkshire Council election took place on 5 May 2022, alongside the other local elections. These will be the last elections to North Yorkshire County Council, and the elected councillors will also serve as the first councillors on the North Yorkshire Council, which will replace the existing county council in April 2023.
Elections to Basingstoke and Deane Borough Council took place on 6 May 2021 as part of the 2021 United Kingdom local elections. They took place at the same time as the elections for Hampshire County Council and the Hampshire Police and Crime Commissioner.
The 2022 Bexley London Borough Council election is currently taking place as of 5 May 2022. All 45 members of Bexley London Borough Council will be elected. The elections will take place alongside local elections in the other London boroughs and elections to local authorities across the United Kingdom.
The 2022 Camden London Borough Council election took place on 5 May 2022. All 55 members of Camden London Borough Council were elected. The elections took place alongside local elections in the other London boroughs and elections to local authorities across the United Kingdom.
The 2022 Bolton Metropolitan Borough Council election took place on 5 May 2022. One third of councillors—20 out of 60—were be elected. The election took place alongside other local elections across the United Kingdom.
The 2022 Coventry City Council election is currently taking place as of 5 May 2022. One third of councillors—18 out of 54—on Coventry City Council will be elected. The election will take place alongside other local elections across the United Kingdom.
The 2022 Salford City Council election took place on 5 May 2022 along with other local elections across the United Kingdom. One third—20 out of 60—of councillor seats on Salford City Council were up for election.
The 2022 Tameside Metropolitan Borough Council election took place on 5 May 2022 to elect members of Tameside Metropolitan Borough Council. This was on the same day as other local elections. 19 of the 57 seats were up for election.
The 2022 Walsall Metropolitan Borough Council election took place on 5 May 2022 to elect members of Walsall Council. This was on the same day as other local elections. 21 of the 60 seats were up for election, with 1 ward electing 2 councillors.
The 2022 Wakefield Metropolitan District Council election took place on 5 May 2022 to elect members of Wakefield Council. This was on the same day as other local elections. 21 of the 63 seats were up for election.
The 2022 Hastings Borough Council election took place on 5 May 2022 to elect members of Hastings Borough Council. This was on the same day as other local elections. 16 of the 32 seats were up for election.
The 2022 Crawley Borough Council took place on 5 May 2022 to elect members of Crawley Borough Council. This is on the same day as other local elections. 12 of the 36 seats were up for election.