2009 Hampshire County Council election

Last updated

2009 Hampshire County Council election
Flag of England.svg
  2005 4 June 2009 2013  

All 78 seats to Hampshire County Council
40 seats needed for a majority
 First partySecond party
 
Party Conservative Liberal Democrats
Seats won5125
Seat changeIncrease2.svg5Decrease2.svg3

Hampshire wards 2009.svg
2009 local election results in Hampshire

Council control before election

Conservative

Council control after election

Conservative

An election to Hampshire County Council took place on 4 June 2009 as part of the 2009 United Kingdom local elections, having been delayed from 7 May, to coincide with elections to the European Parliament. [1] 78 councillors were elected from 75 electoral divisions, which returned either one or two county councillors each by first-past-the-post voting for a four-year term of office. The electoral divisions were the same as those used at the previous election in 2005. Elections in Portsmouth and Southampton do not coincide with this set, being unitary authorities outside the area covered by the County Council.

Contents

All locally registered electors (British, Irish, Commonwealth and European Union citizens) who were aged 18 or over on Thursday 2 May 2009 were entitled to vote in the local elections. Those who were temporarily away from their ordinary address (for example, away working, on holiday, in student accommodation or in hospital) were also entitled to vote in the local elections, [2] although those who had moved abroad and registered as overseas electors cannot vote in the local elections. It is possible to register to vote at more than one address (such as a university student who had a term-time address and lives at home during holidays) at the discretion of the local Electoral Register Office, but it remains an offence to vote more than once in the same local government election. [3]

Summary

The election saw the Conservatives retain control of the council and increase their majority from 14 seats to 24 seats. As the largest opposition party, the Liberal Democrats lost seats overall, while Labour were reduced to holding just one seat (Basingstoke North). The Community Campaign in Hart also won a seat in Church Crookham and Ewshot.

Results

Hampshire County Council election, 2009 [4] [5] [6]
PartySeatsGainsLossesNet gain/lossSeats %Votes %Votes+/−
  Conservative 5172+565.447.72192900+4.03
  Liberal Democrats 2525-332.132.89132975-3.12
  Labour 103-31.37.0728591-10.25
  CCH 110+11.30.953822N/A
  UKIP 000005.9223949+5.17
  Independent 000001.867504+1.25
  Green 000001.726947+0.28
  English Democrat 000001.044200+0.97
  No Party 000000.492001+0.38
  BNP 000000.341386N/A

Results by district

Hampshire County Council is split into 11 Districts, each district is further split into wards, the following are the results for these wards.

Basingstoke and Deane

Basingstoke and Deane Basingstoke and Deane UK locator map.svg
Basingstoke and Deane


Basingstoke Central
PartyCandidateVotes%±%
Liberal Democrats Ronald Hussey191243.10+9.73
Conservative Paul Miller130029.31+0.07
Labour Sean Keating97021.87-15.52
No PartyMichael Brooke2545.73+5.73
Majority61213.79
Turnout 443632.92-28.10
Liberal Democrats gain from Labour Swing +12.62
Basingstoke North
PartyCandidateVotes%±%
Labour Jane Frankum172647.63
Conservative Christopher Aldous106229.30
Liberal Democrats Janice Spalding52614.51
No PartyRebecca Butcher3108.55
Majority66418.33
Turnout 362428.35-28.20
Labour hold Swing
Basingstoke North West
PartyCandidateVotes%±%
Conservative Stephen Reid174555.19
Labour Andy McCormick63219.99
Liberal Democrats Michael Berwick-Gooding47515.02
No PartyChristine Heath3109.80
Majority111335.20
Turnout 316230.45-27.15
Conservative hold Swing
Basingstoke South East
PartyCandidateVotes%±%
Liberal Democrats Brian Gurden245459.74
Conservative Nalin Jayawardena126530.79
Labour Mike Stockwell3899.47
Majority118928.95
Turnout 410833.68-27.17
Liberal Democrats hold Swing
Basingstoke South West
PartyCandidateVotes%±%
Conservative Rita Burgess290061.90
No PartyPhilip Heath74515.90
Liberal Democrats Kevin Harkess66214.13
Labour Paul Frankum3788.07
Majority215546
Turnout 468535.07-32.69
Conservative hold Swing
Calleva and Kingsclere
PartyCandidateVotes%±%
Conservative Keith Chapman393172.46
Liberal Democrats Roger Ward111620.57
Labour Steve Rothman3786.97
Majority281551.89
Turnout 542541.72-29.43
Conservative hold Swing
Candovers
PartyCandidateVotes%±%
Conservative Anna McNair Scott270954.15
Independent Ian Tilbury123824.75
Liberal Democrats Jeff Teagle79815.95
Labour Susan Dady2585.16
Majority147129.4
Turnout 500344.45-27.9
Conservative hold Swing
Loddon
PartyCandidateVotes%±%
Conservative Elaine Still313464.49
Liberal Democrats Stephen Day117024.07
Labour Colin Regan3046.26
No PartyAlex MacDonald2525.19
Majority196440.42
Turnout 486037.3-32.66
Conservative hold Swing
Tadley and Baughurst
PartyCandidateVotes%±%
Conservative Marilyn Tucker202148.61
Liberal Democrats Warwick Lovegrove198147.64
Labour Rick Dady1563.75
Majority400.97
Turnout 415838.91-25.76
Conservative hold Swing
Whitchurch and Clere
PartyCandidateVotes%±%
Conservative Tom Thacker269655.46
Liberal Democrats Keith Watts152731.41
UKIP George Garton48610.00
Labour Criss Connor1523.13
Majority116924.05
Turnout 486146.25-24.49
Conservative hold Swing

Eastleigh

Eastleigh Eastleigh UK locator map.svg
Eastleigh
Bishopstoke and Fair Oak
PartyCandidateVotes%±%
Liberal Democrats Angela May Roling230047.10
Conservative Chris Rhodes133827.40
UKIP Hugh McGuinness89218.27
Labour Wendy Borrill3537.23
Majority96219.7
Turnout 488337.12-30.97
Liberal Democrats hold Swing
Botley and Hedge End
PartyCandidateVotes%±%
Liberal Democrats Rupert Gregory Miles Kyrle300148.08
Conservative Jerry Hall240238.48
UKIP Beryl Alice Humphrey67010.73
Labour Geoffrey Kosted1692.71
Majority5999.60
Turnout 624243.73-24.13
Liberal Democrats hold Swing
Chandlers Ford
PartyCandidateVotes%±%
Conservative Colin Davidovitz286051.29
Liberal Democrats Terry Holden-Brown192834.58
UKIP Paul Michael Webber57310.28
Labour Kevin Richard Butt2153.86
Majority93216.71
Turnout 557646.77-26.81
Conservative hold Swing
Eastleigh East
PartyCandidateVotes%±%
Liberal Democrats Christopher Thomas188745.40
Conservative Richard Uren96623.24
UKIP Caroline Bradbeer82919.95
Labour Peter Luffman47411.41
Majority92122.16
Turnout 415632.96-30.49
Liberal Democrats hold Swing
Eastleigh West
PartyCandidateVotes%±%
Liberal Democrats Alan Broadhurst207446.20
Conservative Judith Grajewski115925.82
UKIP Ann Bays74016.48
Labour Sue Parkinson51611.49
Majority448932.26
Turnout 448932.4-31.13
Liberal Democrats hold Swing
Hamble
PartyCandidateVotes%±%
Liberal Democrats Keith House289853.50
Conservative John Milne159929.52
UKIP Mark Collins73313.53
Labour Ted White1873.45
Majority541738.29
Turnout 541738.5-26.18
Liberal Democrats hold Swing
West End and Hedge End Grange Park
PartyCandidateVotes%±%
Liberal Democrats Bruce Tennent242352.40
Conservative Martin Briggs143831.10
UKIP Martin Lyon55011.89
Labour Nancy Smith2134.61
Majority98521.30
Turnout 462434.37-32.09
Liberal Democrats hold Swing

East Hampshire

East Hampshire East Hampshire UK locator map.svg
East Hampshire
Alton Rural
PartyCandidateVotes%±%
Conservative Mark Kemp-Gee403170.04
Liberal Democrats Jacky Powers146425.44
Labour Jan Treacher2604.52
Majority256744.6
Turnout 575543.37-31.06
Conservative hold Swing
Alton Town
PartyCandidateVotes%±%
Conservative Andrew Joy219147.38
Liberal Democrats Tony Ludlow210745.57
Labour Barbara Burfoot3267.05
Majority841.81
Turnout 462435.00-29.28
Conservative gain from Liberal Democrats Swing
Bordon, Whitehill and Lindford
PartyCandidateVotes%±%
Liberal Democrats Adam Carew211164.81
Conservative Yvonne Parker-Smith103831.87
Labour Melanie Onn 1083.32
Majority107332.94
Turnout 325727.77-26.78
Liberal Democrats hold Swing
Catherington
PartyCandidateVotes%±%
Liberal Democrats Sam Payne237546.32
Conservative Dave Harvey201539.30
English Democrat Pat Harris3356.53
Independent Eunice Byrom2855.56
Labour Kenneth Monks1172.28
Majority3607.02
Turnout 512741.52-26.51
Liberal Democrats gain from Conservative Swing
Headley
PartyCandidateVotes%±%
Conservative Sam James284963.65
Liberal Democrats Richard Clifford139331.12
Labour John Tough2345.23
Majority145632.53
Turnout 447635.29-30.95
Conservative hold Swing
Petersfield Butser
PartyCandidateVotes%±%
Conservative John West280055.16
Liberal Democrats Judith Rodgers194638.34
Labour Bill Organ3306.50
Majority85416.82
Turnout 507639.09-27.57
Conservative gain from Liberal Democrats Swing
Petersfield Hangers
PartyCandidateVotes%±%
Conservative Clarke Vaughan334068.32
Liberal Democrats Roger Mullenger131426.88
Labour Wendy Godber2354.81
Majority202641.44
Turnout 488941.49-29.43
Conservative hold Swing

Fareham

Fareham Fareham UK locator map.svg
Fareham
Fareham Crofton
PartyCandidateVotes%±%
Conservative Tim Knight315158.47+7.31
Liberal Democrats Craig Lewis131724.44-8.98
UKIP Frederick Estall4388.13+8.13
Green John Vivian3095.73+5.73
Labour Cameron Crouchman1743.23-12.19
Majority183434.03
Turnout 538946.36-25.04
Conservative hold Swing
Fareham Portchester
PartyCandidateVotes%±%
Liberal Democrats Roger Price284147.41
Conservative Nick Gregory167327.92
Labour Richard Ryan3646.07
BNP Roger Knight3115.19
English Democrat Alan Chapman2023.37
Majority116819.49
Turnout 599241.28-26.65
Liberal Democrats hold Swing
Fareham Sarisbury
PartyCandidateVotes%±%
Conservative Sean Woodward266164.14
Liberal Democrats Martin Haysom53312.85
UKIP Vivienne Young47611.47
Green Iain Maclennan2796.72
Labour Brenda Caines2004.82
Majority212851.29
Turnout 414937.06-29.96
Conservative hold Swing
Fareham Titchfield
PartyCandidateVotes%±%
Conservative Geoff Hockley203745.83
Liberal Democrats Jack Englefield145132.64
UKIP Geoff Townley53011.92
Green Peter Doggett2475.56
Labour Michael Prior1804.05
Majority58613.19
Turnout 444540.39-26.3
Conservative hold Swing
Fareham Town (2)
PartyCandidateVotes%±%
Conservative John Bryant509224.93
Conservative Raymond Ellis445121.80
Liberal Democrats Katrina Trott281913.80
Liberal Democrats Jim Murray269513.20
UKIP Steve Richards16658.15
UKIP Graeme Young13926.82
Green David Harrison10625.20
Labour Les Ricketts6313.09
Labour Stuart Rose6153.01
Turnout 1102039.74-25.43
Conservative hold Swing
Fareham Warsash
PartyCandidateVotes%±%
Conservative Keith Evans276760.48+5.11
UKIP John Claydon68014.86+14.86
Liberal Democrats David Savage54511.91-9.78
Green Linda Maclennan3387.39+7.39
Labour James Carr2455.36-12.28
Majority208745.62
Turnout 457541.06-28.64
Conservative hold Swing

Gosport

Gosport Gosport UK locator map.svg
Gosport
Bridgemary
PartyCandidateVotes%±%
Conservative Michael Geddes144936.94
Labour Dennis Wright125431.97
English Democrat Bob Shaw68917.56
Liberal Democrats Cyril Simpson3057.77
Green Jane Staffieri2265.76
Majority1954.97
Turnout 392331.71-26.6
Conservative gain from Labour Swing
Hardway
PartyCandidateVotes%±%
Liberal Democrats Peter Chegwyn166849.23
Conservative Mark Hook132839.20
Labour Stephen Williams39211.57
Majority34010.03
Turnout 338830.37-27.79
Liberal Democrats gain from The Liberal Democrat Local Resident
Lee
PartyCandidateVotes%±%
Conservative Margaret Snaith262065.86
Liberal Democrats Paul Keeley102625.79
Labour Peter Bell3328.35
Majority159440.07
Turnout 397829.68-26.54
Conservative hold Swing
Leesland and Town (2)
PartyCandidateVotes%±%
Conservative Peter Edgar450228.89
Conservative Christopher Carter388224.91
Liberal Democrats Keith Gill156610.05
Liberal Democrats George Morby11937.66
Independent Brian Hart10856.96
Green Terry Mitchell9816.30
English Democrat Fungus Addams9726.24
Labour Graham Giles7815.01
Labour Jock Train6193.97
Turnout 843934.55-27.29
Conservative hold Swing
Conservative gain from Liberal Democrats Swing

Hart

Hart Hart UK locator map.svg
Hart
Church Crookham and Ewshot
PartyCandidateVotes%±%
CCH Jenny Radley382266.54
Conservative Pritpal Singh174430.88
Labour Jim White1482.58
Majority204835.66
Turnout 574444.66-21.96
CCH gain from Conservative Swing
Fleet
PartyCandidateVotes%±%
Conservative Sharyn Wheale362461.16
Independent Denis Gotel196433.15
Labour John Davies3375.69
Majority166028.01
Turnout 592539.36-27.11
Conservative hold Swing
Hartley Wintney, Eversley and Yateley West
PartyCandidateVotes%±%
Liberal Democrats David Simpson236142.18
Conservative Sara Kinnell228840.88
Independent Roger Robertson5999.99
BNP Geoffrey Crompton2223.97
Labour Joyce Still1672.98
Majority731.30
Turnout 559741.74-23.59
Liberal Democrats hold Swing
Odiham
PartyCandidateVotes%±%
Conservative Jonathan Glen345868.03
Liberal Democrats Graham Cockarill102920.24
BNP Jerry Owen3246.37
Labour Sean Clarke2725.35
Majority242947.79
Turnout 508339.12-28.23
Conservative hold Swing
Yateley East, Blackwater and Ancells
PartyCandidateVotes%±%
Liberal Democrats Adrian Collett301562.64
Conservative Edward Dawson161533.55
Labour Barry Jones1833.80
Majority140029.09
Turnout 481335.97-28.82
Liberal Democrats hold Swing

Havant

Havant Havant UK locator map.svg
Havant
Bedhampton and Leigh Park (2)
PartyCandidateVotes%±%
Liberal Democrats Ann Buckley253118.28
Conservative Liz Fairhurst236317.06
Conservative Ken Smith232216.77
Liberal Democrats Susan Stocker179112.93
UKIP Ray Finch 141410.21
Labour Richard Brown11067.99
Labour Jim Phillips8846.38
English Democrat George Herbert7795.63
Green Tim Dawes6584.75
Turnout 74.1528.55-25.95
Liberal Democrats hold Swing
Conservative gain from Labour Swing
Cowplain and Hart Plain
PartyCandidateVotes%±%
Conservative David Keast210553.41
Liberal Democrats Mike Ashton104826.59
Green Dave Ludlam52113.22
Labour Howard Linsley2676.77
Majority105726.82
Turnout 394133.24-27.83
Conservative hold Swing
Emsworth and St Faith's
PartyCandidateVotes%±%
Conservative Ray Bolton314446.66
Liberal Democrats Ray Cobbett164824.46
UKIP Stephen Harris80711.98
Green Mary Youle5468.10
Labour John Ogden4066.03
English Democrat Grant Greenham1872.78
Majority149622.20
Turnout 673845.14-25.43
Conservative hold Swing
Hayling Island
PartyCandidateVotes%±%
Conservative Frank Pearce257947.05
UKIP Gary Kerrin110820.22
Liberal Democrats Paul Pritchard70012.77
Labour Sheila Mealy4438.08
Green Gill Leek4367.95
English Democrat Christopher Pritchard2153.92
Majority147126.83
Turnout 548138.84-25.33
Conservative hold Swing
Purbrook and Stakes South
PartyCandidateVotes%±%
Conservative Robin McIntosh190151.18
English Democrat Alan Green82122.11
Liberal Democrats Steve Marshall55815.02
Labour Barry Steel43411.69
Majority108029.07
Turnout 371430.47-30.17
Conservative hold Swing
Waterloo and Stakes North
PartyCandidateVotes%±%
Conservative Ian Beagley266761.85
Liberal Democrats Fred Dunford129830.10
Labour Howard Sherlock3478.05
Majority136931.75
Turnout 431233.36-30.52
Conservative hold Swing

New Forest

New Forest New Forest UK locator map.svg
New Forest
Brockenhurst
PartyCandidateVotes%±%
Conservative Ken Thornber289958.32
Liberal Democrats Rachel Smith123524.84
UKIP Michael Biddiscombe65413.16
Labour Stephen Short1833.68
Majority166433.48
Turnout 497143.16-24.67
Conservative hold Swing
Dibden and Hythe
PartyCandidateVotes%±%
Liberal Democrats Brian Dash366462.55
Conservative Bob Wappet199133.99
Labour Gwyneth Hubert2033.47
Majority167328.56
Turnout 585839.62-28.06
Liberal Democrats hold Swing
Fordingbridge
PartyCandidateVotes%±%
Conservative Edward Heron268654.91
Liberal Democrats Miranda Whitehead198940.66
Labour Brian Shemmings2174.44
Majority69714.25
Turnout 489242.69-27.04
Conservative hold Swing
Lymington
PartyCandidateVotes%±%
Conservative Adrian Evans295462.65
Liberal Democrats Paul Hickman156533.19
Labour Peter Coakes1964.16
Majority138929.46
Turnout 471538.60-25.03
Conservative hold Swing
Lyndhurst
PartyCandidateVotes%±%
Conservative Keith Mans322063.62
Liberal Democrats Jim Parry150329.70
Labour Ken Kershaw3386.68
Majority171733.92
Turnout 506140.47-29.66
Conservative hold Swing
Milford and Hordle
PartyCandidateVotes%±%
Conservative Alan Rice325858.32
Liberal Democrats Wynford Davies107719.28
UKIP Celia Pilling99717.85
Labour Amy Coakes2544.55
Majority218139.04
Turnout 558641.33-23.58
Conservative hold Swing
New Milton
PartyCandidateVotes%±%
Conservative Mel Kendal286551.62
UKIP Nigel Cox132623.89
Independent John Evans100018.02
Labour Peter Dance3596.47
Majority153927.73
Turnout 555040.17-26.57
Conservative hold Swing
Ringwood
PartyCandidateVotes%±%
Conservative Steve Rippon-Swaine251360.35
Liberal Democrats Mark Radford134132.20
Labour Peter Harper3107.44
Majority117228.15
Turnout 416435.55-27.52
Conservative hold Swing
South Waterside
PartyCandidateVotes%±%
Conservative Alexis McEvoy200549.80
Liberal Democrats Gordon Richardson174143.24
Labour Mike Perkins2806.95
Majority2646.56
Turnout 402631.85-28.25
Conservative gain from Liberal Democrats Swing
Totton North
PartyCandidateVotes%±%
Liberal Democrats Alan Weeks204248.56
Conservative Chris Lagdon192745.83
Labour Peter Sopowski2365.61
Majority1152.73
Turnout 420532.51-29.62
Liberal Democrats hold Swing
Totton South and Marchwood
PartyCandidateVotes%±%
Liberal Democrats David Harrison264154.92
Conservative David Russell189739.45
Labour Alun Barnett2715.64
Majority74415.47
Turnout 480933.88-29.19
Liberal Democrats hold Swing

Rushmoor

Rushmoor Rushmoor UK locator map.svg
Rushmoor
Aldershot East
PartyCandidateVotes%±%
Conservative Eric Neal141935.91
Labour Mike Roberts108827.54
Independent Peter Sandy70017.72
Liberal Democrats Paul Bowers61415.54
No PartyRoger Watkins1303.29
Majority3318.37
Turnout 395129.75-27.37
Conservative hold Swing
Aldershot West
PartyCandidateVotes%±%
Conservative Roger James Kimber181155.93
Liberal Democrats Shaun Murphy75723.38
Labour Alex Crawford67020.69
Majority105432.55
Turnout 323828.16-24.78
Conservative hold Swing
Farnborough North
PartyCandidateVotes%±%
Conservative Roz Muschamp145134.41
Liberal Democrats Charlie Fraser-Fleming129530.71
Independent Jon Paul Weston67315.96
BNP Warren Glass52912.54
Labour Jonathan Slater2696.38
Majority1563.70
Turnout 421734.42-21.51
Conservative hold Swing
Farnborough South
PartyCandidateVotes%±%
Conservative John Wall271555.13
Liberal Democrats Craig Card186637.89
Labour Bill Tootill3446.98
Majority84917.24
Turnout 492537.97-26.72
Conservative hold Swing
Farnborough West
PartyCandidateVotes%±%
Conservative Carol Leversha270757.45
Liberal Democrats Sue Gadsby165835.19
Labour Clive Grattan3477.36
Majority104922.26
Turnout 471234.82-30.17
Conservative hold Swing

Test Valley

Test Valley Test Valley UK locator map.svg
Test Valley
Andover North
PartyCandidateVotes%±%
Conservative Pam Mutton180942.73
Liberal Democrats Robin Hughes136032.12
UKIP Timothy Rolt79418.75
Labour Alan Cotter2716.40
Majority44910.61
Turnout 423431.81-22.01
Conservative gain from Liberal Democrats Swing
Andover South
PartyCandidateVotes%±%
Conservative David Kirk210249.09
Liberal Democrats Vincent McGarry96122.44
UKIP Bill McCabe91621.39
Labour John Newland3037.08
Majority114126.65
Turnout 428235.73-28.14
Conservative hold Swing
Andover West
PartyCandidateVotes%±%
Conservative Pat West317862.24
UKIP Janis Sadler90517.72
Liberal Democrats Josie Msonthi70013.71
Labour Dick Wan3236.33
Majority227344.52
Turnout 510639.09-25.00
Conservative hold Swing
Baddesley
PartyCandidateVotes%±%
Liberal Democrats Alan Dowden355560.43
Conservative James Jaggers213236.24
Labour Amanda Ford1963.33
Majority142324.19
Turnout 588344.56-27.69
Liberal Democrats hold Swing
Romsey Extra
PartyCandidateVotes%±%
Conservative Roy Perry 305458.44
Liberal Democrats Kath Tilling198638.00
Labour David Stevens1863.56
Majority106820.44
Turnout 522643.90-26.27
Conservative hold Swing
Romsey Town
PartyCandidateVotes%±%
Liberal Democrats Mark Cooper314055.24
Conservative Ian Richards236441.59
Labour David Moran1803.17
Majority77613.65
Turnout 568447.66-23.01
Liberal Democrats hold Swing
Test Valley Central
PartyCandidateVotes%±%
Conservative Andrew Gibson406360.61
Liberal Democrats Richard Rowles170525.43
UKIP Stan Oram70210.47
Labour Paul Doran2343.49
Majority235835.18
Turnout 670446.43-25.71
Conservative hold Swing

Winchester

Winchester Winchester UK locator map.svg
Winchester
Bishops Waltham
PartyCandidateVotes%±%
Liberal Democrats Peter Mason287046.22
Conservative Laurence Ruffell235737.96
UKIP Colin Mason5428.73
Green Jim Kirkpatrick3115.01
Labour Patricia Hayward1292.08
Majority5138.26
Turnout 620949.49-24.71
Liberal Democrats hold Swing
Itchen Valley
PartyCandidateVotes%±%
Liberal Democrats Jackie Porter370153.59
Conservative George Beckett252436.55
UKIP David Samuel3444.98
Green Alison Craig2343.39
Labour Robin Atkins1031.49
Majority117717.04
Turnout 690655.23-20.61
Liberal Democrats hold Swing
Meon Valley
PartyCandidateVotes%±%
Conservative Felicity Hindson350261.49
Liberal Democrats Sheila Campbell145425.53
UKIP John Clark58610.29
Labour David Picton-Jones1532.69
Majority204835.96
Turnout 569550.05-26.91
Conservative hold Swing
Winchester Downlands
PartyCandidateVotes%±%
Liberal Democrats Charlotte Bailey379155.85
Conservative Marc Cumberlege248836.65
UKIP Christopher Barton-Briddon3905.75
Labour Antony De Peyer1191.75
Majority130319.20
Turnout 678854.18-22.15
Liberal Democrats hold Swing
Winchester Eastgate
PartyCandidateVotes%±%
Liberal Democrats Brian Collin265142.56
Conservative Ian Tait231337.13
Labour Chris Pines5108.19
Green Rupert Pitt4266.84
UKIP Lawrence Hole3295.28
Majority3385.43
Turnout 622943.77-23.00
Liberal Democrats hold Swing
Winchester Southern Parishes
PartyCandidateVotes%±%
Conservative Frederick Allgood262557.65
Liberal Democrats Kairen Goves123227.06
UKIP Ian Norgate55712.23
Labour Clive Coldwell1393.05
Majority139330.59
Turnout 455339.22-29.78
Conservative hold Swing
Winchester Westgate
PartyCandidateVotes%±%
Liberal Democrats Phryn Dickens310152.16
Conservative Roger Davey182930.77
Green Dave Walker-Nix3736.27
UKIP Douglas Reed3235.43
Labour Patrick Davies3195.37
Majority127221.39
Turnout 594543.65-26.66
Liberal Democrats hold Swing

Related Research Articles

<span class="mw-page-title-main">2009 Lancashire County Council election</span>

A whole-council election to Lancashire County Council took place on 4 June 2009 as part of the 2009 United Kingdom local elections. The United Kingdom government department Department for Communities and Local Government consulted on the issue of moving the elections to the same date as the 2009 European Parliament election, which resulted in the council elections being postponed to June to coincide. 84 councillors were elected for 84 divisions by first-past-the-post' for a four-year term of office. Wards were the same as those at the previous election in 2005. Elections are held in all electoral divisions across the present ceremonial county, excepting Blackpool, and Blackburn with Darwen which are unitary authorities in a similar way to Greater Manchester and most of Merseyside.

<span class="mw-page-title-main">2009 Hertfordshire County Council election</span>

An election to Hertfordshire County Council took place on 4 June 2009 the date of the 2009 United Kingdom local elections. The whole elected council was up for election. The councillors were elected from the 77 wards, which return one each by first-past-the-post voting for a four-year term of office. The wards were the same as those used at the previous election in 2005.

<span class="mw-page-title-main">2009 Cambridgeshire County Council election</span>

An election to Cambridgeshire County Council took place on 4 June 2009 as part of the 2009 United Kingdom local elections. The election was delayed from 7 May to coincide with elections to the European Parliament. 69 councillors were elected from 60 electoral divisions, which returned either one or two county councillors each by first-past-the-post voting. The Conservative Party retained their majority on the council, while the Green Party and UKIP gained their first seats.
<span class="mw-page-title-main">2009 Oxfordshire County Council election</span>

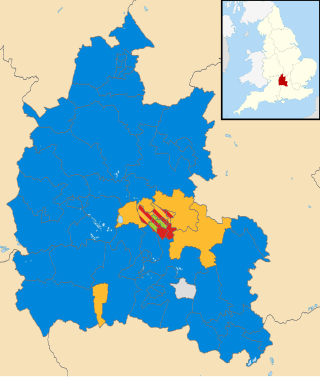
An election to Oxfordshire County Council took place on 4 June 2009 as part of the 2009 United Kingdom local elections, having been delayed from 7 May, to coincide with elections to the European Parliament. 74 councillors were elected from various electoral divisions, which returned either one, two or three county councillors each by first-past-the-post voting for a four-year term of office. The electoral divisions were the same as those used at the previous election in 2005.

<span class="mw-page-title-main">2009 Somerset County Council election</span>

An election to Somerset County Council took place on 4 June 2009 as part of the 2009 United Kingdom local elections, having been delayed from 7 May, to coincide with elections to the European Parliament. The result brought to an end 16 years of Liberal Democrat rule to a Conservative controlled administration. 58 councillors were elected from various electoral divisions, which returned one county councillor each. Members were elected by the first-past-the-post voting system for a four-year term of office. This was the last election before the number of seats was cut to 55 for the 2013 election. With a total of 58 seats being reduced to 55 for the next election.

<span class="mw-page-title-main">2009 Staffordshire County Council election</span> 2009 UK local government election

Elections to Staffordshire County Council took place on 4 June 2009 as part of the 2009 United Kingdom local elections, having been delayed from 7 May, in order to coincide with elections to the European Parliament. 62 councillors were elected from the various electoral divisions, which returned either one or two county councillors each by first-past-the-post voting for a four-year term of office. The electoral divisions were the same as those used at the previous election in 2005. The council continues to be administered on the Leader and Cabinet model.

<span class="mw-page-title-main">2009 Surrey County Council election</span>

Elections to Surrey County Council took place on 4 June 2009 as part of the 2009 United Kingdom local elections, having been delayed from 7 May in order for the elections to take place alongside those to the European Parliament.
<span class="mw-page-title-main">2009 Worcestershire County Council election</span>

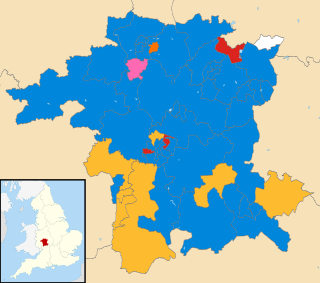
An election to Worcestershire County Council took place on 4 June 2009 as part of the 2009 United Kingdom local elections, alongside the 31 other County Councils, five of which are unitary, and a few other areas. The election had been delayed from 7 May, to coincide with elections to the European Parliament. 57 councillors were elected from 53 wards, which returned either one or two county councillors each by first-past-the-post voting for a four-year term of office. The wards were unchanged from the previous election in 2005. The election saw the Conservative Party retain overall control of the council with a majority of 14 seats, up from a majority of just 2 seats.

<span class="mw-page-title-main">2012 City of Lincoln Council election</span> UK municipal election

The 2012 City of Lincoln Council election took place on 3 May 2012 to elect one-third of the members of City of Lincoln Council in Lincolnshire, England, for a 4-year term of office. This was on the same day as other 2012 United Kingdom local elections.

<span class="mw-page-title-main">2013 Derbyshire County Council election</span>

An election to Derbyshire County Council took place on 2 May 2013 as part of the 2013 United Kingdom local elections. Following the final draft of the 2012 electoral review, 64 councillors were elected from 61 electoral divisions which returned either one or two county councillors each by first-past-the-post voting for a four-year term of office. No elections were held in the City of Derby, which is a unitary authority outside the area covered by the County Council. The Labour Party won back control of the council by a landslide victory, taking forty-two of the authority's sixty-four seats.

<span class="mw-page-title-main">2013 North Yorkshire County Council election</span>

An election to North Yorkshire County Council took place on 2 May 2013 as part of the 2013 United Kingdom local elections. 72 councillors were elected from 68 electoral divisions, which returned either one or two county councillors each by first-past-the-post voting for a four-year term of office. The four divisions which elected two members were Harrogate Bilton & Nidd Gorge, Harrogate Central, Knaresborough, and Selby Barlby. Of those seats UKIP won its first ever seats on the council in Bilton and Nidd Gorge. The electoral divisions were the same as those used at the previous election in 2009. The election saw the Conservative Party maintain overall control of the council.

<span class="mw-page-title-main">2013 Leicestershire County Council election</span> 2013 UK local government election

An election to Leicestershire County Council took place on 2 May 2013 as part of the 2013 United Kingdom local elections. 55 councillors were elected from 52 electoral divisions, which returned either one or two county councillors each by first-past-the-post voting for a four-year term of office. The Conservatives held control of the council with a reduced majority of 5 seats. Despite a strong challenge from UKIP, the party only gained 2 seats whilst the Liberal Democrats lost one seat and Labour recouped some of their 2009 losses, gaining 6 seats.
<span class="mw-page-title-main">2013 East Sussex County Council election</span> 2013 UK local government election

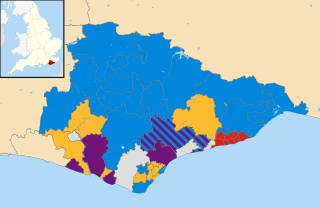
The East Sussex County Council election, 2013 took place on 2 May 2013 as part of the 2013 United Kingdom local elections. All 49 councillors of East Sussex County Council were elected from 44 electoral divisions, which return either one or two councillors each by first-past-the-post voting for a four-year term of office. The electoral divisions were the same as those used at the previous election in 2009. No elections were held in Brighton and Hove, which is a unitary authority outside the area covered by the County Council.

<span class="mw-page-title-main">2013 Hampshire County Council election</span> 2013 UK local government election

An election to Hampshire County Council took place on 2 May 2013 as part of the 2013 United Kingdom local elections. 78 councillors were elected from 75 electoral divisions, which returned either one or two county councillors each by first-past-the-post voting for a four-year term of office. The electoral divisions were the same as those of the previous election in 2009. No elections were held in Portsmouth and Southampton, which are unitary authorities outside the area covered by the County Council. The election saw the Conservative Party retain overall control of the council, with a reduced majority of five councillors.

<span class="mw-page-title-main">2013 Worcestershire County Council election</span>

An election to Worcestershire County Council took place on 2 May 2013 as part of the 2013 United Kingdom local elections. 57 councillors were elected from 53 electoral divisions, which returned either one or two county councillors each by first-past-the-post voting for a four-year term of office. The divisions were the same as those used at the previous election in 2009. The election saw the Conservative Party retain overall control of the council with a significantly reduced majority of just 2 seats.
<span class="mw-page-title-main">2013 Lincolnshire County Council election</span>

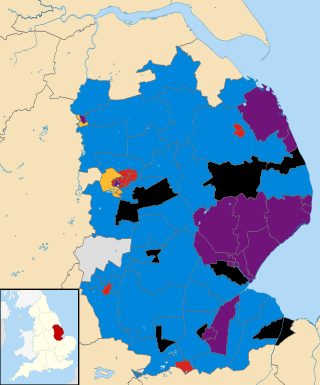
An election to Lincolnshire County Council took place on 2 May 2013 as part of the 2013 United Kingdom local elections. 77 electoral divisions returned one county councillor each by first-past-the-post voting for a four-year term of office. The electoral divisions were the same as those used at the previous election in 2009. No elections were held in North Lincolnshire or North East Lincolnshire, which are unitary authorities outside the area covered by the County Council.

<span class="mw-page-title-main">2013 Gloucestershire County Council election</span>

Elections to Gloucestershire County Council took place on 2 May 2013 as part of the 2013 United Kingdom local elections. 53 electoral divisions elected one county councillor each by first-past-the-post voting for a four-year term of office. No elections were held in South Gloucestershire, which is a unitary authority outside the area covered by the County Council.

<span class="mw-page-title-main">2013 Essex County Council election</span> 2013 UK local government election

An election to Essex County Council took place on 2 May 2013 as part of the 2013 United Kingdom local elections. 75 councillors were elected from 70 electoral divisions, which returned either one or two county councillors each by first-past-the-post voting for a four-year term of office. The electoral divisions were the same as those used at the previous election in 2009. No elections were held in Thurrock or Southend-on-Sea, which are unitary authorities outside the area covered by the County Council.

<span class="mw-page-title-main">2013 Dorset County Council election</span>

An election to Dorset County Council took place on 2 May 2013 as part of the United Kingdom local elections. 45 councillors were elected from 42 electoral divisions, which returned either one or two county councillors each by first-past-the-post voting for a four-year term of office. The electoral divisions were the same as those used at the previous election in 2009. No elections were held in Bournemouth or Poole, which are unitary authorities outside the area covered by the County Council. The election saw the Conservative Party maintain overall control of the council.

<span class="mw-page-title-main">2005 Oxfordshire County Council election</span> UK local election

An election to Oxfordshire County Council took place on 5 May 2005 as part of the 2005 United Kingdom local elections, coinciding with the 2005 United Kingdom general election. 74 councillors were elected from various electoral divisions, which returned either one, two or three county councillors each by first-past-the-post voting for a four-year term of office. This was the first election using the new electoral divisions following proposals from the Electoral Commission in 2004, meaning the council would consist of three seats more than previously.

References

  1. "Elections in Hampshire County Council". Hampshire County Council. 28 March 2013. Archived from the original on 6 June 2013. Retrieved 31 March 2013.
  2. "The Representation of the People (Form of Canvass) (England and Wales) Regulations 2006, Schedule Part 1". Legislation.gov.uk. 13 October 2011. Retrieved 18 April 2012.
  3. "I have two homes. Can I register at both addresses?". The Electoral Commission. Archived from the original on 7 May 2019. Retrieved 5 January 2011.
  4. "Hampshire". BBC News Online. 19 April 2009. Retrieved 22 June 2009.
  5. "State of the Parties". Hampshire County Council. Archived from the original on 30 September 2007. Retrieved 3 July 2009.
  6. "Overall State of the Parties". Hampshire County Council. Retrieved 15 April 2013.