Winchester City Council is responsible for the local government of the City of Winchester in Hampshire, England. Despite its name, the City of Winchester is a local government district that stretches far beyond the urban area of Winchester, covering urban, suburban and rural areas.
Contents
- Council composition
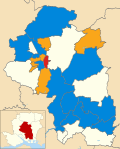
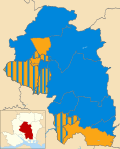
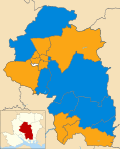
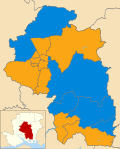
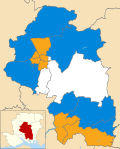
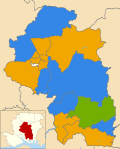
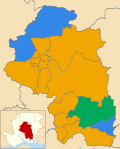
- District result maps
- By-election results
- 1998–2002
- 2002–2006
- 2006–2010
- 2010–2014
- 2018–2022
- 2022–2026
- See also
- Notes
- References
- External links
One third of Winchester City Council is elected each year in a sequence of three years, followed by one year without election, thus giving a tenure for individual councillors of four years. Since the last boundary changes in 2016, 45 councillors have been elected from 16 wards, there having previously been 57 councillors have been elected from 26 wards from 2002. [1]