| |||||||||||||||||||||
All 48 seats to Test Valley Borough Council 24 seats needed for a majority | |||||||||||||||||||||
---|---|---|---|---|---|---|---|---|---|---|---|---|---|---|---|---|---|---|---|---|---|
| |||||||||||||||||||||
|
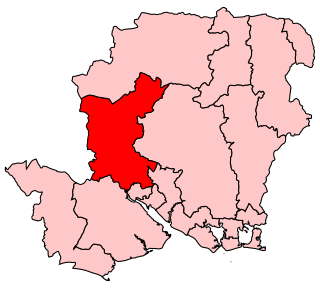
The 2003 Test Valley Borough Council election took place on the 1 May 2003. With new ward boundaries, all 48 seats were up for election. [1] 24 seats were needed for a majority, with the Conservatives winning 30; the Liberal Democrats won 16 seats, and Independents won 2. [2]
Party | Seats | Gains | Losses | Net gain/loss | Seats % | Votes % | Votes | +/− | |
---|---|---|---|---|---|---|---|---|---|
Conservative | 30 | 62.50 | 52.20 | 17,121 | |||||
Liberal Democrats | 16 | 33.33 | 35.95 | 11,793 | |||||
Labour | 0 | 0 | 5.4 | 1,648 | |||||
Independent | 2 | 4.16 | 3.46 | 1,138 | |||||
UKIP | 0 | 0 | 2.57 | 846 | |||||
Green | 0 | 0 | 0.76 | 250 | |||||
Total | 48 | 32,796 |
Party | Candidate | Votes | % | ±% | |
---|---|---|---|---|---|
Independent | Donald Kemish | 773 | 32.89 | ||
Conservative | Clive Collier | 765 | 32.55 | ||
Liberal Democrats | Sally Lamb | 678 | 28.85 | ||
Liberal Democrats | Paul Rispin | 528 | |||
Labour | Charles Damant | 134 | 5.70 | ||
Majority | |||||
Turnout | 2,350 | ||||
Independent hold | Swing | ||||
Conservative hold | Swing | ||||
Party | Candidate | Votes | % | ±% | |
---|---|---|---|---|---|
Liberal Democrats | Robin Hughes | 596 | 48.49 | ||
Liberal Democrats | Leonard Gates | 543 | |||
Liberal Democrats | Josephine Msonthi | 507 | |||
Conservative | Karen Hamilton | 469 | 38.16 | ||
Conservative | Michael Platt | 432 | |||
Conservative | Lynsay Scratchley | 430 | |||
UKIP | William McCabe | 164 | 13.34 | ||
Majority | |||||
Liberal Democrats win (new seat) | |||||
Liberal Democrats win (new seat) |
Party | Candidate | Votes | % | ±% | |
---|---|---|---|---|---|
Conservative | Martin Hatley | 649 | 78.19 | ||
Liberal Democrats | Sandra Cosier | 181 | 21.80 | ||
Majority | 468 | 56.38 | |||
Conservative win (new seat) |
Party | Candidate | Votes | % | ±% | |
---|---|---|---|---|---|
Conservative | Norman Arnell | 467 | 69.18 | ||
Liberal Democrats | Elizabeth Warner | 129 | 19.11 | ||
UKIP | Dominic Mills | 79 | 11.70 | ||
Majority | 338 | 50.07 | |||
Conservative win (new seat) |
Party | Candidate | Votes | % | ±% | |
---|---|---|---|---|---|
Conservative | Elizabeth Townsend | 809 | 58.49 | ||
Conservative | Arthur Peters | 767 | |||
Liberal Democrats | John Moon | 398 | 28.77 | ||
Liberal Democrats | Kevin O'Leary | 346 | |||
UKIP | Stanley Oram | 176 | 12.72 | ||
Majority | |||||
Turnout | 1,383 | ||||
Conservative hold | Swing | ||||
Party | Candidate | Votes | % | ±% | |
---|---|---|---|---|---|
Conservative | Anthony Gentle | 1,205 | 77.49 | ||
Conservative | John Lewis | 1,024 | |||
Liberal Democrats | Max Buckmaster | 350 | 22.50 | ||
Liberal Democrats | Julian Jones | 338 | |||
Majority | |||||
Turnout | 1,555 | ||||
Conservative hold | Swing | ||||
Party | Candidate | Votes | % | ±% | |
---|---|---|---|---|---|
Conservative | Anthony Jackson | 505 | 73.93 | ||
Liberal Democrats | David Webb | 178 | 26.06 | ||
Majority | 327 | 47.87 | |||
Conservative win (new seat) |
Party | Candidate | Votes | % | ±% | |
---|---|---|---|---|---|
Conservative | Peter Boulton | 1,174 | 59.05 | ||
Conservative | Daniel Busk | 969 | |||
Liberal Democrats | Maureen Treadwell | 674 | 33.90 | ||
Liberal Democrats | Alistair Anderson | 634 | |||
Labour | Arthur Paul | 140 | 7.04 | ||
Majority | |||||
Turnout | 1,988 | ||||
Conservative hold | Swing | ||||
Party | Candidate | Votes | % | ±% | |
---|---|---|---|---|---|
Conservative | Ian Carr | 461 | 77.21 | ||
Liberal Democrats | Dorothy Webb | 136 | 22.78 | ||
Majority | 325 | 54.43 | |||
Conservative win (new seat) |
Party | Candidate | Votes | % | ±% | |
---|---|---|---|---|---|
Conservative | John Hall | 1,242 | 59.82 | ||
Conservative | Nigel Anderson | 1,230 | |||
Conservative | Bruce Cowan | 1,084 | |||
Liberal Democrats | Brian Richards | 545 | 26.25 | ||
Labour | Keith Morrel | 289 | 13.92 | ||
Majority | |||||
Conservative win (new seat) | |||||
Conservative win (new seat) |
Party | Candidate | Votes | % | ±% | |
---|---|---|---|---|---|
Liberal Democrats | Dorothy Baverstock | 838 | 58.23 | ||
Liberal Democrats | Alan Marsh | 827 | |||
Conservative | Richard Jenkins | 601 | 41.76 | ||
Conservative | Sarah Whitaker | 594 | |||
Majority | |||||
Turnout | 1,439 | ||||
Liberal Democrats hold | Swing | ||||
Party | Candidate | Votes | % | ±% | |
---|---|---|---|---|---|
Conservative | Neville Whiteley | 478 | 66.94 | ||
Liberal Democrats | Judith Houghton | 236 | 33.05 | ||
Majority | 242 | 33.89 | |||
Conservative win (new seat) |
Party | Candidate | Votes | % | ±% | |
---|---|---|---|---|---|
Conservative | James Neal | 555 | 74.29 | ||
Liberal Democrats | Edwin Treadwell | 192 | 25.70 | ||
Majority | 363 | 48.59 | |||
Conservative win (new seat) |
Party | Candidate | Votes | % | ±% | |
---|---|---|---|---|---|
Conservative | Patricia West | 875 | 54.07 | ||
Conservative | Brian Page | 777 | |||
Conservative | Carl Borg-Neal | 718 | |||
Liberal Democrats | Michael Levitt | 391 | 24.16 | ||
Liberal Democrats | Peter Wilson | 384 | |||
Liberal Democrats | Rosalie Sweetman | 376 | |||
Labour | Michael Mumford | 352 | 21.75 | ||
Labour | Alan Cotter | 279 | |||
Labour | James Lowe | 255 | |||
Majority | |||||
Conservative win (new seat) | |||||
Conservative win (new seat) |
Party | Candidate | Votes | % | ±% | |
---|---|---|---|---|---|
Independent | David Bidwell | 365 | 41.95 | ||
Conservative | David Bonnor-Morris | 358 | 41.14 | ||
Liberal Democrats | Roger Harris | 147 | 16.89 | ||
Majority | 7 | 0.80 | |||
Turnout | 870 | ||||
Independent hold | Swing | ||||
Party | Candidate | Votes | % | ±% | |
---|---|---|---|---|---|
Conservative | Zilliah Brooks | 1,078 | 71.10 | ||
Conservative | Sandra Hawke | 998 | |||
Conservative | David Drew | 989 | |||
Liberal Democrats | Margaret Henstock | 438 | 28.89 | ||
Liberal Democrats | Alan Sweetman | 418 | |||
Majority | 1,516 | ||||
Conservative win (new seat) | |||||
Conservative win (new seat) |
Party | Candidate | Votes | % | ±% | |
---|---|---|---|---|---|
Liberal Democrats | Stephen Cosier | 1,437 | 65.85 | ||
Liberal Democrats | Celia Dowden | 1,214 | |||
Liberal Democrats | Ann Tupper | 1,139 | |||
Conservative | Robin Oliver | 628 | 28.78 | ||
Conservative | Roy Williams | 576 | |||
Conservative | Alfred-Hans Monsen | 441 | |||
Labour | Christopher Deverell | 117 | 5.36 | ||
Majority | |||||
Liberal Democrats win (new seat) | |||||
Liberal Democrats win (new seat) |
Party | Candidate | Votes | % | ±% | |
---|---|---|---|---|---|
Conservative | Anthony Hope | 320 | 77.48 | ||
Liberal Democrats | Jane Fisk | 93 | 22.51 | ||
Majority | 227 | 54.96 | |||
Conservative win (new seat) |
Party | Candidate | Votes | % | ±% | |
---|---|---|---|---|---|
Conservative | Philip Lashbrook | 770 | 56.20 | ||
Conservative | Timothy Southern | 739 | |||
Liberal Democrats | Lance Mitchell | 360 | 26.27 | ||
UKIP | Derek Rumsey | 240 | 17.51 | ||
Majority | |||||
Turnout | 1,370 | ||||
Conservative hold | Swing | ||||
Party | Candidate | Votes | % | ±% | |
---|---|---|---|---|---|
Conservative | Caroline Nokes | 542 | 53.82 | ||
Conservative | Ian Hibberd | 495 | |||
Liberal Democrats | Karen Dunleavy | 465 | 46.17 | ||
Liberal Democrats | George Johnson | 444 | |||
Majority | |||||
Turnout | 1,007 | ||||
Conservative hold | Swing | ||||
Party | Candidate | Votes | % | ±% | |
---|---|---|---|---|---|
Liberal Democrats | Rodney Bailey | 704 | 44.75 | ||
Liberal Democrats | Barbara Levitt | 602 | |||
Liberal Democrats | Donald MacDonald | 583 | |||
Conservative | Kenneth Whitehouse | 546 | 34.71 | ||
Conservative | Peter Wood | 528 | |||
Conservative | Barry Hodgson | 516 | |||
Labour | Paul Goddard | 323 | 20.53 | ||
Labour | Martyn Wilson | 276 | |||
Labour | Peter Scarrott | 267 | |||
Majority | |||||
Liberal Democrats win (new seat) | |||||
Liberal Democrats win (new seat) |
Party | Candidate | Votes | % | ±% | |
---|---|---|---|---|---|
Liberal Democrats | Mark Cooper | 909 | 51.76 | ||
Liberal Democrats | Sally Leach | 900 | |||
Conservative | Peter Daw | 701 | 39.92 | ||
Conservative | David Willox | 635 | |||
Labour | Carolyn Nixson | 146 | 8.31 | ||
Majority | |||||
Liberal Democrats win (new seat) | |||||
Liberal Democrats win (new seat) |
Party | Candidate | Votes | % | ±% | |
---|---|---|---|---|---|
Liberal Democrats | Alan Dowden | 1,153 | 58.46 | ||
Liberal Democrats | Jacquie Shaw | 1,023 | |||
Liberal Democrats | Norman Lewis | 929 | |||
Conservative | John Barton | 672 | 34.07 | ||
Conservative | Richard James | 631 | |||
Conservative | Peggy Humphries | 613 | |||
Labour | David Moores | 147 | 7.45 | ||
Labour | Teri Moores | 144 | |||
Majority | |||||
Liberal Democrats win (new seat) | |||||
Liberal Democrats win (new seat) |
Party | Candidate | Votes | % | ±% | |
---|---|---|---|---|---|
Conservative | Marion Kerley | 1,251 | 55.52 | ||
Conservative | Pamela Mutton | 1,085 | |||
Conservative | Alan Smith | 1,061 | |||
Liberal Democrats | David Metcalf | 565 | 25.07 | ||
Liberal Democrats | Yvonne Jones | 502 | |||
Liberal Democrats | John Smith | 479 | |||
Green | James Todd | 250 | 11.09 | ||
UKIP | Anthony McCabe | 187 | 8.30 | ||
Majority | |||||
Conservative win (new seat) | |||||
Conservative win (new seat) |
Romsey was a seat of the House of Commons of the UK Parliament 1983–2010 which accordingly elected one Member of Parliament (MP) by the first past the post system of election. It is virtually tantamount to its replacement Romsey and Southampton North which takes in two typical-size local government wards of the United Kingdom named after and approximate to the Bassett and Swaythling parts of Southampton.
North West Hampshire is a constituency represented in the House of Commons of the UK Parliament since 2015 by Conservative Kit Malthouse, who served as Education Secretary in 2022.
Test Valley Borough Council is elected every four years.
Amber Valley Borough Council elections are held every four years to elect councillors to Amber Valley Borough Council, the local authority for the non-metropolitan district of Amber Valley in Derbyshire, England. Since the last boundary changes in 2023, 42 councillors have been elected to represent 18 wards. Prior to 2023 a third of the council was elected three years out of every four.
Blyth Valley Borough Council elections were generally held every four years between the council's creation in 1974 and its abolition in 2009. Blyth Valley was a non-metropolitan district in Northumberland, England. The council was abolished and its functions transferred to Northumberland County Council with effect from 1 April 2009.
Local government elections took place in London, and some other parts of the United Kingdom on Thursday 4 May 2006. Polling stations were open between 7am and 10pm.
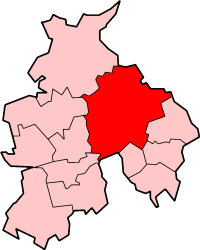
Ribble Valley Borough Council elections are held every four years. Ribble Valley Borough Council is the local authority for the non-metropolitan district of Ribble Valley in Lancashire, England. Since the last boundary changes in 2019, 40 councillors have been elected from 26 wards.
Thanet District Council elections are held every four years to elect Thanet District Council in Kent, England. Since the last boundary changes in 2003 the council has comprised 56 councillors representing 23 wards.
Elections to Test Valley Borough Council were held on 5 May 2011, the same day as the 2011 United Kingdom Alternative Vote referendum. The Conservatives maintained control of the council, with an increased majority.
The 2011 Amber Valley Borough Council election took place on 5 May 2011 to elect members of Amber Valley Borough Council in Derbyshire, England. One third of the council was up for election and the Conservative Party stayed in overall control of the council.
The 2014 Bromley London Borough Council election took place on 22 May 2014. All 60 members of Bromley London Borough Council were elected. The elections took place alongside local elections in the other London boroughs, elections to local authorities across the United Kingdom, and elections to the European Parliament.
The 2018 United Kingdom local elections were held on Thursday 3 May 2018, with local council elections taking place in all 32 London boroughs, 34 metropolitan boroughs, 67 district and borough councils and 17 unitary authorities. There were also direct elections for the mayoralties of Hackney, Lewisham, Newham, Tower Hamlets and Watford.
The 2018 Sutton Council election took place on 3 May 2018 to elect members of Sutton Council in London. This was on the same day as other local elections.
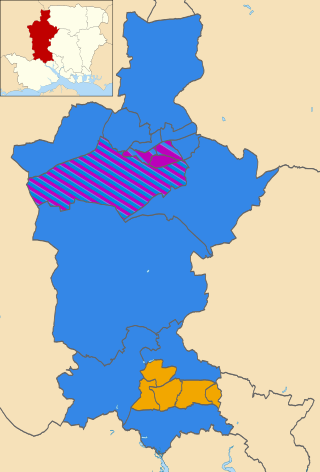
The 2019 Test Valley Borough Council election took place on 2 May 2019 to elect members of Test Valley Borough Council in England. This was on the same day as other local elections. The whole council was up for election on new boundaries, with the number of seats reduced from 48 across 24 wards to 43 across 20.
Elections to Hampshire County Council took on 6 May 2021 as part of the 2021 United Kingdom local elections. All 78 seats were up for election, with each ward returning either one or two councillors by first-past-the-post voting for a four-year term of office. This took place at the same time as the elections for the Hampshire Police and Crime Commissioner and district councils.
The 2007 Test Valley Borough Council election took place on the 3 May 2007. All 48 seats were up for election. 24 seats were needed for a majority, with the Conservatives increasing their majority by three seats. Both independents lost their seats, one to the Conservatives and one to the Liberal Democrats, who in turn lost a seat to the Conservatives.
The 2021 elections to Amber Valley Borough Council were held on Wednesday 5th May 2021, 16 seats in the council were up for election. The Conservative Party retook control of the council from The Labour Party after losing control in 2019. These seats were due to have been contested in 2020, but the elections were delayed by a year due to the COVID-19 pandemic along with other elections.
The 2022 Bromley London Borough Council election took place on 5 May 2022. All 58 members of Bromley London Borough Council were elected. The elections took place alongside local elections in the other London boroughs and elections to local authorities across the United Kingdom.
The 2022 Ealing London Borough Council election took place on 5 May 2022, under new election boundaries, which increased the number of Ealing London Borough Council councillors to 70. The elections took place alongside local elections in the other London boroughs and elections to local authorities across the United Kingdom.
The 2023 Test Valley Borough Council election took place on 4 May 2023 to elect members of Test Valley Borough Council in England. This was on the same day as other local elections. The whole council of 43 members was up for election across 20 wards.