![]() | |||||||||||||||||||||||||||||
| |||||||||||||||||||||||||||||
All 50 seats in the Canterbury City Council 26 seats needed for a majority | |||||||||||||||||||||||||||||
---|---|---|---|---|---|---|---|---|---|---|---|---|---|---|---|---|---|---|---|---|---|---|---|---|---|---|---|---|---|
| |||||||||||||||||||||||||||||
![]() Map of the results of the 2003 Canterbury council election. Labour in red, Conservatives in blue and Lib Dems in orange. | |||||||||||||||||||||||||||||
|
The 2003 Canterbury City Council election took place on 1 May 2003 to elect members of the Canterbury City Council in Kent, England. This was on the same day as other local elections. It was the first election to be held under new ward boundaries. [2] The council remained under no overall control. [3]
Party | Seats | Gains | Losses | Net gain/loss | Seats % | Votes % | Votes | +/− | |
---|---|---|---|---|---|---|---|---|---|
Conservative | 24 | 4 | 0 | ![]() | 48.0 | 43.7 | 36,007 | +6.6 | |
Liberal Democrats | 19 | 1 | 0 | ![]() | 38.0 | 31.3 | 25,789 | +0.5 | |
Labour | 7 | 0 | 5 | ![]() | 14.0 | 21.4 | 17,617 | -7.4 | |
Green | 0 | 0 | 0 | ![]() | 0.0 | 2.3 | 1,877 | -0.2 | |
UKIP | 0 | 0 | 0 | ![]() | 0.0 | 0.9 | 716 | N/A | |
Socialist Alliance | 0 | 0 | 0 | ![]() | 0.0 | 0.3 | 288 | N/A | |
Council Tax Payers | 0 | 0 | 0 | ![]() | 0.0 | 0.2 | 143 | N/A |
Party | Candidate | Votes | % | ±% | |
---|---|---|---|---|---|
Liberal Democrats | Martin Vye | 761 | 68.4 | +18.9 | |
Conservative | Don Faulkner | 318 | 28.6 | −14.6 | |
Labour | Andrew Fenyo | 34 | 3.1 | −4.2 | |
Majority | 443 | 39.8 | |||
Turnout | 1,113 | 53.5 | |||
Liberal Democrats hold | Swing | ![]() |
Party | Candidate | Votes | % | ±% | |
---|---|---|---|---|---|
Liberal Democrats | Carole Brett | 1,051 | 55.7 | ||
Liberal Democrats | Christina Kay-Bradley | 919 | 48.7 | ||
Liberal Democrats | Christopher Took | 855 | 45.3 | ||
Conservative | Michael Northey | 854 | 45.3 | ||
Conservative | Pauline Hook | 799 | 42.4 | ||
Conservative | Terrence Ogier | 736 | 39.0 | ||
Labour | Linda Cooper | 263 | 13.9 | ||
Labour | Carl Parsons | 242 | 12.8 | ||
Green | Keith Bothwell | 175 | 9.3 | ||
Green | Corey Mills | 145 | 7.7 | ||
Council Tax Payers | James Cooper | 143 | 7.6 | ||
Turnout | 1,886 | 30.5 | |||
Liberal Democrats hold | |||||
Liberal Democrats hold |
Party | Candidate | Votes | % | ||
---|---|---|---|---|---|
Conservative | Hazel McCabe | 672 | 70.4 | ||
Conservative | John Gilbey | 562 | 58.9 | ||
Green | Geoffrey Meaden | 176 | 18.4 | ||
Labour | Michael Fuller | 159 | 16.7 | ||
Green | Philip Rogers | 146 | 15.3 | ||
Labour | David McLellan | 139 | 14.6 | ||
Turnout | 954 | 22.6 | |||
Conservative hold | |||||
Conservative win (new seat) |
Party | Candidate | Votes | % | ||
---|---|---|---|---|---|
Conservative | Rosemary Doyle | 756 | 53.4 | ||
Conservative | Michael Patterson | 696 | 49.2 | ||
Liberal Democrats | Andrea Nicholson | 372 | 26.3 | ||
Liberal Democrats | Carolyn Colthup | 359 | 25.4 | ||
Labour | John Chiappino | 268 | 18.9 | ||
Labour | Jodah Bhujan | 196 | 13.9 | ||
Turnout | 1,415 | 36.2 | |||
Conservative win (new seat) | |||||
Conservative win (new seat) |
Party | Candidate | Votes | % | ||
---|---|---|---|---|---|
Conservative | Jennifer Samper | 1,577 | 65.2 | ||
Conservative | Ian Thomas | 1,503 | 62.1 | ||
Conservative | Pat Todd | 1,495 | 61.8 | ||
Labour | Jane Hardy | 434 | 17.9 | ||
Labour | Ruth Wreford | 386 | 16.0 | ||
Liberal Democrats | Martin Brown | 369 | 15.2 | ||
Liberal Democrats | Michael Steed | 345 | 14.3 | ||
Liberal Democrats | Suzanne Tibertius | 328 | 13.6 | ||
Turnout | 2,420 | 36.5 | |||
Conservative win (new seat) | |||||
Conservative win (new seat) |
Party | Candidate | Votes | % | ±% | |
---|---|---|---|---|---|
Labour | Peter Halfpenny | 805 | 45.9 | ||
Labour | Wes McLachlan | 754 | 43.0 | ||
Conservative | Jacqueline Perkins | 746 | 42.6 | ||
Conservative | Paul Carnell | 720 | 41.1 | ||
Liberal Democrats | Margaret Lansdell | 177 | 10.1 | ||
Liberal Democrats | Roger Lansdell | 144 | 8.2 | ||
Socialist Alliance | Peter Holloway | 59 | 3.4 | ||
Turnout | 1,752 | 40.9 | |||
Labour hold | |||||
Labour hold |
Party | Candidate | Votes | % | ||
---|---|---|---|---|---|
Liberal Democrats | Roger Matthews | 478 | 36.9 | ||
Liberal Democrats | Nigel Oakes | 465 | 35.9 | ||
Conservative | Lynsey Laker | 413 | 31.9 | ||
Conservative | Vincent McMahan | 412 | 31.8 | ||
Labour | Bill Brade | 359 | 27.7 | ||
Labour | Robert Walker | 330 | 25.5 | ||
Green | Jess Hampshire | 73 | 5.6 | ||
Turnout | 1,294 | 32.8 | |||
Liberal Democrats win (new seat) | |||||
Liberal Democrats win (new seat) |
Party | Candidate | Votes | % | ±% | |
---|---|---|---|---|---|
Liberal Democrats | Michael Dixey | 517 | 58.4 | −11.7 | |
Conservative | Ann Taylor | 264 | 29.8 | +8.0 | |
Labour | Victoria Foster | 104 | 11.8 | +3.7 | |
Majority | 253 | 28.6 | |||
Turnout | 885 | 45.2 | |||
Liberal Democrats hold | Swing | ![]() |
Party | Candidate | Votes | % | ±% | |
---|---|---|---|---|---|
Labour | Julia Seath | 729 | 57.0 | ||
Labour | John Wratten | 650 | 50.8 | ||
Conservative | Michael Harrison | 485 | 37.9 | ||
Conservative | Howard Smith | 455 | 35.5 | ||
Socialist Alliance | Bunny La Roche | 161 | 12.6 | ||
Liberal Democrats | Janet Berridge | 158 | 12.3 | ||
Liberal Democrats | Gwendoline Bale | 152 | 11.9 | ||
Turnout | 1,280 | 37.1 | |||
Labour hold | |||||
Labour hold |
Party | Candidate | Votes | % | ||
---|---|---|---|---|---|
Liberal Democrats | Ronald Mavers | 685 | 36.3 | ||
Liberal Democrats | Ian Wright | 653 | 34.6 | ||
Conservative | Robert Bright | 619 | 32.8 | ||
Conservative | Kay Shannon | 609 | 32.2 | ||
Conservative | Pauline Roper | 599 | 31.7 | ||
Liberal Democrats | David Robinson | 565 | 29.9 | ||
UKIP | John Moore | 299 | 15.8 | ||
Green | Carol Davis | 261 | 13.8 | ||
UKIP | Edith Bigg | 214 | 11.3 | ||
Labour | John Brown | 213 | 11.3 | ||
UKIP | Terence Kendall | 203 | 10.7 | ||
Labour | Peter Tavener | 203 | 10.7 | ||
Labour | Eric Reeves | 192 | 10.2 | ||
Turnout | 1,889 | 31.9 | |||
Liberal Democrats win (new seat) | |||||
Conservative win (new seat) |
Party | Candidate | Votes | % | ±% | |
---|---|---|---|---|---|
Liberal Democrats | Ron Flaherty | 1,050 | 53.5 | ||
Liberal Democrats | Maisie Seager | 1,017 | 51.8 | ||
Liberal Democrats | Ken Hando | 960 | 48.9 | ||
Conservative | Jennifer Kadwell | 544 | 27.7 | ||
Conservative | Jean Herwin | 531 | 27.1 | ||
Conservative | Roy Smale | 515 | 26.2 | ||
Labour | Rolane Brade | 346 | 17.6 | ||
Labour | Lynnda Faux-Bowyer | 317 | 16.2 | ||
Labour | Tony Morris | 304 | 15.5 | ||
Turnout | 1,962 | 32.0 | |||
Liberal Democrats hold | |||||
Liberal Democrats hold |
Party | Candidate | Votes | % | ±% | |
---|---|---|---|---|---|
Conservative | Lewis Norris | 454 | 57.8 | +13.9 | |
Liberal Democrats | Arthur Linfoot | 213 | 27.1 | −13.4 | |
Labour | Alan Forrest | 119 | 15.1 | −0.6 | |
Majority | 241 | 30.7 | |||
Turnout | 786 | 38.3 | |||
Conservative hold | Swing | ![]() |
Party | Candidate | Votes | % | ±% | |
---|---|---|---|---|---|
Labour | Michael Nee | 348 | 52.0 | +2.9 | |
Conservative | Heather Taylor | 321 | 48.0 | +13.8 | |
Majority | 27 | 4.0 | |||
Turnout | 669 | 34.9 | |||
Labour hold | Swing | ![]() |
Party | Candidate | Votes | % | ±% | |
---|---|---|---|---|---|
Conservative | Bill Oakey | 574 | 56.2 | +7.0 | |
Liberal Democrats | Janet Horsley | 447 | 43.8 | +14.8 | |
Majority | 127 | 12.4 | |||
Turnout | 1,021 | 50.0 | |||
Conservative hold | Swing | ![]() |
Party | Candidate | Votes | % | ±% | |
---|---|---|---|---|---|
Labour | Ron Pepper | 583 | 48.3 | ||
Labour | Fred Whitemore | 558 | 46.3 | ||
Conservative | Graham Gibbens | 469 | 38.9 | ||
Conservative | Donald Bunting | 443 | 36.7 | ||
Liberal Democrats | Clifford Arter | 123 | 10.2 | ||
Liberal Democrats | Andrew Frogley | 105 | 8.7 | ||
Turnout | 1,206 | 30.5 | |||
Labour hold | |||||
Labour hold |
Party | Candidate | Votes | % | ±% | |
---|---|---|---|---|---|
Conservative | Gabrielle Davis | 1,226 | 49.4 | ||
Conservative | Michael Street-Williams | 1,216 | 49.0 | ||
Conservative | Gillian Reuby | 1,213 | 48.9 | ||
Liberal Democrats | Iris Law | 923 | 37.2 | ||
Liberal Democrats | Margaret Flaherty | 888 | 35.8 | ||
Liberal Democrats | George Corney | 872 | 35.1 | ||
Labour | Kim Brade-Dawkins | 314 | 12.7 | ||
Labour | David Hornsby | 273 | 11.0 | ||
Turnout | 2,481 | 38.8 | |||
Conservative hold | |||||
Conservative hold |
Party | Candidate | Votes | % | ±% | |
---|---|---|---|---|---|
Conservative | Harry Cragg | 937 | 40.0 | ||
Conservative | Kenneth Avery | 852 | 36.4 | ||
Liberal Democrats | Michael Berridge | 808 | 34.5 | ||
Liberal Democrats | John Purchese | 807 | 34.5 | ||
Liberal Democrats | Nicholas Blake | 770 | 32.9 | ||
Conservative | Barrie Packer | 754 | 32.2 | ||
Labour | Jennie Bukht | 607 | 25.9 | ||
Labour | John Jackson | 482 | 20.6 | ||
Labour | Paul Todd | 453 | 19.4 | ||
Green | Catherine Cantwell | 202 | 8.6 | ||
Green | Richard Podger | 149 | 6.4 | ||
Turnout | 2,340 | 35.6 | |||
Conservative hold | |||||
Conservative gain from Labour | |||||
Liberal Democrats hold |
Party | Candidate | Votes | % | ±% | |
---|---|---|---|---|---|
Conservative | Jean Law | 1,233 | 56.1 | ||
Conservative | Cyril Windsor | 1,209 | 55.0 | ||
Conservative | Michael Sharp | 1,194 | 54.3 | ||
Labour | Jean Beynon | 770 | 35.0 | ||
Labour | Christopher Ryan | 740 | 33.7 | ||
Labour | Sandra Ashford | 675 | 30.7 | ||
Liberal Democrats | Keith Hooker | 308 | 14.0 | ||
Turnout | 2,197 | 39.0 | |||
Conservative hold | |||||
Conservative win (new seat) |
Party | Candidate | Votes | % | ±% | |
---|---|---|---|---|---|
Conservative | Tony Austin | 426 | 58.0 | +30.3 | |
Labour | Nicholas Turner | 309 | 42.0 | −6.6 | |
Majority | 117 | 15.9 | |||
Turnout | 735 | 35.4 | |||
Conservative gain from Labour | Swing | ![]() |
Party | Candidate | Votes | % | ±% | |
---|---|---|---|---|---|
Conservative | Marion Attwood | 550 | 75.5 | +5.7 | |
Labour | Susan Barnard | 92 | 12.6 | −5.9 | |
Liberal Democrats | Monica Eden-Green | 86 | 11.8 | +0.1 | |
Majority | 458 | 62.9 | |||
Turnout | 728 | 32.7 | |||
Conservative hold | Swing | ![]() |
Party | Candidate | Votes | % | ±% | |
---|---|---|---|---|---|
Conservative | Jean Harrison | 851 | 51.1 | ||
Conservative | David Cavell | 822 | 49.4 | ||
Liberal Democrats | Heather Scott | 531 | 31.9 | ||
Liberal Democrats | Donna Dwight | 511 | 30.7 | ||
Labour | Michael Vince | 198 | 11.9 | ||
Socialist Alliance | Lorraine Vincent | 68 | 4.1 | ||
Turnout | 1,665 | 44.8 | |||
Conservative hold | |||||
Conservative hold |
Party | Candidate | Votes | % | ±% | |
---|---|---|---|---|---|
Conservative | Peter Lee | 893 | 55.5 | ||
Conservative | Crispin Rampling | 815 | 50.7 | ||
Labour | Brian Hunter | 546 | 33.9 | ||
Labour | John Neil | 445 | 27.7 | ||
Liberal Democrats | Margaret Burns | 320 | 19.9 | ||
Turnout | 1,609 | 33.8 | |||
Conservative gain from Labour | |||||
Conservative gain from Labour |
Party | Candidate | Votes | % | ±% | |
---|---|---|---|---|---|
Liberal Democrats | Susan Ashmore-Fish | 793 | 38.3 | ||
Liberal Democrats | Christian Farthing | 769 | 37.1 | ||
Liberal Democrats | Richard Parkinson | 768 | 37.1 | ||
Labour | Jean Butcher | 646 | 31.2 | ||
Labour | Philip Bond | 545 | 26.3 | ||
Conservative | Douglas Robinson | 540 | 26.1 | ||
Labour | Gordon Hartley | 537 | 25.9 | ||
Conservative | John Anderson | 527 | 25.4 | ||
Conservative | Victor Gray | 522 | 25.2 | ||
Green | Deirdre Balaam | 177 | 8.5 | ||
Green | Ronald Hollands | 160 | 7.7 | ||
Turnout | 2,071 | 35.8 | |||
Liberal Democrats hold | |||||
Liberal Democrats gain from Labour |
Party | Candidate | Votes | % | ±% | |
---|---|---|---|---|---|
Liberal Democrats | Nick Eden-Green | 1,138 | 58.0 | ||
Liberal Democrats | Charlotte MacCaul | 1,126 | 57.4 | ||
Liberal Democrats | Alex Perkins | 1,103 | 56.2 | ||
Conservative | Alan Griffiths | 442 | 22.5 | ||
Labour | Cecile Manning | 409 | 20.8 | ||
Conservative | Neil Parsonson | 408 | 20.8 | ||
Labour | John Derrick | 275 | 14.0 | ||
Labour | Anne Seller | 266 | 13.6 | ||
Conservative | Patricia Parsonson | 236 | 12.0 | ||
Green | Emily Shirley | 213 | 10.9 | ||
Turnout | 1,963 | 33.8 | |||
Liberal Democrats hold | |||||
Liberal Democrats hold |
Canterbury, also known as the City of Canterbury, is a local government district with city status in Kent, England. It is named after its largest settlement, Canterbury, where the council is based. The district also includes the towns of Fordwich, Herne Bay and Whitstable, along with numerous villages and surrounding rural areas. Parts of the district lie within the designated Area of Outstanding Natural Beauty of the Kent Downs.
Kent County Council is a county council that governs the non-metropolitan county of Kent in England. The non-metropolitan county is smaller than the ceremonial county, which additionally includes the unitary authority of Medway. Kent County Council is the upper tier of elected local government, below which are 12 district councils, and around 300 town and parish councils. The county council has 81 elected councillors. It is one of the largest local authorities in England in terms of population served and the largest local authority of its type. The council is based at County Hall in Maidstone. It has been under Conservative majority control since 1997.
Ashbury is a suburb in the Inner West of Sydney, in the state of New South Wales, Australia. It lies in the local government area of City of Canterbury-Bankstown with some areas in the Inner West Council and is about 10 kilometres south-west of the Sydney central business district. The postcode is 2193, the same as neighbouring Canterbury and Hurlstone Park.
The City of Canterbury was a local government area in the Inner South-West region of Sydney, New South Wales, Australia. The council area was within the northern part of the Parish of St George above Wolli Creek and The M5 but below The Cooks River. The city was primarily residential and light industrial in character, and was home to over 130 nationalities. With a majority of its residents being born overseas, the council marketed itself as the "City of Cultural Diversity." First incorporated as the Municipality of Canterbury in 1879, the council became known as the City of Canterbury in 1993.
Canterbury City Council is the local authority for the City of Canterbury. The council is elected every four years.
Environment Canterbury, frequently abbreviated to ECan, is the promotional name for the Canterbury Regional Council. It is the regional council for Canterbury, the largest region in the South Island of New Zealand. It is part of New Zealand's structure of local government.
Kayee Frances Griffin is an Australian politician and former Labor Party member of the New South Wales Legislative Council, serving from 2003 until her retirement in 2011.
The 2010 New Zealand local elections were triennial elections to select local government officials and district health board members. All elections are conducted by postal ballot, with election day being Saturday 9 October 2010.
The 2010 Christchurch mayoral election is part of the 2010 New Zealand local elections. On 9 October 2010, elections were held for the Mayor of Christchurch plus other local government roles. Incumbent Bob Parker was re-elected.
The 2013 New Zealand local elections were triennial elections to elect local government officials and District Health Board members, and the membership of other local bodies such as Licensing Trusts. All elections were conducted by postal ballot, with election day being Saturday 12 October 2013.
Denis John O'Rourke is a former New Zealand politician. He served fifteen years as a councillor on Christchurch City Council, and served six years as a Member of Parliament representing New Zealand First.
The 2016 New Zealand local elections were triennial local elections to select local government officials and District Health Board members. Under section 10 of the Local Electoral Act 2001, a "general election of members of every local authority or community board must be held on the second Saturday in October in every third year" from the date the Act came into effect in 2001, meaning 8 October 2016.
The 2015 Canterbury City Council election took place on 7 May 2015 to elect members of the Canterbury City Council in Kent, England. This was on the same day as other local elections. It was the first election to be held under new ward boundaries. The Conservative Party retained overall control of the council.
Canterbury-Bankstown Council, trading as the City of Canterbury Bankstown and stylised as CBCity, is a local government area in the Canterbury-Bankstown region of Sydney, New South Wales, Australia. The council was formed on 12 May 2016 from a merger of the City of Canterbury and the City of Bankstown, after a review of local government areas by the NSW Government.
Georges River Council is a local government area located in the St George region of Sydney located south of the Sydney CBD, in New South Wales, Australia. The Council was formed on 12 May 2016 from the merger of the Hurstville City Council and Kogarah City Council.
The People's Choice is a centre-left political ticket that contests elections for the Christchurch City Council, and the Canterbury Regional Council in Christchurch, New Zealand.
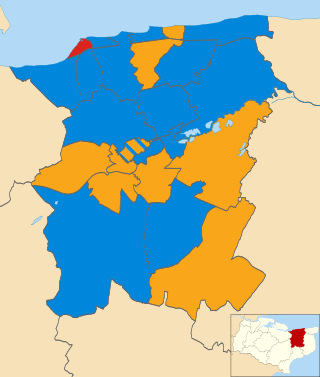
The 2019 Canterbury City Council election took place on 2 May 2019 to elect members of the Canterbury City Council in Kent, England. This was on the same day as other local elections. The Conservative Party retained overall control of the council.
The 2007 Canterbury City Council election took place on 3 May 2007 to elect members of the Canterbury City Council in Kent, England. This was on the same day as other local elections. The Conservative Party retained control of the council, which had previously been under no overall control until 2005 when The Conservatives Party took control following a by election and defection from the Liberal Democrats.
The 2011 Canterbury City Council election took place on 5 May 2011 to elect members of the Canterbury City Council in Kent, England. This was on the same day as other local elections. The Conservative Party retained control of the council.