2022 Tunbridge Wells Borough Council election

Last updated
2022 Tunbridge Wells Borough Council election
FlagOfKent.svg
  2021 5 May 2022 (2022-05-05)2023 

16 out of 48 seats to Tunbridge Wells Borough Council
25 seats needed for a majority
 First partySecond party
  No image wide.svg No image wide.svg
LeaderBen ChapelardThomas Dawlings
Party Liberal Democrats Conservative
Last election13 seats, 26.8%24 seats, 36.9%
Seats won62
Seats after1715
Seat changeIncrease2.svg 4Decrease2.svg 9
Popular vote6,3799,150
Percentage22.4%32.1%
SwingDecrease2.svg 4.4%Decrease2.svg 4.8%

 Third partyFourth party
  No image wide.svg No image wide.svg
LeaderNicolas PopeHugo Pound
Party Alliance Labour
Last election6 seats, 12.8%5 seats, 16.8%
Seats won53
Seats after97
Seat changeIncrease2.svg 3Increase2.svg 2
Popular vote6,1345,573
Percentage21.5%19.6%
SwingIncrease2.svg 8.7%Increase2.svg 2.8%

Tunbridge Wells UK ward map 2022.svg
Winner of each seat at the 2022 Tunbridge Wells Borough Council election

Leader of the council before election

Thomas Dawlings
Conservative

Leader of the council after election

Ben Chapelard
Liberal Democrats

The 2022 Tunbridge Wells Borough Council election took place on 5 May 2022 to elect one third of Tunbridge Wells Borough Council in England. [1]

Contents

Results summary

2022 Tunbridge Wells Borough Council election
PartyThis electionFull councilThis election
SeatsNetSeats %OtherTotalTotal %VotesVotes %+/−
  Liberal Democrats 6Increase2.svg 437.5111735.46,37922.4-4.4
  Conservative 2Decrease2.svg 912.5131529.29,15032.1-4.8
  Alliance 5Increase2.svg 331.34920.86,13421.5+8.7
  Labour 3Increase2.svg 218.84714.65,57319.6+2.8
  Green 0Steady2.svg0.0000.01,1404.0-2.4
  UKIP 0Steady2.svg0.0000.01030.4+0.1
  Socialist (GB) 0Steady2.svg0.0000.011<0.1N/A

Ward results

Benenden & Cranbrook

Benenden & Cranbrook
PartyCandidateVotes%±%
Conservative Thomas Dawlings 766 43.1 -5.5
Alliance Lee Hatcher67538.0+9.1
Labour Dariel Francis1749.8+2.6
Green Julie Simpson1629.1+2.8
Majority915.1
Turnout 1,77733.8
Conservative hold Swing Decrease2.svg7.3

Brenchley & Horsmonden

Brenchley & Horsmonden
PartyCandidateVotes%±%
Alliance Stephen Mcmillan 755 45.1 +18.4
Conservative Thomas Mobbs55633.2-12.5
Labour Kevin Kerrigan22513.4+0.7
Green Louise Wilby1398.3-0.5
Majority19911.9
Turnout 1,67540.5
Alliance gain from Conservative Swing Increase2.svg15.5

Broadwater

Broadwater
PartyCandidateVotes%±%
Liberal Democrats Jamie Johnson 429 34.1 +0.4
Green Adrian Thorne37629.9+3.5
Conservative Christopher Woodward29623.5-7.2
Labour Anne Musker725.7-1.2
Alliance Pennt Kift685.4N/A
UKIP Alun Elder-Brown181.4-0.9
Majority534.2
Turnout 1,25939.6
Liberal Democrats gain from Conservative Swing Decrease2.svg1.6

Culverden

Culverden
PartyCandidateVotes%±%
Liberal Democrats Martin Brice 1,313 54.6 +0.9
Conservative David Scott73230.4-2.6
Labour Stephen Burgess27611.5-1.8
UKIP Victor Webb853.5N/A
Majority58124.2
Turnout 2,40639.0
Liberal Democrats gain from Conservative Swing Increase2.svg1.8

Hawkhurst & Sandhurst

Hawkhurst & Sandhurst
PartyCandidateVotes%±%
Alliance Ellen Neville 868 48.1 +26.8
Conservative Patrick Thomson74641.4-16.8
Labour Ana-Mari Draper19010.5+2.1
Majority1226.7
Turnout 1,804
Alliance gain from Conservative Swing Increase2.svg21.8

Paddock Wood East

Paddock Wood East
PartyCandidateVotes%±%
Alliance Suzie Wakeman 577 48.0 N/A
Conservative Sarah Hamilton39132.5+1.1
Labour Derek Boyle17514.5+2.5
Green Penelope Peerless605.0-3.9
Majority18615.5
Turnout 1,203
Alliance gain from Conservative Swing N/A

Paddock Wood West

Paddock Wood West
PartyCandidateVotes%±%
Labour Raymond Moon 397 36.2 +5.3
Conservative Vivek Gautam30127.4-11.2
Alliance Begnat Robichaud21719.8N/A
Green Trevor Bisdee13312.1-13.4
Liberal Democrats James Cole504.6-0.3
Majority968.8
Turnout 1,09836.9
Labour gain from Conservative Swing Increase2.svg8.3

Pantiles & St. Mark's

Pantiles & St. Mark's
PartyCandidateVotes%±%
Liberal Democrats Gavin Barrass 1,386 58.4 +10.3
Conservative Dogan Delman71530.1-6.0
Green John Hurst1325.6-3.1
Labour Lorna Blackmore1305.5-1.5
Socialist (GB) Shannon Kennedy110.5N/A
Majority67128.3
Turnout 2,37445.1
Liberal Democrats gain from Conservative Swing Increase2.svg8.2

Park

Park
PartyCandidateVotes%±%
Alliance Nicholas Pope 902 37.0 +11.6
Conservative Sedat Zorba79332.5-3.2
Liberal Democrats Julia Luxford43717.9+1.2
Labour Susan Pound30812.6-0.8
Majority1094.5
Turnout 2,44041.9
Alliance hold Swing Increase2.svg7.4

Pembury

Pembury
PartyCandidateVotes%±%
Conservative Paul Barrington-King 808 46.1 -0.1
Alliance Angela Ward75042.8+8.4
Labour Philip Wheeler19411.1+0.5
Majority583.3
Turnout 1,75240.0
Conservative hold Swing Decrease2.svg4.3

Sherwood

Sherwood
PartyCandidateVotes%±%
Labour Shadi Rogers 930 53.4 +15.2
Conservative Robert Backhouse81346.6-4.1
Majority1176.8
Turnout 1,74330.9
Labour gain from Conservative Swing Increase2.svg9.7

Southborough & High Brooms

Southborough & High Brooms
PartyCandidateVotes%±%
Labour Alain Lewis 1,033 60.3 +7.8
Conservative Nasir Jamil43625.5-3.8
Liberal Democrats Yvonne Raptis24314.2+6.0
Majority59734.8
Turnout 1,71231.3
Labour hold Swing Increase2.svg5.8

Southborough North

Southborough North
PartyCandidateVotes%±%
Liberal Democrats Brendon Le Page 630 43.8 -8.4
Conservative Joseph Simmons60442.0+10.5
Labour John Francis20314.1+3.8
Majority261.8
Turnout 1,43743.8
Liberal Democrats gain from Conservative Swing Decrease2.svg9.5

Speldhurst & Bidborough

Speldhurst & Bidborough
PartyCandidateVotes%±%
Alliance Matthew Sankey 1,322 64.6 +37.6
Conservative Clive Allen57928.3-11.1
Labour Millie Gray1467.1-0.5
Majority74336.3
Turnout 2,04744.6
Alliance hold Swing Increase2.svg24.4

St. James'

St. James'
PartyCandidateVotes%±%
Liberal Democrats Robert Wormington 984 62.8 -6.2
Conservative Nicola King22914.6-1.9
Labour Alan Bullion21713.8-0.7
Green Alasdair Fraser1388.8N/A
Majority75548.2
Turnout 1,56835.9
Liberal Democrats hold Swing Decrease2.svg2.2

St. John's

St. John's
PartyCandidateVotes%±%
Liberal Democrats Mark Ellis 907 41.3 -7.9
Labour Michael Tapp90341.1+15.5
Conservative Thelma Huggett38517.5-7.7
Majority40.2
Turnout 2,19542.5
Liberal Democrats hold Swing Decrease2.svg11.7

Related Research Articles

<span class="mw-page-title-main">Royal Tunbridge Wells</span> Town in Kent, England

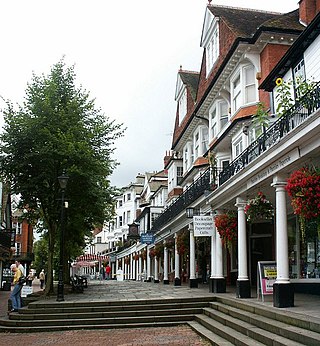
Royal Tunbridge Wells is a town in Kent, England, 30 miles southeast of central London. It lies close to the border with East Sussex on the northern edge of the High Weald, whose sandstone geology is exemplified by the rock formation High Rocks. The town was a spa in the Restoration and a fashionable resort in the mid-1700s under Beau Nash when the Pantiles, and its chalybeate spring, attracted visitors who wished to take the waters. Though its popularity as a spa town waned with the advent of sea bathing, the town still derives much of its income from tourism.

<span class="mw-page-title-main">Borough of Tunbridge Wells</span> Non-metropolitan district in England

The Borough of Tunbridge Wells is a local government district and borough in Kent, England. It takes its name from its main town, Royal Tunbridge Wells.

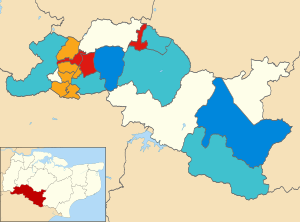
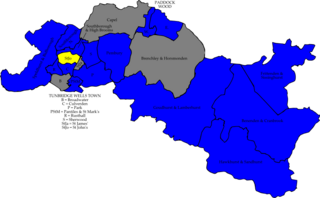
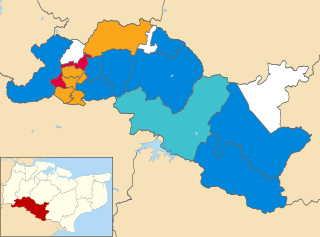
One third of Tunbridge Wells Borough Council in Kent, England, is elected each year, followed by one year without election. Since the last boundary changes in 2002, 48 councillors have been elected from 20 wards.

The 1998 Tunbridge Wells Borough Council election took place on 7 May 1998 to elect members of Tunbridge Wells Borough Council in Kent, England. One third of the council was up for election and the Conservative Party gained overall control of the council from no overall control.

The 1999 Tunbridge Wells Borough Council election took place on 6 May 1999 to elect members of Tunbridge Wells Borough Council in Kent, England. One third of the council was up for election and the Conservative Party stayed in overall control of the council.

The 2000 Tunbridge Wells Borough Council election took place on 4 May 2000 to elect members of Tunbridge Wells Borough Council in Kent, England. One third of the council was up for election and the Conservative Party stayed in overall control of the council.

The 2002 Tunbridge Wells Borough Council election took place on 2 May 2002 to elect members of Tunbridge Wells Borough Council in Kent, England. The whole council was up for election with boundary changes since the last election in 2000. The Conservative Party stayed in overall control of the council.

The 2003 Tunbridge Wells Borough Council election took place on 1 May 2003 to elect members of Tunbridge Wells Borough Council in Kent, England. One third of the council was up for election and the Conservative Party stayed in overall control of the council.

The 2004 Tunbridge Wells Borough Council election took place on 10 June 2004 to elect members of Tunbridge Wells Borough Council in Kent, England. One third of the council was up for election and the Conservative Party stayed in overall control of the council.

<span class="mw-page-title-main">2006 Tunbridge Wells Borough Council election</span>

The 2006 Tunbridge Wells Borough Council election took place on 4 May 2006 to elect members of Tunbridge Wells Borough Council in Kent, England. One third of the council was up for election and the Conservative Party stayed in overall control of the council.

<span class="mw-page-title-main">2007 Tunbridge Wells Borough Council election</span>

The 2007 Tunbridge Wells Borough Council election took place on 3 May 2007 to elect members of Tunbridge Wells Borough Council in Kent, England. One third of the council was up for election and the Conservative Party stayed in overall control of the council.

<span class="mw-page-title-main">2008 Tunbridge Wells Borough Council election</span>

The 2008 Tunbridge Wells Borough Council election took place on 1 May 2008 to elect members of Tunbridge Wells Borough Council in Kent, England. One third of the council was up for election and the Conservative Party stayed in overall control of the council.

<span class="mw-page-title-main">2010 Tunbridge Wells Borough Council election</span>

The 2010 Tunbridge Wells Borough Council election took place on 6 May 2010 to elect members of Tunbridge Wells Borough Council in Kent, England. One third of the council was up for election and the Conservative Party stayed in overall control of the council.

The 2012 Tunbridge Wells Borough Council election was scheduled to take place on Thursday 3 May 2012 to elect members of Tunbridge Wells Borough Council in Kent, England. One third of the council was up for election.

The 2014 Tunbridge Wells Borough Council election took place on 22 May 2014 to elect members of Tunbridge Wells Borough Council in England. This was on the same day as other local elections.

The 2015 Tunbridge Wells Borough Council election took place on 7 May 2015 to elect members of the Tunbridge Wells Borough Council in England. It was held on the same day as other local elections.

The 2016 Tunbridge Wells Borough Council election took place on 5 May 2016 to elect members of Tunbridge Wells Borough Council in England. This was on the same day as other local elections.

The 2018 Tunbridge Wells Borough Council election took place on 3 May 2018 to elect members of Tunbridge Wells Borough Council in England. This was on the same day as other local elections.

The 2019 Tunbridge Wells Borough Council election took place on 2 May 2019 to elect one third of Tunbridge Wells Borough Council in England. The Conservatives retained control of the council, but with a reduced majority.

<span class="mw-page-title-main">2021 Tunbridge Wells Borough Council election</span> Council election

The 2021 Tunbridge Wells Borough Council election took place on 6 May 2021 to elect one third of Tunbridge Wells Borough Council in England.

References

  1. "Borough Election, May 2022 - Thursday, 5th May, 2022". Tunbidge Wells Borough Council. Retrieved 9 May 2022.