2022 Cumberland Council election

Last updated
2022 Cumberland Council election
County Flag of Cumbria.svg
5 May 2022 (2022-05-05)2027 

All 46 seats to Cumberland Council
24 seats needed for a majority
 First partySecond partyThird party
  No image wide.svg No image wide.svg No image wide.svg
Party Labour Conservative Liberal Democrats
Seats won3074
Popular vote29,58625,8426,677
Percentage39.1%34.1%8.8%

 Fourth partyFifth party
  No image wide.svg No image wide.svg
Party Independent Green
Seats won32
Popular vote9,1444,074
Percentage12.1%5.4%

Council control after election


Labour

The first election to Cumberland Council was held on 5 May 2022. All 46 seats were up for election.

Contents

Results

Labour won 30 seats with a majority of 14. [1]

2022 Cumberland Council Election Results Map.png
PartyCouncillorsVotes
Of totalNetOf totalNet
Labour Party 30
30 / 46
29,58639.1%
Conservative Party 7
7 / 46
25,84234.1%
Independents 3
3 / 46
9,14412.1%
Liberal Democrats 4
4 / 46
6,6778.8%
Green 2
2 / 46
4,0745.4%
Trade Unionist and Socialist Coalition 0
0 / 46
2560.3%
Reform UK 0
0 / 46
690.1%
Heritage Party 0
0 / 46
500.1%

Changes are shown from the Cumbria County Council elections in 2017

Ward results (Allerdale area)

Aspatria

Aspatria
PartyCandidateVotes%±%
Independent Kevin Thurlow 575 40.0 N/A
Conservative John Cook45431.6−7.8
Labour Peter Kendall27319.0+1.6
Green Alison Parker795.5N/A
Liberal Democrats Lauren Exley553.8−32.6
Turnout 1,43634.5
Independent gain from Conservative Swing

Bothel & Wharrels

Bothel & Wharrels
PartyCandidateVotes%±%
Green Jill Perry 870 42.5 +9.3
Conservative Malcolm Grainger80539.3−27.5
Independent Fran Eilbeck37418.3N/A
Turnout 2,04948.9
Green gain from Conservative Swing

Cockermouth North

Cockermouth North
PartyCandidateVotes%±%
Labour Helen Tucker 1,025 44.9 +18.1
Conservative Catherine Bell89639.3+9.4
Liberal Democrats Fiona Jayatilaka36015.8−24.0
Turnout 2,28143.2
Labour gain from Liberal Democrats Swing

Cockermouth South

Cockermouth South
PartyCandidateVotes%±%
Labour Andrew Semple 1,065 44.8 +15.6
Conservative Michael Pemberton87836.9−19.3
Green Keith Fitton2279.5+5.2
Liberal Democrats Stephen Barnes2078.7−1.6
Turnout 2,37747.7
Labour gain from Conservative Swing

Dearham & Broughton

Dearham & Broughton
PartyCandidateVotes%±%
Labour Martin Harris 806 43.9 +4.9
Conservative Neil Rumbold54729.8−19.2
Independent Nicky Cockburn48426.3N/A
Turnout 1,83738.8
Labour gain from Conservative Swing

Harrington

Harrington
PartyCandidateVotes%±%
Labour Denise Rollo 605 42.3 +9.9
Conservative Chris Clarkin35024.5+10.1
Independent Hilary Harrington29420.6N/A
Independent Herbert Briggs18112.7N/A
Turnout 1,43029.7
Labour gain from Independent Swing

Keswick

Keswick
PartyCandidateVotes%±%
Labour Markus Campbell-Savours 1,340 67.9 +16.3
Independent Clive Hutchby31916.2N/A
Conservative Elaine Haraldsen31516.0−17.6
Turnout 1,97446.3
Labour hold Swing

Maryport North

Maryport North
PartyCandidateVotes%±%
Labour Carni McCarron-Holmes 675 37.7 −1.0
Independent George Kemp64536.0−1.7
Conservative Steve Newton-Lister47226.3+7.7
Turnout 1,79236.7
Labour hold Swing

Maryport South

Maryport South
PartyCandidateVotes%±%
Labour Bill Pegram 692 54.5 −18.2
Independent James Kirkbride38430.3N/A
Conservative Anthony Todd19315.2−5.9
Turnout 1,26926.9
Labour hold Swing

Moss Bay and Moorclose

Moss Bay and Moorclose
PartyCandidateVotes%±%
Independent Stephen Stoddart 631 45.2 −9.9
Labour Neil Schofield56040.1+8.6
Conservative Jacqueline Kirkbride20414.6+2.4
Turnout 1,39527.7
Independent hold Swing

Seaton

Seaton
PartyCandidateVotes%±%
Labour Jimmy Grisdale 766 45.1 −3.4
Conservative Colin Sharpe53531.5−15.2
Independent Paul Scott25214.8N/A
Green Alistair Grey764.5−0.3
Reform UK David Surtees694.1N/A
Turnout 1,69835.1
Labour hold Swing

Solway Coast

Solway Coast
PartyCandidateVotes%±%
Conservative Tony Markley 993 66.6 +16.2
Green Sharon Watson49833.4+29.4
Turnout 1,49134.4
Conservative hold Swing

St John's & Great Clifton

St John's & Great Clifton
PartyCandidateVotes%±%
Labour Mark Fryer 859 44.4 +8.3
Conservative Deb Garton57129.5+8.5
Independent Peter Gaston43922.7N/A
Green Fliss Watts663.4+0.4
Turnout 1,93538.0
Labour gain from Independent Swing

St Michael's

St Michael's
PartyCandidateVotes%±%
Labour Barbara Cannon 649 48.6 −16.2
Independent Will Wilkinson34726.0N/A
Conservative John Connell28721.5−1.0
Liberal Democrats Margaret Bennett534.0−5.7
Turnout 1,33629.7
Labour hold Swing

Thursby

Thursby
PartyCandidateVotes%±%
Conservative Mike Johnson 906 48.5 −24.8
Independent Jonathan Graham45224.2N/A
Labour Shane McCarthy32817.6−1.8
Liberal Democrats Roger Peck945.0N/A
Green Dianne Standen874.7−2.6
Turnout 1,86743.4
Conservative hold Swing

Wigton

Wigton
PartyCandidateVotes%±%
Labour Elaine Lynch 738 39.7 −13.4
Conservative Alan Pitcher71438.4−5.9
Independent Sandra Hodson40721.9N/A
Turnout 1,85934.2
Labour hold Swing

Ward results (Carlisle area)

Belah

Belah
PartyCandidateVotes%±%
Green Helen Davison 944 45.4 N/A
Conservative Gareth Ellis75636.4−11.9
Labour David Graham27713.3−14.1
Independent Alan Toole1014.9−19.4
Turnout 2,07842.5
Green gain from Conservative Swing

Belle Vue

Belle Vue
PartyCandidateVotes%±%
Labour Abdul Harid 788 52.7 +6.6
Conservative James Bainbridge70647.3+2.3
Turnout 1,49432.1
Labour hold Swing

Botcherby

Botcherby
PartyCandidateVotes%±%
Independent Robert Betton 553 39.6 −10.4
Labour Louise Atkinson47033.6+6.9
Conservative Marilyn Bowman30521.8+0.9
Green Robert Inglis694.9+2.4
Turnout 1,39729.5
Independent hold Swing

Brampton

Brampton
PartyCandidateVotes%±%
Conservative Mike Mitchelson 752 42.9 −12.6
Green Tom Adams72041.0+32.9
Labour Iain Owens28216.1−4.6
Turnout 1,75439.9
Conservative hold Swing

Castle

Castle
PartyCandidateVotes%±%
Labour Anne Glendinning 562 48.2 +4.8
Green Gavin Hawkton31326.8+21.9
Conservative Syed Ali26422.6−11.1
TUSC Rob Heal272.3N/A
Turnout 1,16629.2
Labour hold Swing

Corby & Hayton

Corby & Hayton
PartyCandidateVotes%±%
Liberal Democrats Roger Dobson 1,090 59.9 +49.7
Independent Raymond Tinnion42323.3N/A
Conservative Timothy Cheetham30616.8−18.2
Turnout 1,81946.6
Liberal Democrats gain from Independent Swing

Currock

Currock
PartyCandidateVotes%±%
Labour Lisa Brown 630 63.2 +8.7
Conservative Fiona Robson28628.7−1.3
TUSC Brent Kennedy818.1N/A
Turnout 99724.1
Labour hold Swing

Dalston & Burgh

Dalston & Burgh
PartyCandidateVotes%±%
Liberal Democrats Trevor Allison 1,142 47.7 +0.7
Conservative James White77932.6−9.3
Labour Alex Key47219.7+8.6
Turnout 2,39340.0
Liberal Democrats hold Swing

Denton Holme

Denton Holme
PartyCandidateVotes%±%
Labour Christopher Southward 779 58.8 −1.2
Conservative Ann McKerrell32924.8−2.2
Liberal Democrats Stuart Kelly1188.9N/A
TUSC Grahame Higginson997.5N/A
Turnout 1,32528.4
Labour hold Swing

Harraby North

Harraby North
PartyCandidateVotes%±%
Labour Cyril Weber 708 64.6 −2.7
Conservative Robert Currie33930.9−1.8
TUSC Ernie Percival494.5N/A
Turnout 1,09624.4
Labour hold Swing

Harraby South

Harraby South
PartyCandidateVotes%±%
Labour Lucy Patrick 634 40.9 −3.9
Conservative Linda Mitchell54735.3−8.4
Independent Sean Reed36923.8N/A
Turnout 1,55035.3
Labour hold Swing

Houghton & Irthington

Houghton & Irthington
PartyCandidateVotes%±%
Conservative John Mallinson 1,024 59.2 −6.5
Liberal Democrats Paul Nettleton38922.5+14.2
Labour Beth Furneaux31718.3+2.8
Turnout 1,73039.9
Conservative hold Swing

Longtown

Longtown
PartyCandidateVotes%±%
Liberal Democrats Timothy Pickstone 949 66.2 N/A
Conservative Sam Bown48533.8−40.2
Turnout 1,43436.9
Liberal Democrats gain from Conservative Swing

Morton

Morton
PartyCandidateVotes%±%
Labour Anne Quilter 630 46.5 −12.4
Conservative Neville Lishman59944.2+9.3
Green Donna Bertoletti1259.2+3.0
Turnout 1,35430.3
Labour hold Swing

Stanwix Urban

Stanwix Urban
PartyCandidateVotes%±%
Liberal Democrats Brian Wernham 1,472 60.7 N/A
Conservative Elizabeth Mallinson55923.1−33.9
Labour Paul Atkinson27111.2−16.6
Independent Paul Nedved1235.1N/A
Turnout 2,42552.2
Liberal Democrats gain from Conservative Swing

Upperby

Upperby
PartyCandidateVotes%±%
Labour Chris Wills 744 65.8 +13.3
Conservative Leighton Rees38634.2+3.2
Turnout 1,13025.9
Labour hold Swing

Wetheral

Wetheral
PartyCandidateVotes%±%
Conservative Geoff Mitchell 1,173 53.3 −11.9
Labour Ruth Alcroft60727.6+12.5
Liberal Democrats Julia Dobson41919.1+3.7
Turnout 2,19940.3
Conservative hold Swing

Yewdale

Yewdale
PartyCandidateVotes%±%
Labour Jeanette Whalen 944 54.2 +16.4
Conservative Stephen Haraldsen79745.8−0.7
Turnout 1,74137.9
Labour gain from Conservative Swing

Ward results (Copeland area)

Bransty

Bransty
PartyCandidateVotes%±%
Labour Joseph Ghayouba 1,043 63.4 +24.1
Conservative Charles Maudling46128.0+12.6
Independent Ryan Redmond714.3N/A
Independent Sean Cullen694.2N/A
Turnout 1,64438.5
Labour gain from Conservative Swing

Charles Maudling stood as an Independent in 2017, and the change is shown from his vote in that election. The change from the Conservative candidate's vote was -14.6%.

Cleator Moor East & Frizington

Cleator Moor East & Frizington
PartyCandidateVotes%±%
Labour Linda Jones-Bulman 847 58.9 +13.0
Conservative Christopher Turner44330.8−16.4
Independent Aliscia Wood14910.4N/A
Turnout 1,43934.2
Labour gain from Conservative Swing

Cleator Moor West

Cleator Moor West
PartyCandidateVotes%±%
Labour Michael Eldon 1,087 72.1 +21.4
Conservative Ged McGrath34322.8−4.8
Independent Rhiannon Connors775.1N/A
Turnout 1,50733.7
Labour hold Swing

Egremont

Egremont
PartyCandidateVotes%±%
Labour Sam Pollen 1,185 72.1 +18.3
Conservative Jeffrey Hailes46522.8−23.4
Independent Shane Branthwaite975.1N/A
Turnout 1,74738.1
Labour hold Swing

Egremont North & St Bees

Egremont North & St Bees
PartyCandidateVotes%±%
Labour Reginald Minshaw 747 50.5 +18.5
Conservative Chri Whiteside57238.7−4.0
Independent Louis Thomason15910.8N/A
Turnout 1,47834.5
Labour gain from Conservative Swing

Gosforth

Gosforth
PartyCandidateVotes%±%
Conservative David Moore 989 48.4 −12.5
Labour James Dickaty91644.8+28.2
Liberal Democrats Mike Minogue1396.8N/A
Turnout 2,04443.6
Conservative hold Swing

Hillcrest & Hensingham

Hillcrest & Hensingham
PartyCandidateVotes%±%
Labour Jeanette Forster 831 51.6 +2.1
Conservative Hugh O'Kane56835.3−15.2
Independent Edwin Dinsdale21113.1N/A
Turnout 1,61037.7
Labour gain from Conservative Swing

Howgate

Howgate
PartyCandidateVotes%±%
Labour Gillian Troughton 678 45.5 +2.2
Conservative Martin Barbour50033.6−14.0
Independent Kevin Young23816.0N/A
Heritage William Dixon503.4N/A
Independent Eren McGuire231.5N/A
Turnout 1,48933.8
Labour gain from Conservative Swing

Kells & Sandwith

Kells & Sandwith
PartyCandidateVotes%±%
Labour Emma Williamson 1,046 73.6 +21.8
Conservative Arthur Creighton30221.3−10.4
Independent Tanisha Dobinson735.1N/A
Turnout 1,42129.1
Labour hold Swing

Millom

Millom
PartyCandidateVotes%±%
Labour Bob Kelly 667 51.4 +20.0
Conservative Doug Wilson63048.6−20.0
Turnout 1,29730.1
Labour gain from Conservative Swing

Millom Without

Millom Without
PartyCandidateVotes%±%
Conservative Andy Pratt 862 55.3 −17.6
Labour Anne Todd50732.5+14.7
Liberal Democrats Jeff Amos19012.2N/A
Turnout 1,55940.5
Conservative hold Swing

Mirehouse

Mirehouse
PartyCandidateVotes%±%
Labour Mike Hawkins 536 39.6 −26.6
Independent Wammo Walmsley47735.2N/A
Conservative Oliver Dorgan19514.4−19.4
Independent Gemma Dinsdale1128.3N/A
Independent Tony Lowrey352.6N/A
Turnout 1,35533.6
Labour hold Swing

By-elections

Harraby North

Harraby North: 27 June 2024 [3]
PartyCandidateVotes%±%
Labour Justin McDermott 455 60.5 −4.1
Conservative Robert Currie16521.9−9.0
Liberal Democrats Sarah Wills709.3N/A
Green Perri Conner628.2N/A
Majority29038.6
Turnout 75216.64−7.8
Labour hold Swing

Keswick

Keswick: 17 October 2024 [4]
PartyCandidateVotes%±%
Labour Sally Lansbury 513 50.7 −17.2
Conservative Graham King38438.0+22.0
Green Jane Hall858.4N/A
Liberal Democrats John Rivers292.9N/A
Majority12912.7
Turnout 1,01124.46−21.8
Labour hold Swing

Wetheral

Wetheral: 17 October 2024 [5]
PartyCandidateVotes%±%
Conservative Gareth Ellis 665 51.6 −1.7
Liberal Democrats Sarah Wills46335.9+16.8
Labour Ruth Alcroft16012.4−15.2
Majority20215.7
Turnout 1,28822.17−18.1
Conservative hold Swing

Related Research Articles

<span class="mw-page-title-main">Carlisle (UK Parliament constituency)</span> Parliamentary constituency in the United Kingdom, 1295 onwards

Carlisle is a constituency in Cumbria represented in the House of Commons of the UK Parliament since 2024 by Julie Minns of the Labour Party.

<span class="mw-page-title-main">Copeland (UK Parliament constituency)</span> Parliamentary constituency in the United Kingdom, 1983-2024

Copeland was a constituency in Cumbria created in 1983 and represented in the House of Commons of the UK Parliament. The constituency was represented in Parliament by Trudy Harrison, of the Conservative Party, from a by-election in February 2017 until its abolition for the 2024 general election. The seat had been held by Labour candidates at elections between 1983 and 2015 inclusive.

<span class="mw-page-title-main">Penrith and The Border (UK Parliament constituency)</span> Parliamentary constituency in the United Kingdom, 1950–2024

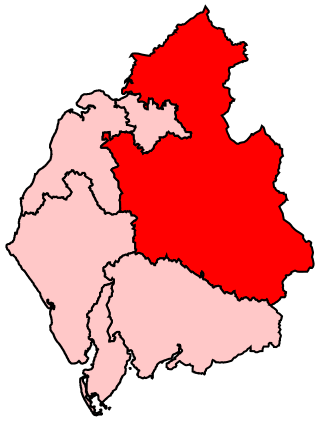
Penrith and The Border was a constituency in Cumbria represented in the House of Commons of the UK Parliament. Throughout its existence it elected only members of the Conservative Party.

The election of councillors to Allerdale Borough Council in Cumbria, England took place every four years. The council was established in 1974 and it was abolished in 2023. The last elections were in 2019.

The district of Epping Forest is in the county of Essex in England. It was created on 1 April 1974, following the merger of Epping Urban District, Chigwell Urban District, Waltham Holy Cross Urban District, and part of Epping and Ongar Rural District.

Birmingham City Council elections are held every four years. Birmingham City Council is the local authority for the metropolitan district of Birmingham in the West Midlands, England. Since the last boundary changes in 2018, 101 councillors have been elected from 69 wards. Prior to 2018 elections were held three years out of every four, with a third of the council elected each time.

Fenland District Council in Cambridgeshire, England is elected every four years. Since the last boundary changes in 2023, the council has comprised 43 councillors representing 18 wards, with each ward electing one, two or three councillors.

One third of Crawley Borough Council in West Sussex, England is elected each year, followed by one year without election. Since the last boundary changes in 2019, 36 councillors have been elected from 13 wards.

North Somerset Council is the local authority for the unitary authority of North Somerset, England. Until 1 April 1996 it was a non-metropolitan district called Woodspring, in the county of Avon.

Hertfordshire County Council in England is elected every four years. Since the last boundary changes took effect in 2017 there have been 78 electoral divisions electing one councillor each.

Hull City Council elections are held three years out of every four to elect members of Hull City Council, the unitary authority which governs the city of Kingston upon Hull in the East Riding of Yorkshire, England. Since the last boundary changes in 2018, the council has comprised 57 councillors representing 21 wards with each ward electing either 2 or 3 councillors.

<span class="mw-page-title-main">Ashfield Independents</span> Political party in Ashfield, Nottinghamshire

The Ashfield Independents are a political party in the Ashfield District in Nottinghamshire, England.

<span class="mw-page-title-main">2022 Birmingham City Council election</span> 2022 local election in Birmingham

The 2022 Birmingham City Council election took place on 5 May 2022, with all 101 council seats up for election across 37 single-member and 32 two-member wards. The election was held alongside other local elections across Great Britain and town council elections in Sutton Coldfield.

<span class="mw-page-title-main">2022 Bromley London Borough Council election</span> 2022 local election in Bromley

The 2022 Bromley London Borough Council election took place on 5 May 2022. All 58 members of Bromley London Borough Council were elected. The elections took place alongside local elections in the other London boroughs and elections to local authorities across the United Kingdom.

<span class="mw-page-title-main">2022 Lambeth London Borough Council election</span>

The 2022 Lambeth London Borough Council election took place on 5 May 2022. All 63 members of Lambeth London Borough Council were elected. The elections took place alongside local elections in the other London boroughs and elections to local authorities across the United Kingdom.

<span class="mw-page-title-main">Cumberland (unitary authority)</span> District in Cumbria, England

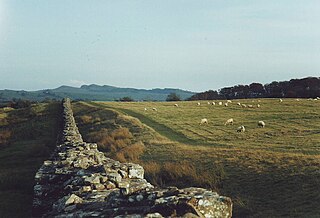
Cumberland is a unitary authority area in Cumbria, England, which means that it is a non-metropolitan county and district. It borders Scotland, Northumberland, Westmorland and Furness, and the Irish Sea. Part of the area is in the Lake District National Park and notable landmarks include Carlisle Cathedral, Carlisle Castle and Hadrian's Wall.

<span class="mw-page-title-main">2022 Stirling Council election</span> 2022 Scottish local government election

The 2022 Stirling Council election was held on 5 May 2022, the same day as the 31 other local authorities in Scotland. The election used the seven wards created under the Local Governance (Scotland) Act 2004, with 23 councillors being elected. Each ward elected either 3 or 4 members, using the STV electoral system.

All 46 members of Cumberland Council, a unitary authority in England, are elected every four years.

<span class="mw-page-title-main">Penrith and Solway (UK Parliament constituency)</span> Parliamentary constituency in the United Kingdom, 2024 onwards

Penrith and Solway is a constituency of the House of Commons in the UK Parliament Further to the completion of the 2023 Periodic Review of Westminster constituencies, it was contested for the first time at the 2024 general election, since when it has been represented by Markus Campbell-Savours of the Labour Party.

References

  1. BBC https://www.bbc.co.uk/news/election/2022/england/councils/E07000247
  2. "Cumberland Council election - 5 May 2022". Shadow Authority for Cumberland Council. Retrieved 5 May 2022.
  3. "Cumberland Council Harraby North Ward by-election". www.cumberland.gov.uk. Retrieved 4 October 2024.
  4. "Keswick Ward and Wetheral Ward By-Elections". www.cumberland.gov.uk. Retrieved 4 October 2024.
  5. "Keswick Ward and Wetheral Ward By-Elections". www.cumberland.gov.uk. Retrieved 4 October 2024.