| ||||||||||||||||||||||||||||||||||||||||||||||||||||||||||||||||||||
17 out of 48 seats to Cherwell District Council 25 seats needed for a majority | ||||||||||||||||||||||||||||||||||||||||||||||||||||||||||||||||||||
---|---|---|---|---|---|---|---|---|---|---|---|---|---|---|---|---|---|---|---|---|---|---|---|---|---|---|---|---|---|---|---|---|---|---|---|---|---|---|---|---|---|---|---|---|---|---|---|---|---|---|---|---|---|---|---|---|---|---|---|---|---|---|---|---|---|---|---|---|
| ||||||||||||||||||||||||||||||||||||||||||||||||||||||||||||||||||||
Winner of each seat at the 2022 Cherwell District Council election | ||||||||||||||||||||||||||||||||||||||||||||||||||||||||||||||||||||
|
The 2022 Cherwell District Council election was held on 5 May 2022 to elect members of Cherwell District Council in England. [1] This was on the same day as other local elections.
2022 Cherwell District Council election | ||||||||||
---|---|---|---|---|---|---|---|---|---|---|
Party | This election | Full council | This election | |||||||
Seats | Net | Seats % | Other | Total | Total % | Votes | Votes % | +/− | ||
Conservative | 6 | 6 | 35.3 | 19 | 25 | 52.1 | 16,169 | 38.4 | -9.3 | |
Labour | 4 | 2 | 23.5 | 6 | 10 | 20.8 | 10,434 | 24.8 | +2.0 | |
Liberal Democrats | 5 | 4 | 29.4 | 2 | 7 | 14.6 | 11,120 | 26.4 | +11.3 | |
Independent | 1 | 1 | 5.9 | 3 | 4 | 8.3 | 1,092 | 2.6 | -2.1 | |
Green | 1 | 1 | 5.9 | 1 | 2 | 4.2 | 3,241 | 7.7 | -2.0 | |
Party | Candidate | Votes | % | ±% | |
---|---|---|---|---|---|
Liberal Democrats | David Hingley | 1,801 | 59.9 | +29.7 | |
Conservative | Tony Mepham | 902 | 30.0 | -21.9 | |
Labour | Sian Tohill-Martin | 305 | 10.1 | -7.8 | |
Majority | 899 | 29.9 | |||
Turnout | 3,008 | 40.5 | |||
Liberal Democrats gain from Conservative | Swing | 25.8 | |||
Party | Candidate | Votes | % | ±% | |
---|---|---|---|---|---|
Conservative | Ian Harwood | 1,320 | 46.7 | -9.2 | |
Labour | Isabel Creed | 1,207 | 42.7 | +19.2 | |
Liberal Democrats | Robert Pattenden | 301 | 10.6 | +4.2 | |
Majority | 113 | 4.0 | |||
Turnout | 2,828 | 33.1 | |||
Conservative hold | Swing | 14.2 | |||
Party | Candidate | Votes | % | ±% | |
---|---|---|---|---|---|
Labour | Chuk Okeke | 1,103 | 50.8 | +5.6 | |
Conservative | Fiaz Ahmed | 769 | 35.4 | -2.8 | |
Liberal Democrats | Ash Haeger | 300 | 13.8 | +9.1 | |
Majority | 334 | 15.4 | |||
Turnout | 2,172 | 29.5 | |||
Labour hold | Swing | 4.2 | |||
Party | Candidate | Votes | % | ±% | |
---|---|---|---|---|---|
Labour Co-op | Rebecca Biegel | 1,158 | 56.5 | +8.3 | |
Conservative | Ben Dalton | 556 | 27.1 | -8.1 | |
Green | Karl Kwiatkowski | 176 | 8.6 | -2.1 | |
Liberal Democrats | David Yeomans | 159 | 7.8 | +1.9 | |
Majority | 602 | 29.4 | |||
Turnout | 2,049 | 29.0 | |||
Labour Co-op hold | Swing | 8.2 | |||
Party | Candidate | Votes | % | ±% | |
---|---|---|---|---|---|
Labour | Andrew Crichton | 798 | 43.2 | +9.7 | |
Conservative | Tony Ilott | 717 | 38.8 | -8.7 | |
Green | Alison Nuttall | 182 | 9.9 | +3.5 | |
Liberal Democrats | Andrew Raisbeck | 150 | 8.1 | +4.9 | |
Majority | 81 | 4.4 | |||
Turnout | 1,847 | 25.2 | |||
Labour gain from Conservative | Swing | 9.2 | |||
Party | Candidate | Votes | % | ±% | |
---|---|---|---|---|---|
Labour | Amanda Watkins | 922 | 55.7 | +4.1 | |
Conservative | Hayne Strangwood | 562 | 33.9 | -3.0 | |
Liberal Democrats | Steve Buckwell | 172 | 10.4 | +6.1 | |
Majority | 360 | 21.8 | |||
Turnout | 1,656 | 23.7 | |||
Labour hold | Swing | 3.6 | |||
Party | Candidate | Votes | % | ±% | |
---|---|---|---|---|---|
Conservative | Donna Ford | 947 | 48.0 | -1.0 | |
Green | Damien Maguire | 544 | 27.6 | +4.4 | |
Labour | Samuel Akbur | 483 | 24.5 | +5.4 | |
Majority | 403 | 20.4 | |||
Turnout | 1,974 | 31.5 | |||
Conservative hold | Swing | 2.7 | |||
Party | Candidate | Votes | % | ±% | |
---|---|---|---|---|---|
Conservative | Nick Mawer | 797 | 40.9 | -11.8 | |
Labour | Arjunsingh Bais | 546 | 28.0 | +7.3 | |
Liberal Democrats | Simon Lytton | 386 | 19.8 | +7.5 | |
Green | Amanda Maguire | 218 | 11.2 | -3.2 | |
Majority | 251 | 12.9 | |||
Turnout | 1,947 | 30.0 | |||
Conservative hold | Swing | 9.6 | |||
Party | Candidate | Votes | % | ±% | |
---|---|---|---|---|---|
Liberal Democrats | Christopher Pruden | 1,732 | 55.4 | +43.1 | |
Conservative | Sundeep Singh | 982 | 31.4 | -21.3 | |
Labour | Sian Roscoe | 412 | 12.3 | -7.5 | |
Majority | 750 | 24.0 | |||
Turnout | 3,126 | 33.5 | |||
Liberal Democrats gain from Conservative | Swing | 32.2 | |||
Party | Candidate | Votes | % | ±% | |
---|---|---|---|---|---|
Independent | John Broad | 1,092 | 52.3 | -10.9 | |
Conservative | Sam Holland | 615 | 29.4 | +10.0 | |
Labour | Steven Uttley | 382 | 18.3 | +5.3 | |
Majority | 477 | 22.9 | |||
Turnout | 2,089 | 31.9 | |||
Independent hold | Swing | 10.5 | |||
Party | Candidate | Votes | % | ±% | |
---|---|---|---|---|---|
Conservative | Phil Chapman | 1,396 | 49.8 | -15.5 | |
Liberal Democrats | Xenia Huntley | 707 | 25.2 | N/A | |
Labour Co-op | Anne Cullen | 701 | 25.0 | +4.9 | |
Majority | 689 | 24.6 | |||
Turnout | 2,804 | 40.8 | |||
Conservative hold | Swing | N/A | |||
Party | Candidate | Votes | % | ±% | |
---|---|---|---|---|---|
Conservative | Eddie Reeves | 1,416 | 45.9 | -11.7 | |
Labour | Annette Murphy | 690 | 22.4 | +1.3 | |
Liberal Democrats | James Hartley | 640 | 20.7 | -0.6 | |
Green | Aaron Bliss | 339 | 11.0 | N/A | |
Majority | 726 | 23.5 | |||
Turnout | 3,085 | 41.7 | |||
Conservative hold | Swing | 6.5 | |||
Party | Candidate | Votes | % | ±% | |
---|---|---|---|---|---|
Conservative | Barry Wood | 1,066 | 42.5 | -17.6 | |
Liberal Democrats | Dillie Keane | 508 | 20.3 | N/A | |
Labour | Sylvia Howells | 474 | 18.9 | +3.3 | |
Green | Jenny Tamblyn | 460 | 18.3 | -6.0 | |
Majority | 558 | 22.2 | |||
Turnout | 2,508 | 35.6 | |||
Conservative hold | Swing | N/A | |||
Party | Candidate | Votes | % | ±% | |
---|---|---|---|---|---|
Green | Fiona Mawson | 1,322 | 46.8 | +12.3 | |
Conservative | Nigel Simpson | 1,070 | 37.9 | -12.6 | |
Labour | Sarah Stephenson-Hunter | 432 | 15.3 | +0.4 | |
Majority | 252 | 8.9 | |||
Turnout | 2,824 | 40.2 | |||
Green gain from Conservative | Swing | 12.5 | |||
Party | Candidate | Votes | % | ±% | |
---|---|---|---|---|---|
Liberal Democrats | Jean Conway | 1,465 | 52.4 | +2.2 | |
Conservative | Helen Kingsley | 1,005 | 36.0 | -2.5 | |
Labour | Chidi Uche | 325 | 11.6 | +0.3 | |
Majority | 460 | 16.4 | |||
Turnout | 2,795 | 40.3 | |||
Liberal Democrats hold | Swing | 2.4 | |||
Party | Candidate | Votes | % | ±% | |
---|---|---|---|---|---|
Liberal Democrats | Gemma Coton | 1,477 | 55.3 | +19.4 | |
Liberal Democrats | Angus Patrick | 1,322 | 49.5 | +13.6 | |
Conservative | David Hughes | 1,091 | 40.8 | -9.0 | |
Conservative | Steve Jackson | 958 | 35.9 | -13.9 | |
Labour | Joanne Howells | 267 | 10.0 | -4.3 | |
Labour | Naomi Karslake | 229 | 8.6 | -5.7 | |
Turnout | 43.7 | ||||
Liberal Democrats gain from Conservative | Swing | ||||
Hannah Banfield, elected in 2019 as a Labour councillor for Banbury Cross and Neithrop ward, resigned from the party in November 2022, sitting instead as an independent. [2]
Cherwell is a local government district in northern Oxfordshire, England. The district was created in 1974 and takes its name from the River Cherwell, which drains south through the region to flow into the River Thames at Oxford. Towns in Cherwell include Banbury and Bicester. Kidlington is a contender for largest village in England.
Mansfield District is a local government district in Nottinghamshire, England. Its council is based in the town of Mansfield. The district is bounded by the districts of Ashfield, Newark and Sherwood and Gedling, as well as the Derbyshire districts of Bolsover and North East Derbyshire. It is also part of the Mansfield urban area.
One third of Cherwell District Council in Oxfordshire, England is elected each year, followed by one year without election. Since the last comprehensive boundary changes in 2016, 48 councillors have been elected from 16 wards.
Neath Port Talbot County Borough Council is the local authority for the county borough of Neath Port Talbot, one of the 22 principal areas of Wales. The council was controlled by the Labour Party from its creation in 1996 until 2022, when Plaid Cymru and a group of independent councillors agreed to share power.
The 1998 Cherwell District Council election took place on 7 May 1998 to elect members of Cherwell District Council in Oxfordshire, England. One third of the council was up for election and the council stayed under no overall control.
The 1999 Cherwell District Council election took place on 6 May 1999 to elect members of Cherwell District Council in Oxfordshire, England. One third of the council was up for election and the council stayed under no overall control.
The 2000 Cherwell District Council election took place on 4 May 2000 to elect members of Cherwell District Council in Oxfordshire, England. One third of the council was up for election and the Conservative Party gained overall control of the council from no overall control.
The 2002 Cherwell District Council election took place on 2 May 2002 to elect members of Cherwell District Council in Oxfordshire, England. The whole council was up for election with boundary changes since the last election in 2000 reducing the number of seats by 2. The Conservative Party stayed in overall control of the council.
The 2003 Cherwell District Council election took place on 1 May 2003 to elect members of Cherwell District Council in Oxfordshire, England. One third of the council was up for election and the Conservative Party stayed in overall control of the council.
The 2006 Cherwell District Council election took place on 4 May 2006 to elect members of Cherwell District Council in Oxfordshire, England. One third of the council was up for election and the Conservative Party stayed in overall control of the council.
The 2007 Cherwell District Council election took place on 3 May 2007 to elect members of Cherwell District Council in Oxfordshire, England. One third of the council was up for election and the Conservative Party stayed in overall control of the council.
The 2008 Cherwell District Council election took place on 1 May 2008 to elect members of Cherwell District Council in Oxfordshire, England. One third of the council was up for election and the Conservative Party stayed in overall control of the council.
The 2011 Cherwell District Council election took place on 5 May 2011 to elect members of Cherwell District Council in Oxfordshire, England. One third of the council was up for election and the Conservative Party stayed in overall control of the council.
The 2018 Cherwell District Council election was held on 3 May 2018 to elect members of Cherwell District Council in England. This was on the same day as other local elections.
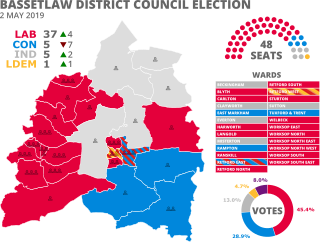
The Workers Party of Britain (WPB) is a minor political party in Britain, formed in December 2019 and led by George Galloway. It has never held elected representation at any level of government.
The 2022 City of Bradford Metropolitan District Council election took place on 5 May 2022 to elect one third of councillors to the City of Bradford Metropolitan District Council. The election took place at the same time as other local elections across the United Kingdom.
The 2022 Kirklees Metropolitan Borough Council election took place on 5 May 2022. One third of councillors—23 out of 69—on Kirklees Metropolitan Borough Council were elected. The election took place alongside other local elections across the United Kingdom.
The 2022 Huntingdonshire District Council election was held on 5 May 2022 to elect members of Huntingdonshire District Council in England. This was on the same day as other local elections.
The 2023 United Kingdom local elections were held on Thursday, 4 May 2023 in England and on Thursday 18 May 2023 in Northern Ireland. These included district councils, unitary authorities, and directly elected mayors in England, and included all local councils in Northern Ireland. Notably, these elections were the first to be held under the Elections Act 2022, a new voter identification law that is controversial, meaning voters were required to show photo ID when attending a polling station.
The 2023 Cherwell District Council election took place on 4 May 2023 to elect members of Cherwell District Council in Oxfordshire, England. This was on the same day as other local elections in England.
Cherwell: Hannah Banfield, who was elected for the Labour Party... has left the party to sit as an Independent