County result maps
 2005 results map
 2009 results map
 2013 results map
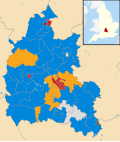 2017 results map
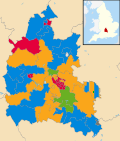 2021 results map
 2025 results map
Oxfordshire County Council is elected every four years.
| Year | Conservative | Liberal Democrats [a] | Labour | Green [b] | Reform | HRG | Independent | Council control after election | |
|---|---|---|---|---|---|---|---|---|---|
| 1973 [1] | 37 | 3 | 21 | – | – | – | 9 | Conservative | |
| 1977 [c] [1] | 61 | 2 | 3 | 3 | Conservative | ||||
| 1981 [1] | 36 | 10 [d] | 19 | 0 | 4 | Conservative | |||
| 1985 [e] [1] | 31 | 18 | 20 | 0 | 1 | No overall control | |||
| 1989 [1] | 33 | 13 | 23 | 0 | 1 | No overall control | |||
| 1993 [1] | 25 | 20 | 24 | 1 | 0 | No overall control | |||
| 1997 [1] | 27 | 19 | 22 | 2 | 0 | No overall control | |||
| 2001 [1] | 25 | 19 | 24 | 2 | 0 | No overall control | |||
| 2005 [f] [1] | 43 | 17 | 9 | 5 | 0 | 0 | Conservative | ||
| 2009 [1] | 52 | 10 | 9 | 2 | – | 1 | Conservative | ||
| 2013 [g] [5] | 31 | 11 | 15 | 2 | 0 | 4 | No overall control | ||
| 2017 [6] | 31 | 13 | 14 | 0 | 1 | 4 | No overall control | ||
| 2021 [7] | 21 | 21 | 16 | 3 | 1 | 1 | No overall control | ||
| 2025 [h] | 10 | 36 | 12 | 7 | 1 | 1 | 2 [i] | Liberal Democrats | |


| Party | Candidate | Votes | % | ±% | |
|---|---|---|---|---|---|
| Liberal Democrats | 1,085 | 47.4 | +4.9 | ||
| Conservative | 582 | 25.4 | +0.4 | ||
| Labour | 352 | 15.4 | −5.7 | ||
| Green | 270 | 11.8 | +0.4 | ||
| Majority | 503 | 22.0 | |||
| Turnout | 2,289 | ||||
| Liberal Democrats hold | Swing | ||||
| Party | Candidate | Votes | % | ±% | |
|---|---|---|---|---|---|
| Liberal Democrats | 537 | 42.5 | −9.0 | ||
| Labour | 520 | 41.1 | +5.8 | ||
| Conservative | 124 | 9.8 | +1.3 | ||
| Green | 83 | 6.6 | +1.9 | ||
| Majority | 17 | 1.4 | |||
| Turnout | 1,264 | 22.8 | |||
| Liberal Democrats gain from Labour | Swing | ||||
| Party | Candidate | Votes | % | ±% | |
|---|---|---|---|---|---|
| Labour | 630 | 40.0 | −0.7 | ||
| Liberal Democrats | 597 | 37.9 | +8.1 | ||
| Green | 198 | 12.6 | −7.6 | ||
| Conservative | 127 | 8.1 | −1.2 | ||
| Independent | 22 | 1.4 | +1.4 | ||
| Majority | 33 | 2.1 | |||
| Turnout | 1,574 | 26.0 | |||
| Labour hold | Swing | ||||
| Party | Candidate | Votes | % | ±% | |
|---|---|---|---|---|---|
| Conservative | 348 | 48.0 | +27.0 | ||
| Labour | 314 | 43.9 | −20.1 | ||
| Liberal Democrats | 58 | 8.1 | −6.9 | ||
| Majority | 29 | 4.1 | |||
| Turnout | 715 | 12.8 | |||
| Conservative gain from Labour | Swing | ||||
| Party | Candidate | Votes | % | ±% | |
|---|---|---|---|---|---|
| Liberal Democrats | 731 | 47.0 | +19.8 | ||
| Conservative | 651 | 41.9 | −10.3 | ||
| Labour | 172 | 11.1 | −4.1 | ||
| Majority | 80 | 5.1 | |||
| Turnout | 1,554 | 26.0 | |||
| Liberal Democrats gain from Conservative | Swing | ||||
| Party | Candidate | Votes | % | ±% | |
|---|---|---|---|---|---|
| Liberal Democrats | 1,063 | 40.4 | +9.7 | ||
| Green | 769 | 29.2 | −5.2 | ||
| Conservative | 530 | 20.1 | +0.0 | ||
| Labour | 271 | 10.3 | −3.7 | ||
| Majority | 294 | 11.2 | |||
| Turnout | 2,633 | 47.4 | |||
| Liberal Democrats gain from Green | Swing | ||||
| Party | Candidate | Votes | % | ±% | |
|---|---|---|---|---|---|
| Conservative | 1,172 | 59.6 | +7.8 | ||
| Liberal Democrats | 588 | 30.0 | −7.0 | ||
| Labour | 205 | 10.4 | +10.4 | ||
| Majority | 584 | 29.6 | |||
| Turnout | 1,965 | 25.2 | |||
| Conservative hold | Swing | ||||
| Party | Candidate | Votes | % | ±% | |
|---|---|---|---|---|---|
| Liberal Democrats | 732 | 39.6 | +8.9 | ||
| Green | 693 | 37.5 | +3.1 | ||
| Conservative | 327 | 17.7 | −3.1 | ||
| Labour | 95 | 5.1 | −8.9 | ||
| Majority | 39 | 2.1 | |||
| Turnout | 1,847 | 31.9 | |||
| Liberal Democrats hold | Swing | ||||
| Party | Candidate | Votes | % | ±% | |
|---|---|---|---|---|---|
| Conservative | 1,070 | ||||
| Labour | 152 | ||||
| Green | 87 | ||||
| Majority | |||||
| Turnout | 29.0 | ||||
| Conservative hold | Swing | ||||
| Party | Candidate | Votes | % | ±% | |
|---|---|---|---|---|---|
| Conservative | 920 | 54.9 | −5.1 | ||
| Resident | 405 | 24.2 | +24.2 | ||
| Liberal Democrats | 118 | 7.0 | −19.7 | ||
| Independent | 103 | 6.1 | +6.1 | ||
| Green | 66 | 3.9 | −3.5 | ||
| Labour | 63 | 3.8 | −2.1 | ||
| Majority | 515 | 30.7 | |||
| Turnout | 1,675 | 26.0 | |||
| Conservative hold | Swing | ||||
| Party | Candidate | Votes | % | ±% | |
|---|---|---|---|---|---|
| Liberal Democrats | Colin James | 1,657 | 52.9 | +19.0 | |
| Conservative | Ian Hudspeth | 1,476 | 47.1 | +1.1 | |
| Majority | 181 | 5.8 | |||
| Turnout | 3,133 | 53.2 | |||
| Liberal Democrats gain from Conservative | Swing | ||||
| Party | Candidate | Votes | % | ±% | |
|---|---|---|---|---|---|
| Conservative | Carole Bonner | 880 | 51.5 | +14.4 | |
| Labour | Royston Mold | 488 | 28.6 | −6.3 | |
| Liberal Democrats | Choudry Anjum | 340 | 19.9 | −2.2 | |
| Majority | 392 | 22.9 | |||
| Turnout | 1,708 | 24.6 | |||
| Conservative hold | Swing | ||||
| Party | Candidate | Votes | % | ±% | |
|---|---|---|---|---|---|
| Conservative | Charles Mathew | 1,652 | 53.0 | +17.9 | |
| Liberal Democrats | Stuart Brooks | 1,034 | 33.2 | −11.1 | |
| Green | Xanthe Bevis | 254 | 8.2 | +1.2 | |
| Labour | Richard Kelsall | 176 | 5.6 | −8.0 | |
| Majority | 618 | 19.8 | |||
| Turnout | 3,116 | 43.9 | |||
| Conservative gain from Liberal Democrats | Swing | ||||
| Party | Candidate | Votes | % | ±% | |
|---|---|---|---|---|---|
| Conservative | Peter Handley | 934 | 67.5 | +15.8 | |
| Liberal Democrats | Peter Madden | 348 | 25.1 | −2.1 | |
| Labour | David Wesson | 102 | 7.4 | −10.6 | |
| Majority | 586 | 42.4 | |||
| Turnout | 1,384 | ||||
| Conservative hold | Swing | ||||
| Party | Candidate | Votes | % | ±% | |
|---|---|---|---|---|---|
| Liberal Democrats | Jenny Hannaby | 1,901 | 46.7 | +11.1 | |
| Conservative | Bill Melotti | 1,786 | 43.9 | +11.0 | |
| Labour | Jean Nunn-Price | 382 | 9.4 | −14.3 | |
| Majority | 115 | 2.8 | |||
| Turnout | 4,069 | ||||
| Liberal Democrats hold | Swing | ||||
| Party | Candidate | Votes | % | ±% | |
|---|---|---|---|---|---|
| Independent | Lynda Atkins | 867 | 65.6 | +65.6 | |
| Conservative | Patricia Dawe | 386 | 29.2 | −4.6 | |
| Labour | Charles Gill | 69 | 5.2 | −8.2 | |
| Majority | 481 | 36.4 | |||
| Turnout | 1,322 | 19.7 | |||
| Independent gain from Liberal Democrats | Swing | ||||
| Party | Candidate | Votes | % | ±% | |
|---|---|---|---|---|---|
| Conservative | Michael Gibbard | 2,921 | 52.2 | +13.7 | |
| Liberal Democrats | Suzanne Wilson-Higgins | 1,681 | 30.0 | −1.4 | |
| Labour | Chris Robins | 675 | 12.1 | −11.0 | |
| Green | Janet Warren | 321 | 5.7 | −1.3 | |
| Majority | 1,240 | 22.2 | |||
| Turnout | 5,598 | 39.5 | |||
| Conservative hold | Swing | ||||
| Party | Candidate | Votes | % | ±% | |
|---|---|---|---|---|---|
| Conservative | Caroline Newton | 865 | 62.2 | −6.6 | |
| Liberal Democrats | Nicholas Hancock | 259 | 18.6 | +3.6 | |
| Labour | James Merritt | 157 | 11.3 | +6.7 | |
| UKIP | Jonathan Kent | 110 | 7.9 | +7.9 | |
| Majority | 606 | 43.6 | |||
| Turnout | 1,391 | ||||
| Conservative hold | Swing | ||||
| Party | Candidate | Votes | % | ±% | |
|---|---|---|---|---|---|
| Labour | Gill Sanders | 1,606 | 64.6 | +24.4 | |
| Conservative | Judith Harley | 384 | 15.4 | −7.3 | |
| Green | Paul Skinner | 330 | 13.3 | −9.0 | |
| Liberal Democrats | Mike Tait | 167 | 6.7 | −8.2 | |
| Majority | 1,222 | 49.1 | |||
| Turnout | 2,487 | ||||
| Labour hold | Swing | ||||
| Party | Candidate | Votes | % | ±% | |
|---|---|---|---|---|---|
| Conservative | Stephen Harrod | 871 | 41.8 | −15.9 | |
| Liberal Democrats | Susan Cooper | 629 | 30.2 | +12.4 | |
| UKIP | Craig Laird | 311 | 14.9 | +14.9 | |
| Labour | Paul Collins | 159 | 7.6 | −5.0 | |
| Green | Colin Tudge | 116 | 5.6 | −6.3 | |
| Majority | 242 | 11.6 | |||
| Turnout | 2,086 | ||||
| Conservative hold | Swing | ||||
| Party | Candidate | Votes | % | ±% | |
|---|---|---|---|---|---|
| Labour | Steve Curran | 879 | 70.4 | −11.1 | |
| UKIP | Dave Slater | 168 | 13.5 | +13.5 | |
| Conservative | Samuel Burgess | 88 | 7.0 | −0.6 | |
| Green | Ann Duncan | 57 | 4.6 | −2.8 | |
| Liberal Democrats | Lesley Mallinder | 30 | 2.4 | −1.1 | |
| TUSC | James Morbin | 27 | 2.2 | +2.2 | |
| Majority | 711 | 56.9 | |||
| Turnout | 1,249 | ||||
| Labour hold | Swing | ||||
| Party | Candidate | Votes | % | ±% | |
|---|---|---|---|---|---|
| Conservative | James Mills | 3,465 | 59.0 | +10.2 | |
| Labour | Calvert McGibbon | 800 | 13.6 | −0.3 | |
| UKIP | Jim Stanley | 678 | 11.5 | −13.4 | |
| Liberal Democrats | Liz Leffman | 472 | 8.0 | +2.5 | |
| Green | Nick Owen | 462 | 7.9 | +1.0 | |
| Majority | 2,665 | 45.3 | |||
| Turnout | 5,877 | ||||
| Conservative hold | Swing | ||||
| Party | Candidate | Votes | % | ±% | |
|---|---|---|---|---|---|
| Labour | Damian Haywood | 1,162 | 48.6 | +1.7 | |
| Green | Arthur Wiliams | 1,087 | 45.4 | +4.7 | |
| Conservative | Paul Sims | 100 | 4.2 | −1.4 | |
| Liberal Democrats | Josie Procter | 43 | 1.8 | −5.0 | |
| Majority | 75 | 3.1 | |||
| Turnout | 2,392 | 33 | |||
| Labour hold | Swing | ||||
| Party | Candidate | Votes | % | ±% | |
|---|---|---|---|---|---|
| Liberal Democrats | Nicola Hanna | 1,925 | 47.9 | +4.5 | |
| Conservative | Benjamin Mabbett | 1,447 | 36.0 | +0.7 | |
| Labour | David Gernon | 459 | 11.4 | −2.0 | |
| Green | Kevin Harris | 185 | 4.6 | −3.3 | |
| Majority | 478 | 11.9 | |||
| Turnout | 4,016 | 27.8 | |||
| Liberal Democrats hold | Swing | ||||
| Party | Candidate | Votes | % | ±% | |
|---|---|---|---|---|---|
| Liberal Democrats | Timothy Bearder | 1,380 | 61.0 | +15.8 | |
| Conservative | John Walsh | 705 | 31.2 | −11.7 | |
| Labour | Michael Nixon | 178 | 7.9 | −4.0 | |
| Majority | 675 | 29.8 | |||
| Turnout | 2,263 | 31.0 | |||
| Liberal Democrats hold | Swing | ||||
| Party | Candidate | Votes | % | ±% | |
|---|---|---|---|---|---|
| Green | Pete Sudbury | 998 | 40.9 | +29.9 | |
| Conservative | Adrian Lloyd | 755 | 31.0 | +6.9 | |
| Independent | Elaine Hornsby | 483 | 19.8 | +19.8 | |
| Labour | George Kneeshaw | 202 | 8.3 | −4.2 | |
| Majority | 243 | 10.0 | |||
| Turnout | 2,438 | 30 | |||
| Green gain from Independent | Swing | ||||
| Party | Candidate | Votes | % | ±% | |
|---|---|---|---|---|---|
| Labour | Trish Elphinstone | 1,169 | 43.9 | −8.4 | |
| Independent | Michael Evans | 1,046 | 39.3 | +39.3 | |
| Conservative | Timothy Patmore | 227 | 8.5 | −9.1 | |
| Green | David Thomas | 120 | 4.5 | −8.6 | |
| Liberal Democrats | Theo Jupp | 75 | 2.8 | −2.6 | |
| TUSC | Callum Joyce | 23 | 0.9 | +0.9 | |
| Majority | 123 | 4.6 | |||
| Turnout | 2,268 | 34 | |||
| Labour hold | Swing | ||||
| Party | Candidate | Votes | % | ±% | |
|---|---|---|---|---|---|
| Liberal Democrats | Peter Stevens | 702 | 36.6 | −12.1 | |
| Conservative | James Plumb | 656 | 34.2 | −5.7 | |
| Green | Aidan Reilly | 375 | 19.6 | +19.6 | |
| Labour | Jim Broadbent | 183 | 9.6 | −1.7 | |
| Majority | 46 | 2.4 | |||
| Turnout | 1,916 | 34 | |||
| Liberal Democrats hold | Swing | ||||
| Current | |
|---|---|
| Former | |
aUnitary authorities referred to as county councils | |