Council elections
| Year | Conservative | Labour | Reform | Liberal Democrats [a] | UKIP | Green [b] | Stafford Ind. | Staffordshire Independent Group | Residents' and Ratepayers' Associations | Independent | Council control after election | |
|---|---|---|---|---|---|---|---|---|---|---|---|---|
| 1973 [2] | 28 | 47 | – | 1 | – | – | – | – | 0 | 9 | Labour | |
| 1977 [2] | 64 | 16 | 0 | 0 | 5 | Conservative | ||||||
| 1981 [c] [2] | 28 | 48 | 4 | 0 | 0 | 2 | Labour | |||||
| 1985 [2] | 30 | 48 | 4 | – | – | 0 | Labour | |||||
| 1989 [2] | 28 | 50 | 2 | 0 | 2 | 0 | Labour | |||||
| 1993 [4] | 22 | 53 | 4 | 0 | 2 | 1 | Labour | |||||
| 1997 [d] [6] | 20 | 40 | 2 | 0 | – | 0 | 0 | Labour | ||||
| 2001 [7] | 24 | 36 | 2 | – | – | 0 | Labour | |||||
| 2005 [e] [9] | 28 | 32 | 2 | 0 | 0 | 0 | 0 | Labour | ||||
| 2009 [10] | 49 | 3 | 4 | 4 | 0 | 1 | – | 1 | Conservative | |||
| 2013 [f] [12] | 34 | 24 | 0 | 2 | 0 | – | 2 | Conservative | ||||
| 2017 [13] | 51 | 10 | 0 | 0 | 0 | 1 | Conservative | |||||
| 2021 [14] | 57 | 4 | 0 | 0 | 0 | 0 | 1 | Conservative | ||||
| 2025 [g] [15] | 10 | 1 | 49 | 0 | 0 | 1 | 1 | 0 | Reform UK | |||
Results maps
 2005 results map
 2009 results map
 2013 results map
 2017 results map
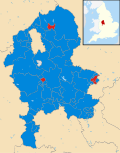 2021 results map
 2025 results map


