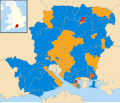
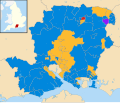
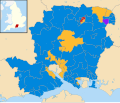
Hampshire County Council in England is elected every four years. Since the boundary changes in 2005, 78 councillors have been elected from 75 wards, with further boundary changes in 2017. [1] [2]
| Year | Conservative | Liberal Democrats [a] | Labour | UKIP | Independents & Others | Council control after election | ||
|---|---|---|---|---|---|---|---|---|
| Local government reorganisation; council established (97 seats) | ||||||||
| 1973 | 54 | 6 | 27 | – | 10 | Conservative | ||
| 1973 | 88 | 0 | 7 | – | 2 | Conservative | ||
| New division boundaries (102 seats) | ||||||||
| 1981 | 62 | 7 | 31 | – | 2 | Conservative | ||
| 1985 | 50 | 31 | 19 | – | 2 | No overall control | ||
| 1989 | 57 | 25 | 19 | – | 1 | Conservative | ||
| 1993 | 29 | 48 | 24 | – | 1 | No overall control | ||
| Portsmouth and Southampton become unitary authorities (74 seats) | ||||||||
| 1997 | 43 | 21 | 8 | 0 | 2 | Conservative | ||
| 2001 | 46 | 19 | 9 | 0 | 0 | Conservative | ||
| New division boundaries (78 seats) | ||||||||
| 2005 | 47 | 26 | 4 | 0 | 1 | Conservative | ||
| 2009 | 51 | 25 | 1 | 0 | 1 | Conservative | ||
| 2013 | 45 | 17 | 4 | 10 | 2 [b] | Conservative | ||
| 2017 | 56 | 19 | 2 | 0 | 1 [c] | No overall control | ||
| 2021 | 56 | 17 | 3 | 0 | 2 [d] | Conservative | ||


| Party | Candidate | Votes | % | ±% | |
|---|---|---|---|---|---|
| Liberal Democrats | 1,674 | 48.7 | +6.0 | ||
| Conservative | 1,628 | 47.3 | +1.8 | ||
| Labour | 138 | 4.0 | −7.8 | ||
| Majority | 46 | 1.4 | |||
| Turnout | 3,440 | 22.0 | |||
| Liberal Democrats gain from Conservative | Swing | ||||
| Party | Candidate | Votes | % | ±% | |
|---|---|---|---|---|---|
| Conservative | 742 | 43.2 | +5.9 | ||
| Labour | 564 | 32.8 | −2.4 | ||
| Liberal Democrats | 347 | 20.2 | −5.2 | ||
| Independent | 64 | 3.7 | +3.7 | ||
| Majority | 178 | 10.4 | |||
| Turnout | 1,717 | 16.5 | |||
| Conservative hold | Swing | ||||
| Party | Candidate | Votes | % | ±% | |
|---|---|---|---|---|---|
| Conservative | 741 | 47.3 | +10.9 | ||
| Liberal Democrats | 554 | 35.4 | +5.5 | ||
| Labour | 270 | 17.3 | −12.8 | ||
| Majority | 187 | 11.9 | |||
| Turnout | 1,565 | 10.6 | |||
| Conservative hold | Swing | ||||
| Party | Candidate | Votes | % | ±% | |
|---|---|---|---|---|---|
| Labour | 1,107 | 51.1 | −3.4 | ||
| Conservative | 617 | 28.5 | +2.6 | ||
| Liberal Democrats | 443 | 20.4 | +1.8 | ||
| Majority | 490 | 22.6 | |||
| Turnout | 2,167 | 20.2 | |||
| Conservative hold | Swing | ||||
| Party | Candidate | Votes | % | ±% | |
|---|---|---|---|---|---|
| Conservative | John Stocks | 1,044 | 63.9 | +28.2 | |
| Liberal Democrats | Helen Alley | 373 | 22.8 | +8.0 | |
| Labour | Peter Cotton | 217 | 13.3 | +6.5 | |
| Majority | 671 | 41.1 | |||
| Turnout | 1,634 | 13.8 | |||
| Conservative gain from Independent | Swing | ||||
| Party | Candidate | Votes | % | ±% | |
|---|---|---|---|---|---|
| Labour | 1,606 | 68.3 | +11.9 | ||
| Conservative | 639 | 27.2 | −6.2 | ||
| Liberal Democrats | 107 | 4.5 | −5.7 | ||
| Majority | 967 | 41.1 | |||
| Turnout | 2,352 | 21.7 | |||
| Labour hold | Swing | ||||
| Party | Candidate | Votes | % | ±% | |
|---|---|---|---|---|---|
| Liberal Democrats | John Shaw | 1,223 | 38.6 | +11.8 | |
| Conservative | Harry Robinson | 1,126 | 35.5 | +4.2 | |
| Labour | Julie Johnson | 824 | 26.0 | −15.9 | |
| Majority | 98 | 3.1 | |||
| Turnout | 3,174 | 28.5 | |||
| Liberal Democrats gain from Labour | Swing | ||||
| Party | Candidate | Votes | % | ±% | |
|---|---|---|---|---|---|
| Liberal Democrats | Lee Dunsdon | 1,796 | 66.9 | +21.0 | |
| Conservative | Alexis McEvoy | 801 | 29.8 | −7.7 | |
| Labour | Alan Goodfellow | 87 | 3.2 | −13.5 | |
| Majority | 995 | 37.1 | |||
| Turnout | 2,684 | 25.0 | |||
| Liberal Democrats hold | Swing | ||||
| Party | Candidate | Votes | % | ±% | |
|---|---|---|---|---|---|
| Liberal Democrats | Ann Buckley | 978 | 56.6 | +36.2 | |
| Labour | 433 | 25.0 | −31.0 | ||
| Conservative | 285 | 16.5 | −7.0 | ||
| Green | 33 | 1.9 | +1.9 | ||
| Majority | 545 | 31.6 | |||
| Turnout | 1,729 | 17.2 | |||
| Liberal Democrats gain from Labour | Swing | ||||
| Party | Candidate | Votes | % | ±% | |
|---|---|---|---|---|---|
| Conservative | David Drew | 1,183 | 42.7 | −6.4 | |
| Liberal Democrats | Maureen Comber | 1,111 | 40.1 | +17.7 | |
| Labour | John Newland | 245 | 8.8 | +1.7 | |
| UKIP | Anthony McCabe | 233 | 8.4 | −13.0 | |
| Majority | 72 | 2.6 | |||
| Turnout | 2,772 | ||||
| Conservative hold | Swing | ||||
| Party | Candidate | Votes | % | ±% | |
|---|---|---|---|---|---|
| Conservative | Graham Burgess | 3,080 | 59.6 | −6.3 | |
| Liberal Democrats | Angela Whitbread | 1,227 | 23.8 | −2.0 | |
| Labour | Graham Giles | 858 | 16.6 | +8.3 | |
| Majority | 1,853 | 35.9 | |||
| Turnout | 5,165 | ||||
| Conservative hold | Swing | ||||
| Party | Candidate | Votes | % | ±% | |
|---|---|---|---|---|---|
| Conservative | Ferris Cowper | 1,588 | 64.6 | +0.9 | |
| Liberal Democrats | Maureen Comber | 290 | 11.8 | −19.3 | |
| Labour | John Tough | 258 | 10.5 | +5.3 | |
| Green | Neville Taylor | 178 | 7.2 | +7.2 | |
| JAC | Don Jerrard | 146 | 5.9 | +5.9 | |
| Majority | 1,298 | 52.8 | |||
| Turnout | 2,460 | ||||
| Conservative hold | Swing | ||||
| Party | Candidate | Votes | % | ±% | |
|---|---|---|---|---|---|
| Conservative | Patricia Stallard | 1,661 | 53.8 | −3.9 | |
| Liberal Democrats | Vivian Achwal | 1,038 | 33.6 | +6.5 | |
| UKIP | Stephen Harris | 133 | 4.3 | −7.9 | |
| Green | John Vivian | 130 | 4.2 | +4.2 | |
| Labour | David Picton-Jones | 124 | 4.0 | +0.9 | |
| Majority | 623 | 20.2 | |||
| Turnout | 3,086 | ||||
| Conservative hold | Swing | ||||
| Party | Candidate | Votes | % | ±% | |
|---|---|---|---|---|---|
| Conservative | Ken Moon | 1,156 | 37.3 | −1.4 | |
| UKIP | David Alexander | 720 | 23.2 | +0.7 | |
| Liberal Democrats | Richard Robinson | 685 | 22.1 | +1.1 | |
| Labour | Bill Organ | 322 | 10.4 | +1.2 | |
| Green | Adam Harper | 220 | 7.1 | −1.5 | |
| Majority | 436 | 14.1 | |||
| Turnout | 3,103 | ||||
| Conservative hold | Swing | ||||
| Party | Candidate | Votes | % | ±% | |
|---|---|---|---|---|---|
| Conservative | Zilliah Brooks | 5,208 | 57.5 | +11.9 | |
| UKIP | Christine Forrester | 1,846 | 20.4 | −18.0 | |
| Labour | Michael Mumford | 1,304 | 14.4 | +5.0 | |
| Green | Dean Marriner | 698 | 7.7 | +7.7 | |
| Majority | 3,362 | 37.1 | |||
| Turnout | 9,056 | ||||
| Conservative hold | Swing | ||||
| Party | Candidate | Votes | % | ±% | |
|---|---|---|---|---|---|
| Conservative | Judith Grajewski | 2,074 | 49.3 | +10.2 | |
| Liberal Democrats | James Duguid | 1,493 | 35.5 | +3.8 | |
| UKIP | John Edwards | 358 | 8.5 | −13.3 | |
| Labour | Sarah Smith | 285 | 6.8 | +2.0 | |
| Majority | 581 | 13.8 | |||
| Turnout | 4,210 | ||||
| Conservative hold | Swing | ||||
| Party | Candidate | Votes | % | ±% | |
|---|---|---|---|---|---|
| Conservative | Christopher Matthews | 4,408 | 41.9 | +9.4 | |
| UKIP | Paul Sturgess | 2,164 | 20.6 | −8.6 | |
| Liberal Democrats | Peter Trott | 1,905 | 18.1 | −5.4 | |
| Labour | James Carr | 1,360 | 12.9 | +3.6 | |
| Green | David Harrison | 673 | 6.4 | +0.9 | |
| Majority | 2,244 | 21.4 | |||
| Turnout | 10,510 | ||||
| Conservative hold | Swing | ||||
| Party | Candidate | Votes | % | ±% | |
|---|---|---|---|---|---|
| Conservative | Floss Mitchell | 2,201 | 51.0 | −6.0 | |
| Liberal Democrats | Trevor Maroney | 1,321 | 30.6 | +20.6 | |
| UKIP | Peter Baillie | 791 | 18.3 | −5.7 | |
| Majority | 880 | 20.4 | |||
| Turnout | 4,313 | ||||
| Conservative hold | Swing | ||||
| Party | Candidate | Votes | % | ±% | |
|---|---|---|---|---|---|
| Green | Malcolm Wallace | 2,083 | 35.8 | ||
| Liberal Democrats | Vivian Achwal | 1,906 | 32.7 | ||
| Conservative | Neil Bolton | 1,630 | 28.0 | ||
| Labour | Oliver Hirsch | 199 | 3.4 | ||
| Majority | 177 | 3.0 | |||
| Turnout | 5,818 | 39.38 | |||
| Green gain from Conservative | Swing | ||||
| Party | Candidate | Votes | % | ±% | |
|---|---|---|---|---|---|
| Conservative | Ryan Brent | 1,484 | 47.1 | −18.6 | |
| Liberal Democrats | Adrian Tansom | 866 | 27.5 | +17.8 | |
| Labour | Munazza Faiz | 802 | 25.4 | +9.3 | |
| Majority | 618 | 19.6 | |||
| Turnout | 3,152 | ||||
| Conservative hold | Swing | ||||
| Party | Candidate | Votes | % | ±% | |
|---|---|---|---|---|---|
| Conservative | Joanne Burton | 2,096 | 46.7 | −10.7 | |
| Liberal Democrats | Graham Everdell | 1,542 | 34.4 | +21.5 | |
| Labour | Verden Meldrum | 592 | 13.2 | +0.8 | |
| Independent | Nick Gregory | 256 | 5.7 | +5.7 | |
| Majority | 554 | 12.3 | |||
| Turnout | 4,486 | ||||
| Conservative hold | Swing | ||||
| Party | Candidate | Votes | % | ±% | |
|---|---|---|---|---|---|
| Green | Malcolm Wallace | 2,083 | 35.8 | +12.6 | |
| Liberal Democrats | Vivian Achwal | 1,906 | 32.8 | +12.5 | |
| Conservative | Neil Bolton | 1,630 | 28.0 | −23.8 | |
| Labour | Oliver Hirsch | 199 | 3.4 | −1.3 | |
| Majority | 177 | 3.0 | |||
| Turnout | 5,818 | ||||
| Green gain from Conservative | Swing | ||||
| Party | Candidate | Votes | % | ±% | |
|---|---|---|---|---|---|
| Liberal Democrats | Jonathan Williams | 2,210 | 52.2 | +28.6 | |
| Conservative | Neil Bolton | 1,431 | 33.8 | −23.1 | |
| Green | Alex Ellis | 477 | 11.3 | −1.9 | |
| Labour | Steve Haines | 115 | 2.7 | −3.6 | |
| Majority | 779 | 18.4 | |||
| Turnout | 4,233 | ||||
| Liberal Democrats gain from Conservative | Swing | ||||
| Party | Candidate | Votes | % | ±% | |
|---|---|---|---|---|---|
| Liberal Democrats | Paula Ferguson | 2,027 | 44.3 | −4.1 | |
| Green | Lorraine Estelle | 1,033 | 22.6 | +13.1 | |
| Conservative | Ian Tait | 786 | 17.2 | −15.1 | |
| Reform UK | Russ Kitching | 577 | 12.6 | +12.6 | |
| Labour | Peter Marsh | 152 | 3.3 | −4.5 | |
| Majority | 994 | 21.7 | |||
| Turnout | 4,575 | ||||
| Liberal Democrats hold | Swing | ||||
| Party | Candidate | Votes | % | ±% | |
|---|---|---|---|---|---|
| Liberal Democrats | Stuart Bailey | 2,410 | 49.0 | −8.3 | |
| Reform UK | Trevor Lloyd-Jones | 1,380 | 28.0 | +28.0 | |
| Conservative | Sue Perkins | 708 | 14.4 | −22.0 | |
| Green | Samantha Davis | 204 | 4.1 | +4.1 | |
| Labour | Robbie Wiltshire | 203 | 4.1 | +4.1 | |
| Libertarian | Alex Zychowski | 16 | 0.3 | +0.3 | |
| Majority | 1,030 | 20.9 | |||
| Turnout | 4,921 | ||||
| Liberal Democrats hold | Swing | ||||
| Current | |
|---|---|
| Former | |
aUnitary authorities referred to as county councils | |