County result maps
 2005 results map
 2009 results map
 2013 results map
 2017 results map
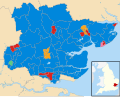
 2021 results map
Essex County Council in England is elected every four years. Since the last boundary changes in 2005, 75 councillors are elected from 70 wards. [1]
| Year | Conservative | Labour | Liberal Democrats [a] | Reform | Green | UKIP | Independent & Others | Council control after election | |
|---|---|---|---|---|---|---|---|---|---|
| Local government reorganisation; council established (97 seats) | |||||||||
| 1973 | 50 | 40 | 5 | – | – | – | 2 [b] | Conservative | |
| 1977 | 83 | 12 | 2 | – | 0 | – | 0 | Conservative | |
| 1981 | 51 | 32 | 13 | – | 0 | – | 2 [c] | Conservative | |
| 1985 | 45 | 29 | 23 | – | 0 | – | 0 | No overall control | |
| 1989 | 55 | 25 | 18 | – | 0 | – | 1 [d] | Conservative | |
| 1993 | 32 | 33 | 32 | – | 0 | – | 1 | No overall control | |
| 1997 | 40 | 23 | 15 | – | 0 | 0 | 1 [e] | Conservative | |
| 2001 | 49 | 19 | 10 | – | 0 | 0 | 1 [f] | Conservative | |
| 2005 | 52 | 13 | 8 | – | 0 | 0 | 2 [g] | Conservative | |
| 2009 | 60 | 1 | 12 | – | 0 | 0 | 2 [h] | Conservative | |
| 2013 | 42 | 9 | 9 | – | 2 | 9 | 4 [i] | Conservative | |
| 2017 | 56 | 6 | 7 | – | 1 | 0 | 5 [j] | Conservative | |
| 2021 | 52 | 5 | 8 | 0 | 1 | 0 | 9 [k] | Conservative | |


Basildon Vange (June 1986) (Labour Hold)
Gray Thurrock (July 1986) (Labour Hold)
| Party | Candidate | Votes | % | ±% | |
|---|---|---|---|---|---|
| Alliance | Albert Smulian | 2,005 | 55.6 | +2.3 | |
| Conservative | Terrence Birdseye | 1,289 | 35.7 | −0.2 | |
| Labour | Nigel Boorman | 314 | 8.7 | −1.1 | |
| Majority | 716 | 19.8 | +2.5 | ||
| Turnout | 3,608 | 33.0 | −12.2 | ||
| Alliance hold | Swing | +1.0 | |||
| Party | Candidate | Votes | % | ±% | |
|---|---|---|---|---|---|
| Alliance | Francis Bellard | 1,423 | 45.9 | +14.1 | |
| Conservative | Terence Dove | 1,288 | 41.5 | −4.1 | |
| Labour | Margaret Davis | 391 | 12.6 | −10.0 | |
| Majority | 135 | 4.6 | |||
| Turnout | 3,102 | 30.0 | −6.0 | ||
| Alliance gain from Conservative | Swing | +9.1 | |||
| Party | Candidate | Votes | % | ±% | |
|---|---|---|---|---|---|
| SLD | Patricia Pascoe | 2,035 | 42.3 | −1.1 | |
| Labour | Donald Quinn | 1,572 | 32.7 | −6.9 | |
| Conservative | Mary Fairhead | 1,200 | 25.0 | +8.0 | |
| Majority | 463 | 9.6 | +5.8 | ||
| Turnout | 4,807 | 39.0 | +2.3 | ||
| SLD hold | Swing | +2.9 | |||
| Party | Candidate | Votes | % | ±% | |
|---|---|---|---|---|---|
| Labour | Christopher Pearson | 2,384 | 40.1 | +4.2 | |
| Liberal Democrats | Vincent Edkins | 2,103 | 35.4 | −0.3 | |
| Conservative | Edward Winney | 1,039 | 17.5 | −1.9 | |
| SDP | John Parrick | 416 | 7.0 | +7.0 | |
| Majority | 281 | 4.7 | +4.5 | ||
| Turnout | 5,942 | 48.1 | +8.6 | ||
| Labour hold | Swing | +2.3 | |||
| Party | Candidate | Votes | % | ±% | |
|---|---|---|---|---|---|
| Liberal Democrats | Edgar Davis | 2,210 | 56.0 | +21.5 | |
| Conservative | John Hutton | 1,339 | 33.9 | −14.6 | |
| Labour | Francis Keohane | 249 | 6.3 | −4.2 | |
| Green | Philip Ray | 89 | 2.3 | −4.6 | |
| SDP | Samuel Ormsby | 32 | 0.8 | +0.8 | |
| Independent | James Holdsworth | 28 | 0.7 | +0.7 | |
| Majority | 871 | 22.1 | −13.8 | ||
| Turnout | 3,947 | 40.1 | −3.3 | ||
| Liberal Democrats gain from Conservative | Swing | +18.1 | |||
| Party | Candidate | Votes | % | ±% | |
|---|---|---|---|---|---|
| Conservative | David Westcott | 2,937 | 56.4 | −5.7 | |
| Liberal Democrats | John Gibbs | 1,451 | 27.9 | +7.7 | |
| Labour | David Cole | 817 | 15.7 | −2.0 | |
| Majority | 1,486 | 28.5 | −13.4 | ||
| Turnout | 5,205 | 45.1 | +7.7 | ||
| Conservative hold | Swing | −6.7 | |||
| Party | Candidate | Votes | % | ±% | |
|---|---|---|---|---|---|
| Conservative | David Walsh | 1,780 | 48.4 | +13.1 | |
| Labour | Harold Bruce | 1,360 | 32.7 | −17.6 | |
| Liberal Democrats | Simon Wilson | 538 | 13.0 | +4.4 | |
| Majority | 420 | 11.4 | |||
| Turnout | 4,155 | 33.2 | −3.2 | ||
| Conservative gain from Labour | Swing | +15.4 | |||
| Party | Candidate | Votes | % | ±% | |
|---|---|---|---|---|---|
| Conservative | Alun Thomas | 1,872 | 57.9 | −4.9 | |
| Liberal Democrats | Katharine Spanton | 1,191 | 36.8 | +18.6 | |
| Labour | Edward O’Brien | 172 | 5.3 | −13.7 | |
| Majority | 681 | 21.1 | −43.6 | ||
| Turnout | 3,235 | 26.8 | −7.2 | ||
| Conservative hold | Swing | −11.8 | |||
| Party | Candidate | Votes | % | ±% | |
|---|---|---|---|---|---|
| Labour | Stanley Goodwin | 1,891 | 55.6 | +10.5 | |
| Conservative | Vernon Davies | 870 | 25.6 | −10.0 | |
| Liberal Democrats | Nicholas Macy | 641 | 18.8 | −0.5 | |
| Majority | 1,021 | 30.0 | |||
| Turnout | 3,402 | 32.5 | |||
| Labour hold | Swing | +10.3 | |||
| Party | Candidate | Votes | % | ±% | |
|---|---|---|---|---|---|
| Labour | Christopher Pearson | 1,260 | 35.6 | +5.7 | |
| Conservative | Roger Lord | 1,197 | 33.9 | −1.5 | |
| Liberal Democrats | Potter | 999 | 28.3 | −5.4 | |
| Green | Fox | 80 | 2.3 | +2.3 | |
| Majority | 63 | 1.8 | |||
| Turnout | 3,536 | ||||
| Labour gain from Conservative | Swing | +4.1 | |||
| Party | Candidate | Votes | % | ±% | |
|---|---|---|---|---|---|
| Labour | Robert Sears | 1,717 | 37.9 | +2.2 | |
| Conservative | David Walsh | 1,573 | 34.8 | −6.0 | |
| Liberal Democrats | Geoffery Williams | 1,231 | 27.2 | +3.7 | |
| Majority | 144 | 3.1 | |||
| Turnout | 4,521 | 35.4 | |||
| Labour gain from Conservative | Swing | ||||
| Party | Candidate | Votes | % | ±% | |
|---|---|---|---|---|---|
| Labour | Stanley Goodwin | 927 | 48.4 | +11.4 | |
| Conservative | Colin Finn | 527 | 27.5 | +2.0 | |
| Loughton Residents | Kay Ellis | 404 | 21.1 | −9.8 | |
| Liberal Democrats | Christopher Spence | 56 | 2.9 | −3.6 | |
| Majority | 400 | 20.9 | |||
| Turnout | 1,914 | 19.4 | |||
| Labour hold | Swing | ||||
| Party | Candidate | Votes | % | ±% | |
|---|---|---|---|---|---|
| Liberal Democrats | Geoffrey Williams | 1,167 | 45.0 | +24.2 | |
| Conservative | Sandra Hillier | 999 | 38.5 | −3.0 | |
| Labour | Jane Dyer | 426 | 16.4 | −21.3 | |
| Majority | 168 | 6.5 | |||
| Turnout | 2,592 | 19.9 | |||
| Liberal Democrats gain from Conservative | Swing | ||||
| Party | Candidate | Votes | % | ±% | |
|---|---|---|---|---|---|
| Labour | Mike Danvers | 1,082 | 43.5 | −9.1 | |
| Conservative | Lee Dangerfield | 715 | 28.7 | +0.8 | |
| UKIP | Anthony Bennett | 264 | 10.5 | +10.5 | |
| Liberal Democrats | Christopher Millington | 213 | 8.6 | −10.9 | |
| Independent | Patricia Bryne | 195 | 7.8 | +7.8 | |
| English Democrat | Robin Tilbrook | 21 | 0.8 | +0.8 | |
| Majority | 367 | 14.8 | |||
| Turnout | 2,487 | 27.3 | |||
| Labour hold | Swing | ||||
| Party | Candidate | Votes | % | ±% | |
|---|---|---|---|---|---|
| Conservative | Ann Naylor | 2,062 | 61.5 | +11.8 | |
| Liberal Democrats | Barry Aspinell | 1,150 | 34.3 | +2.3 | |
| Labour | Jane Winter | 142 | 4.2 | −4.5 | |
| Majority | 912 | 27.2 | |||
| Turnout | 3,354 | 26.0 | |||
| Conservative hold | Swing | ||||
| Party | Candidate | Votes | % | ±% | |
|---|---|---|---|---|---|
| Labour | Tony Durcan | 5,320 | 48.4 | +22.3 | |
| Conservative | Mark Gough | 4,564 | 41.6 | +8.3 | |
| Liberal Democrats | John Strachan | 1,100 | 10.0 | −5.4 | |
| Majority | 756 | 6.9 | |||
| Turnout | 10,984 | 37.2 | |||
| Labour gain from Conservative | Swing | ||||
Percentage changes are since June 2009. At the previous election, the Green Party had received 11.0% and the British National Party received 14.2%.
| Party | Candidate | Votes | % | ±% | |
|---|---|---|---|---|---|
| Conservative | Dick Madden | 1,496 | 43.6 | +10.0 | |
| Liberal Democrats | Graham Pooley | 1,323 | 38.6 | −5.9 | |
| Labour | Russell Kennedy | 610 | 17.8 | +10.1 | |
| Majority | 173 | ||||
| Turnout | 3,429 | 29 | |||
| Conservative gain from Liberal Democrats | Swing | ||||
Percentage changes are since June 2009, when the British National Party and the Green Party also stood, receiving 6.1% and 8.2%, respectively, of votes cast.
| Party | Candidate | Votes | % | ±% | |
|---|---|---|---|---|---|
| Conservative | Ian Grundy | 1,820 | 59.3 | −6.4 | |
| UKIP | Jesse Pryke | 736 | 24.1 | n/a | |
| Labour | Maurice Austin | 273 | 8.9 | +3.7 | |
| Liberal Democrats | Marian Elsden | 160 | 5.2 | −7.3 | |
| Green | Reza Hossain | 80 | 2.6 | −6.1 | |
| Majority | 1,084 | ||||
| Turnout | 3,069 | 22.4 | |||
| Conservative hold | Swing | ||||
Percentage changes are since June 2009. At the previous election, the British National Party received 7.8% of the votes cast
| Party | Candidate | Votes | % | ±% | |
|---|---|---|---|---|---|
| Liberal Democrats | Stephen Robinson | 1,614 | 42.1 | −4.6 | |
| Conservative | Robert Pontin | 941 | 24.5 | −7.5 | |
| Labour | Nastassia Player | 711 | 18.5 | +10.7 | |
| UKIP | Leslie Retford | 435 | 11.3 | n/a | |
| Green | Reza Hossain | 134 | 3.5 | −3.8 | |
| Majority | 6.9 | ||||
| Turnout | 3,835 | 28.3 | |||
| Liberal Democrats hold | Swing | ||||
Percentage changes are since June 2009. At the previous election, British National Party received 6.2%.
| Party | Candidate | Votes | % | ±% | |
|---|---|---|---|---|---|
| Conservative | Alan Goggin | 1,809 | 33.7 | +9.1 | |
| UKIP | Anne Poonian | 1,642 | 30.6 | +0.2 | |
| Liberal Democrats | Gary Scott | 1,199 | 22.3 | −4.6 | |
| Labour | Carol Carlsson-Browne | 524 | 9.8 | −2.7 | |
| Green | Beverley Maltby | 200 | 3.7 | +0.2 | |
| Majority | 167 | 3.1 | −0.4 | ||
| Turnout | 5,398 | 36.5 | +4.3 | ||
| Conservative gain from UKIP | Swing | +4.5 | |||
| Party | Candidate | Votes | % | ±% | |
|---|---|---|---|---|---|
| Conservative | Stephen Canning | 1,071 | 34.3 | +2.1 | |
| Labour | Lynn Watson | 974 | 31.2 | +1.3 | |
| UKIP | Michael Ford | 855 | 27.4 | −5.3 | |
| Green | John Malam | 165 | 5.3 | +2.2 | |
| Independent | Walter Sale | 58 | 1.9 | N/A | |
| Majority | 97 | 3.1 | |||
| Turnout | 3,123 | ||||
| Conservative gain from UKIP | Swing | ||||
| Party | Candidate | Votes | % | ±% | |
|---|---|---|---|---|---|
| Holland Residents | Colin Sargeant | 1,781 | 46.8 | N/A | |
| UKIP | Benjamin Smith | 961 | 25.3 | +0.5 | |
| Conservative | Richard Bleach | 628 | 16.5 | −10.3 | |
| Labour | Christopher Bird | 387 | 10.2 | −0.5 | |
| Liberal Democrats | Rain Welham-Cobb | 49 | 1.3 | −0.4 | |
| Majority | 820 | ||||
| Turnout | |||||
| Holland Residents gain from Tendring First | Swing | ||||
| Party | Candidate | Votes | % | ±% | |
|---|---|---|---|---|---|
| UKIP | Frank Ferguson | 2,034 | 42.6 | +9.2 | |
| Labour | Gavin Callaghan | 1,600 | 33.5 | −7.4 | |
| Conservative | Gary Maylin | 878 | 18.4 | +2.4 | |
| Green | Phillip Rackley | 264 | 5.5 | +3.1 | |
| Majority | 434 | ||||
| Turnout | 16.9 | ||||
| UKIP gain from Labour | Swing | ||||
| Party | Candidate | Votes | % | ±% | |
|---|---|---|---|---|---|
| Independent | Mark Stephenson | 1,231 | 36.9 | +21.8'"`UNIQ−−ref−00000094−QINU`"' | |
| Conservative | Chris Amos | 1,223 | 36.6 | +5.3 | |
| Holland Residents | K.T. King | 537 | 16.1 | −24.8'"`UNIQ−−ref−00000095−QINU`"' | |
| Liberal Democrats | Callum Robertson | 140 | 4.2 | +2.4 | |
| Labour | Geoff Ely | 111 | 3.3 | −6.1 | |
| Green | Chris Southall | 97 | 2.9 | +1.3 | |
| Majority | 8 | 0.2 | −9.4 | ||
| Turnout | 3,339 | 25.3 | −10.5 | ||
| Independent hold | Swing | +8.3 | |||
| Party | Candidate | Votes | % | ±% | |
|---|---|---|---|---|---|
| Liberal Democrats | James Newport | 1,658 | 57.4 | +12.3 | |
| Conservative | Simon Smith | 929 | 32.2 | −11.8 | |
| Independent | Jack Lawmon | 164 | 5.7 | N/A | |
| Labour | Lorraine Ridley | 137 | 4.7 | −6.2 | |
| Majority | 729 | 25.2 | +24.1 | ||
| Turnout | 2,892 | 21.9 | −15.6 | ||
| Registered electors | 13,183 | ||||
| Liberal Democrats hold | Swing | +12.0 | |||
| Party | Candidate | Votes | % | ±% | |
|---|---|---|---|---|---|
| Labour | Patricia Reid | 2,748 | 49.7 | +15.3 | |
| Conservative | Terri Sargent | 1,890 | 34.2 | +1.2 | |
| Green | Oliver McCarthy | 445 | 8.1 | N/A | |
| Liberal Democrats | Mike Chandler | 444 | 8.0 | +3.9 | |
| Majority | 858 | 15.5 | +14.1 | ||
| Turnout | 5,588 | 18.2 | –6.9 | ||
| Registered electors | 30,722 | ||||
| Labour hold | Swing | +7.1 | |||
| Party | Candidate | Votes | % | ±% | |
|---|---|---|---|---|---|
| Conservative | Andrew Johnson | 2,008 | 48.6 | –13.1 | |
| Labour | Kay Morrison | 1,476 | 35.7 | +2.8 | |
| UKIP | Dan Long | 259 | 6.3 | N/A | |
| Green | Jennifer Steadman | 257 | 6.2 | N/A | |
| Liberal Democrats | Christopher Millington | 130 | 3.2 | –0.9 | |
| Majority | 532 | 12.9 | |||
| Turnout | 4,163 | 28.1 | –5.4 | ||
| Registered electors | 14,841 | ||||
| Conservative hold | Swing | –7.9 | |||
| Party | Candidate | Votes | % | ±% | |
|---|---|---|---|---|---|
| Labour | Emma Callaghan | 5,959 | 43.8 | +2.0 | |
| Conservative | Craig Rimmer | 4,360 | 32.1 | –13.8 | |
| Independent | Iurie Cojocaru | 1,677 | 12.4 | N/A | |
| Liberal Democrats | Phil Jenkins | 1,045 | 7.7 | +1.9 | |
| TUSC | Jack Huggins | 550 | 4.0 | N/A | |
| Majority | 1,599 | 11.8 | N/A | ||
| Turnout | 13,591 | 41.2 | +14.9 | ||
| Registered electors | 32,977 | +161 | |||
| Labour gain from Conservative | Swing | +7.9 | |||
| Party | Candidate | Votes | % | ±% | |
|---|---|---|---|---|---|
| Conservative | Sue Dobson | 1,304 | 46.4 | –23.1 | |
| Reform UK | Thomas Allison | 977 | 34.7 | N/A | |
| Independent | Paul Clark | 160 | 5.7 | N/A | |
| Liberal Democrats | Christine Shaw | 156 | 5.5 | −1.3 | |
| Labour | Stephen Capper | 127 | 4.5 | −5.5 | |
| Green | Edward Massey | 89 | 3.2 | −2.9 | |
| Majority | 327 | 11.6 | |||
| Turnout | 2,813 | ||||
| Conservative hold | Swing | ||||
| Party | Candidate | Votes | % | ±% | |
|---|---|---|---|---|---|
| Liberal Democrats | David Loxton | 2,030 | 47.5 | +4.4 | |
| Conservative | Seena Shah | 956 | 22.3 | –16.9 | |
| Reform UK | Darren Brooke | 869 | 20.3 | N/A | |
| Labour | Penny Richards | 227 | 5.3 | ||
| Green | Ronnie Bartlett | 196 | 4.6 | ||
| Majority | 1,074 | 25.1 | |||
| Turnout | 4,278 | ||||
| Liberal Democrats hold | Swing | ||||
{{cite web}}: CS1 maint: archived copy as title (link)| Current | |
|---|---|
| Former | |
aUnitary authorities referred to as county councils | |