Tendring District Council elections

Last updated

Tendring District Council in Essex, England is elected every four years.

Contents

Council elections

Year Conservative Labour Liberal Democrats UKIP Tendring First Community Representatives HOSRA Foundation Independent
1991 181119---4-7 (2*)
1995 8376---4-4
1999 17239---3-6 (1*)
2003 251113--43-4
2007 2866-1052-3
2011 3392-8-3-5
2015 2341221-3-6
2019*166254-3111
2023 1984-1---16

* New ward boundaries [2]

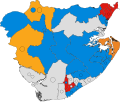
Results maps

By-election results

1995-1999

Haven By-Election 21 November 1996
PartyCandidateVotes%±%
Residents65562.3
Conservative 22121.0
Labour 14213.5
Liberal Democrats 333.1
Majority43441.3
Turnout 1,05139.3
Independent hold Swing
St James By-Election 10 July 1997
PartyCandidateVotes%±%
Conservative 35239.5+7.3
Labour 32136.0−13.4
Liberal Democrats 21924.6+6.2
Majority313.5
Turnout 89217.2
Conservative gain from Labour Swing
Harwich East By-Election 2 October 1997
PartyCandidateVotes%±%
Labour 34050.1−18.0
Conservative 15122.3+22.3
Independent Labour10315.2+15.2
Liberal Democrats 8412.4+12.4
Majority18927.8
Turnout 67827.5
Labour hold Swing

1999-2003

Rush Green By-Election 20 July 2000
PartyCandidateVotes%±%
Labour 47352.3−2.7
Conservative 32435.8+2.4
Liberal Democrats 10811.9+0.4
Majority14916.5
Turnout 90521.0
Labour hold Swing
St Mary's By-Election 19 April 2001
PartyCandidateVotes%±%
Labour 37450.7+4.7
Conservative 17423.6−4.2
Community Representative9512.9+12.9
Liberal Democrats 9412.8−13.4
Majority20027.1
Turnout 73719.0
Labour hold Swing
Brightlingsea East By-Election 2 August 2001
PartyCandidateVotes%±%
Liberal Democrats 18839.4+8.7
Labour 16534.6+1.5
Conservative 12426.0+26.0
Majority234.8
Turnout 47715.0
Liberal Democrats gain from Labour Swing
St. Bartholomew By-Election 29 November 2001
PartyCandidateVotes%±%
Independent 33251.1−25.5
Labour 23836.6+19.2
Conservative 8012.3+12.3
Majority9414.5
Turnout 65022.0
Labour hold Swing
Alresford Thorrington and Frating By-Election 7 March 2002 [3]
PartyCandidateVotes%±%
Liberal Democrats Garry Scott34744.0+44.0
Conservative 28135.7−13.6
Labour 16020.3−30.4
Majority668.3
Turnout 78826.1
Liberal Democrats gain from Labour Swing
Clacton St Johns By-Election 13 June 2002
PartyCandidateVotes%±%
Liberal Democrats 78046.0+4.9
Conservative 51430.3+10.9
Labour 40323.7+0.0
Majority26615.7
Turnout 1,69728.2
Liberal Democrats hold Swing

2003-2007

Pier By-Election 22 July 2004
PartyCandidateVotes%±%
Conservative 20530.5−17.4
Labour 15422.9−16.2
UKIP 10916.2+16.2
Liberal Democrats 10215.2+15.2
Community Candidate10215.2+15.2
Majority517.6
Turnout 67219.4
Conservative hold Swing
Thorrington, Frating, Elmstead & Great Bromley By-Election 20 January 2005 [4]
PartyCandidateVotes%±%
Conservative 57755.1+2.8
Liberal Democrats 34532.9−14.8
Labour 12512.0+12.0
Majority23222.6
Turnout 1,04728.5
Conservative hold Swing

2007-2011

Burrsville By-Election 24 September 2009 [5]
PartyCandidateVotes%±%
Conservative Pam Sambridge45555.2−10.5
Liberal Democrats Joyce O'Brien22727.5+15.7
Labour Max Morris9010.9+1.1
Green Chris Southall526.3+6.3
Majority22827.7
Turnout 82446.0
Conservative hold Swing
Golf Green By-Election 8 April 2010 [6]
PartyCandidateVotes%±%
Labour Dan Casey40928.2−0.8
Conservative John Chittock40427.9+8.6
Tendring First Louise Stanley31321.6−21.8
BNP Keith Beaumont1399.6+9.6
Independent Christopher Judd1208.3+8.3
Liberal Democrats John Candler634.4+4.4
Majority50.3
Turnout 1,44836.6
Labour gain from Tendring First Swing

2015-2019

Rush Green By-Election 16 July 2015
PartyCandidateVotes%±%
UKIP Richard Everett33838.5%Decrease2.svg10.0
Conservative Danny Mayzes29033.1%Increase2.svg13.8
Labour Samantha Atkinson21324.3%Decrease2.svg2.1
Independent William Hones364.1%new
Majority
Turnout 87724.8%
UKIP hold Swing
Great & Little Oakley by-election 9 February 2017
PartyCandidateVotes%±%
UKIP Michael Bush21636.8Decrease2.svg4.1
Conservative Andrew Erskine17129.1Increase2.svg1.4
Labour Robert Shephard11719.9Decrease2.svg5.5
Liberal Democrats Matthew Bensilum8314.1N/A
Majority
Turnout 39.3
UKIP gain from Independent Swing
St James by-election 6 April 2017 [7]
PartyCandidateVotes%±%
Conservative Maurice Alexander37147.9Increase2.svg22.7
UKIP Teresa O'Hara17422.5Decrease2.svg16.3
Labour Wendy Brown11615.0Decrease2.svg1.0
Liberal Democrats Sean Duffy9912.8N/A
Green Rosemary Dodds151.9N/A
Majority19725.4
Turnout 77723
Conservative gain from UKIP Swing
St Pauls by-election 15 February 2018 [8]
PartyCandidateVotes%±%
Conservative Sue Honeywood37839.5Increase2.svg12.0
Independent Stephen Andrews16016.7Increase2.svg16.7
Independent William Hones13414.0Decrease2.svg7.9
Labour Rosie-Roella Kevlin11411.9Decrease2.svg1.2
Liberal Democrats Keith Pitkin798.3Increase2.svg8.3
UKIP Mike Vaughan-Chatfield717.4Decrease2.svg30.1
Green Robert Cockroft202.1Increase2.svg2.1
Majority21822.8
Turnout 956
Conservative gain from UKIP Swing

2019-2023

Eastcliff by-election 6 May 2021 [9]
PartyCandidateVotes%±%
Independent Andy Baker41445.9Increase2.svg45.9
Conservative Mick Skeels29432.6Decrease2.svg11.4
Holland Residents Rick Speller11813.1Decrease2.svg38.0
Labour Simon Wigley444.9Increase2.svg4.9
Independent Danny Mayzes182.0Increase2.svg2.0
Liberal Democrats Mary Pitkin131.4Decrease2.svg3.5
Majority12013.3
Turnout 901
Independent gain from Holland Residents Swing
West Clacton and Jaywick Sands by-election 6 May 2021 [10]
PartyCandidateVotes%±%
Conservative Jayne Nash50041.7Increase2.svg21.7
Independent Brad Thompson39533.0Increase2.svg33.0
Tendring First Andy White14011.7Increase2.svg11.7
Labour James Machin1109.2Increase2.svg1.4
Independent Andy Wood322.7Increase2.svg2.7
Liberal Democrats Stuart Morgan211.8Increase2.svg1.8
Majority1058.8
Turnout 1,198
Conservative gain from UKIP Swing

2023-2027

Bluehouse by-election 11 January 2024 [11]
PartyCandidateVotes%±%
Independent Bernard Goldman18130.4Increase2.svg7.6
Conservative Alex Porter9115.3Decrease2.svg10.6
Labour John Carrington8313.9Decrease2.svg12.1
Reform UK Tony Mack549.1Increase2.svg9.1
Independent Danny Mayzes528.7Decrease2.svg6.4
Independent Gareth Bayford457.6Increase2.svg7.6
UKIP Andrew Pemberton386.4Decrease2.svg5.6
Independent Josie Holland244.0Decrease2.svg7.8
Liberal Democrats Kane Silver223.7Decrease2.svg1.8
Independent John Chittock61.0Increase2.svg1.0
Majority9015.1
Turnout 596
Independent gain from Labour Swing

Related Research Articles

Blackpool Borough Council elections are generally held every four years. Blackpool Borough Council is the local authority for the unitary authority of Blackpool in Lancashire, England. Since the last boundary changes in 2023, 42 councillors have been elected from 21 wards.

Amber Valley Borough Council elections are held every four years to elect councillors to Amber Valley Borough Council, the local authority for the non-metropolitan district of Amber Valley in Derbyshire, England. Since the last boundary changes in 2023, 42 councillors have been elected to represent 18 wards. Prior to 2023 a third of the council was elected three years out of every four.

<span class="mw-page-title-main">Fylde Borough Council elections</span> Local government elections in Lancashire, England

Fylde Borough Council elections are held every four years to elect councillors to Fylde Borough Council in Lancashire, England. Since the last boundary changes in 2023 the council has comprised 37 councillors, representing 17 wards, with each ward electing one, two or three councillors.

<span class="mw-page-title-main">Wyre Borough Council elections</span> Class of election in the United Kingdom

Wyre Borough Council elections are held every four years. Wyre Borough Council is the local authority for the non-metropolitan district of Wyre in Lancashire, England. Since the last boundary changes in 2015, 50 councillors have been elected from 24 wards.

Maldon District Council in Essex, England is elected every four years.

Lichfield District Council elections are held every four years. Lichfield District Council is the local authority for the non-metropolitan district of Lichfield in Staffordshire, England. Since the last boundary changes in 2015, 47 councillors have been elected from 22 wards.

Cotswold District Council in Gloucestershire, England, is elected every four years.

One third of Basingstoke and Deane Borough Council in Hampshire, England is elected each year, followed by one year without election. Since the last boundary changes in 2021, 54 councillors have been elected from 18 wards.

Chiltern District Council in Buckinghamshire, England was elected every four years from 1973 until 2020. Since the last boundary changes in 2003, 40 councillors were elected from 25 wards.

Fenland District Council in Cambridgeshire, England is elected every four years. Since the last boundary changes in 2023, the council has comprised 43 councillors representing 18 wards, with each ward electing one, two or three councillors.

Newark and Sherwood District Council elections are held every four years. Newark and Sherwood District Council is the local authority for the non-metropolitan district of Newark and Sherwood in Nottinghamshire, England. Since the last boundary changes in 2015, 39 councillors have been elected from 21 wards.

Warwick District Council elections are held every four years. Warwick District Council is the local authority for the non-metropolitan district of Warwick in Warwickshire, England. Since the last boundary changes in 2019, 44 councillors have been elected from 17 wards.

<span class="mw-page-title-main">West Lancashire Borough Council elections</span> Local government elections in Lancashire, England

West Lancashire Borough Council elections are generally held three years out of every four, with a third of the council elected each time. West Lancashire Borough Council is the local authority for the non-metropolitan district of West Lancashire in Lancashire, England. Since the last boundary changes in 2023 the council has comprised 45 councillors representing 15 wards, with each ward electing three councillors.

Mansfield District Council elections are held every four years. Mansfield District Council is the local authority for the non-metropolitan district of Mansfield in Nottinghamshire, England. Since 2002 Mansfield has also had a directly elected mayor. Since the last boundary changes in 2023, 36 councillors have been elected from 36 wards.

East Hampshire District Council elections are held every four years to elect councillors to East Hampshire District Council in Hampshire, England. Since the last boundary changes in 2019 the council has comprised 43 councillors representing 31 wards, with each ward electing one, two or three councillors.

<span class="mw-page-title-main">South Ribble Borough Council elections</span> Class of election in the United Kingdom

South Ribble Borough Council elections are held every four years. South Ribble Borough Council is the local authority for the non-metropolitan district of South Ribble in Lancashire, England. Since the last boundary changes in 2015, 50 councillors have been elected from 23 wards. The next borough council elections are due to take place in 2027 as part of the wider 2027 United Kingdom local elections.

King's Lynn and West Norfolk District Council in Norfolk, England is elected every four years. Since the last boundary changes in 2019, 55 councillors have been elected from 35 wards.

Stratford-on-Avon District Council elections are held every four years. Stratford-on-Avon District Council is the local authority for the non-metropolitan district of Stratford-on-Avon in Warwickshire, England. Since the last boundary changes in 2023, 41 councillors have been elected from 39 wards. Prior to 2015 elections were held three years out of every four, with a third of the council elected each time.

Folkestone and Hythe District Council is the local authority for the Folkestone and Hythe District in Kent, England. The district was called Shepway prior to 2018. The council is elected every four years. Since the last boundary changes in 2015, 30 councillors have been elected from 13 wards.

<span class="mw-page-title-main">Ribble Valley Borough Council elections</span> Local government elections in Lancashire, England

Ribble Valley Borough Council elections are held every four years. Ribble Valley Borough Council is the local authority for the non-metropolitan district of Ribble Valley in Lancashire, England. Since the last boundary changes in 2019, 40 councillors have been elected from 26 wards.

References

  1. The District of Tendring (Electoral Arrangements) Order 1975
  2. The Tendring (Electoral Changes) Order 2017
  3. "Lib Dems excel in council polls". guardian.co.uk . 8 March 2002. Retrieved 28 September 2009.
  4. "Tories celebrate Hackney council win". guardian.co.uk . 21 January 2005. Retrieved 28 September 2009.
  5. "Widow wins her husband's council seat". Daily Gazette. 28 September 2009. Retrieved 28 September 2009.
  6. "Labour gain narrow victory over Tories in crucial by-election". Daily Gazette. 8 April 2010. Retrieved 9 April 2010.
  7. "Declaration of results" (PDF). 6 April 2017.
  8. "Local Elections Archive Project — St Pauls Ward". www.andrewteale.me.uk. Retrieved 22 September 2023.
  9. "Local Elections Archive Project — Eastcliff Ward". www.andrewteale.me.uk. Retrieved 22 September 2023.
  10. "Local Elections Archive Project — West Clacton and Jaywick Sands Ward". www.andrewteale.me.uk. Retrieved 22 September 2023.
  11. "Local Elections Archive Project — Bluehouse Ward". www.andrewteale.me.uk. Retrieved 9 November 2024.