| |||||||||||||||||||||||||||||||||
12 of the 33 seats to Harlow District Council 17 seats needed for a majority | |||||||||||||||||||||||||||||||||
---|---|---|---|---|---|---|---|---|---|---|---|---|---|---|---|---|---|---|---|---|---|---|---|---|---|---|---|---|---|---|---|---|---|
| |||||||||||||||||||||||||||||||||
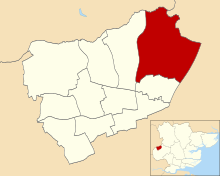
Map showing the results of contested wards in the 2006 Harlow District Council elections. | |||||||||||||||||||||||||||||||||
|
The 2006 Harlow District Council election took place on 4 May 2006 to elect members of Harlow District Council in Essex, England. One third of the council was up for election and the council stayed under no overall control. [1]
After the election, the composition of the council was
Overall turnout at the election was 36.93%. [3]
Party | Seats | Gains | Losses | Net gain/loss | Seats % | Votes % | Votes | +/− | |
---|---|---|---|---|---|---|---|---|---|
Liberal Democrats | 5 | 1 | 0 | 1 | 41.7 | 25.8 | 5,606 | 4.0 | |
Conservative | 4 | 0 | 1 | 1 | 33.3 | 40.2 | 8,737 | 8.5 | |
Labour | 3 | 0 | 0 | 0 | 25.0 | 32.1 | 6,968 | 1.0 | |
Respect | 0 | 0 | 0 | 0 | 0 | 1.0 | 217 | 1.0 | |
Independent | 0 | 0 | 0 | 0 | 0 | 1.0 | 211 | 10.6 |
Party | Candidate | Votes | % | ±% | |
---|---|---|---|---|---|
Liberal Democrats | Eleanor Macy | 995 | 48.7 | +16.6 | |
Labour | Edna Stevens | 693 | 33.9 | -1.0 | |
Conservative | Graham Smith | 357 | 17.5 | -0.3 | |
Majority | 302 | 14.8 | |||
Turnout | 2,045 | 39.1 | -1.1 | ||
Liberal Democrats hold | Swing | ||||
Party | Candidate | Votes | % | ±% | |
---|---|---|---|---|---|
Conservative | Samantha Warren | 1,387 | 73.3 | +11.7 | |
Labour | Kenneth Lawrie | 298 | 15.8 | +0.3 | |
Liberal Democrats | Robert Pailing | 206 | 10.9 | -12.0 | |
Majority | 1,089 | 57.5 | +18.8 | ||
Turnout | 1,891 | 32.0 | +1.5 | ||
Conservative hold | Swing | ||||
Party | Candidate | Votes | % | ±% | |
---|---|---|---|---|---|
Conservative | Joshua Jolles | 960 | 51.1 | +11.1 | |
Labour | Norman Knight | 608 | 32.4 | +0.8 | |
Liberal Democrats | Ian Rideout | 309 | 16.5 | +5.2 | |
Majority | 352 | 18.7 | +10.3 | ||
Turnout | 1,877 | 38.6 | -0.3 | ||
Conservative hold | Swing | ||||
Party | Candidate | Votes | % | ±% | |
---|---|---|---|---|---|
Labour | Margaret Hulcoop | 789 | 40.2 | +1.1 | |
Conservative | Michelle Dorling | 706 | 35.9 | +3.3 | |
Liberal Democrats | Alan Lawrence | 258 | 13.1 | +0.1 | |
Independent | Gary Roberts | 211 | 10.7 | -4.6 | |
Majority | 83 | 4.3 | -2.2 | ||
Turnout | 1,964 | 38.4 | +0.3 | ||
Labour hold | Swing | ||||
Party | Candidate | Votes | % | ±% | |
---|---|---|---|---|---|
Labour | Anthony Durcan | 743 | 43.2 | -3.5 | |
Conservative | Lee Dangerfield | 613 | 35.6 | +4.0 | |
Liberal Democrats | Richard Farnsworth | 365 | 21.2 | -0.5 | |
Majority | 130 | 7.6 | -7.5 | ||
Turnout | 1,721 | 35.5 | -1.7 | ||
Labour hold | Swing | ||||
Party | Candidate | Votes | % | ±% | |
---|---|---|---|---|---|
Liberal Democrats | Robert Thurston | 761 | 37.0 | +8.6 | |
Labour | Michael Danvers | 735 | 35.7 | -4.2 | |
Conservative | Jane Steer | 562 | 27.3 | +8.8 | |
Majority | 26 | 1.3 | |||
Turnout | 2,058 | 43.7 | +0.8 | ||
Liberal Democrats gain from Conservative | Swing | ||||
Party | Candidate | Votes | % | ±% | |
---|---|---|---|---|---|
Liberal Democrats | Linda Pailing | 736 | 42.3 | +8.2 | |
Labour | Feroz Khan | 555 | 31.9 | +7.6 | |
Conservative | Valerie Gough | 448 | 25.8 | +11.7 | |
Majority | 181 | 10.4 | +0.6 | ||
Turnout | 1,739 | 35.5 | -0.9 | ||
Liberal Democrats hold | Swing | ||||
Party | Candidate | Votes | % | ±% | |
---|---|---|---|---|---|
Conservative | Michael Garnett | 1,033 | 56.5 | +18.8 | |
Labour | Paul Sztumpf | 477 | 26.1 | +1.1 | |
Liberal Democrats | Nicholas Macy | 318 | 17.4 | +6.9 | |
Majority | 556 | 30.4 | +19.6 | ||
Turnout | 1,828 | 39.1 | -3.3 | ||
Conservative hold | Swing | ||||
Party | Candidate | Votes | % | |
---|---|---|---|---|
Liberal Democrats | Lorna Spenceley | 629 | ||
Liberal Democrats | Christopher Robins | 595 | ||
Conservative | Clive Souter | 536 | ||
Conservative | Mark Gough | 534 | ||
Labour | Dennis Palmer | 388 | ||
Labour | Jenny Holland | 386 | ||
Turnout | 3,068 | |||
Liberal Democrats hold | ||||
Liberal Democrats hold |
Party | Candidate | Votes | % | ±% | |
---|---|---|---|---|---|
Conservative | Nicholas Churchill | 842 | 54.0 | +8.0 | |
Labour | Suzanne Ennifer | 484 | 31.1 | -5.5 | |
Liberal Democrats | Kuzna Jackson | 232 | 14.9 | -2.4 | |
Majority | 358 | 22.9 | +13.5 | ||
Turnout | 1,558 | 31.0 | -2.5 | ||
Conservative hold | Swing | ||||
Party | Candidate | Votes | % | ±% | |
---|---|---|---|---|---|
Labour | Roy Collyer | 812 | 40.8 | -1.4 | |
Conservative | David Carter | 759 | 38.1 | +8.8 | |
Respect | James Rogers | 217 | 10.9 | +10.9 | |
Liberal Democrats | Paul Westlake | 202 | 10.2 | -2.1 | |
Majority | 53 | 2.7 | -10.2 | ||
Turnout | 1,990 | 40.6 | +5.2 | ||
Labour hold | Swing | ||||
Harlow is a constituency represented in the House of Commons of the UK Parliament since 2010 by Robert Halfon, a Conservative.
One third of Harlow District Council in Essex, England, is elected each year, followed by one year when there is an election to Essex County Council instead. Since the last boundary changes in 2002, 33 councillors have been elected from 11 wards.
The 1999 Harlow District Council election took place on 6 May 1999 to elect members of Harlow District Council in Essex, England. One third of the council was up for election and the Labour party stayed in overall control of the council.
The 2000 Harlow District Council election took place on 4 May 2000 to elect members of Harlow District Council in Essex, England. One third of the council was up for election and the Labour party stayed in overall control of the council.
The 2002 Harlow District Council election took place on 2 May 2002 to elect members of Harlow District Council in Essex, England. The whole council was up for election with boundary changes since the last election in 2000 reducing the number of seats by 9. The Labour party lost overall control of the council to no overall control.
The 2003 Harlow District Council election took place on 1 May 2003 to elect members of Harlow District Council in Essex, England. One third of the council was up for election and the council stayed under no overall control.
The 2004 Harlow District Council election took place on 10 June 2004 to elect members of Harlow District Council in Essex, England. One third of the council was up for election and the council stayed under no overall control.
The 2007 Harlow District Council election took place on 3 May 2007 to elect members of Harlow District Council in Essex, England. One third of the council was up for election and the council stayed under no overall control.
The 2006 Tandridge District Council election took place on 4 May 2006 to elect members of Tandridge District Council in Surrey, England. One third of the council was up for election and the Conservative Party stayed in overall control of the council.
The 2008 Harlow District Council election took place on 1 May 2008 to elect members of Harlow District Council in Essex, England. One third of the council was up for election and the Conservative party gained overall control of the council from no overall control.
The 2012 North Hertfordshire Council election was held on 3 May 2012, at the same time as other local elections across England, Scotland and Wales. Of the 49 seats on North Hertfordshire District Council, 15 were up for election.
The 2011 St Albans City and District Council election took place on 5 May 2011 to elect members of St Albans District Council in Hertfordshire, England. One third of the council was up for election and the Liberal Democrats lost overall control of the council to no overall control.
An election to Essex County Council took place on 2 May 2013 as part of the 2013 United Kingdom local elections. 75 councillors were elected from 70 electoral divisions, which returned either one or two county councillors each by first-past-the-post voting for a four-year term of office. The electoral divisions were the same as those used at the previous election in 2009. No elections were held in Thurrock or Southend-on-Sea, which are unitary authorities outside the area covered by the County Council.
The 2014 North Hertfordshire Council election was held on 22 May 2014, at the same time as other local elections and the European Parliament election. Of the 49 seats on North Hertfordshire District Council, 18 were up for election.
The 2010 Harlow District Council election took place on 6 May 2010 to elect members of Harlow District Council in Essex, England. One third of the council was up for election and the Conservative party stayed in overall control of the council.
The 2011 Harlow District Council election took place on 5 May 2011 to elect members of Harlow District Council in Essex, England. One third of the council was up for election and the Conservative Party stayed in overall control of the council.
The 2012 Harlow District Council election took place on 3 May 2012 to elect members of Harlow District Council in Essex, England. One third of the council was up for election and the Labour Party gained overall control of the council from the Conservative Party.
The 2014 Harlow District Council election took place on 22 May 2014 to elect members of Harlow District Council in Essex, England. One third of the council was up for election and the Labour Party stayed in overall control of the council.
The 2015 Harlow District Council election took place on 7 May 2015 to elect members of Harlow District Council in Essex, England. One third of the council was up for election and Labour Party councillors increased their control of the council as the governing group, gaining one councillor and suffering no losses.
The Ashfield Independents are a political party in the Ashfield District in Nottinghamshire, England.