| |||||||||||||||||||||||||||||||||||||
19 of the 57 seats to Plymouth City Council 29 seats needed for a majority | |||||||||||||||||||||||||||||||||||||
---|---|---|---|---|---|---|---|---|---|---|---|---|---|---|---|---|---|---|---|---|---|---|---|---|---|---|---|---|---|---|---|---|---|---|---|---|---|
| |||||||||||||||||||||||||||||||||||||
Map showing the results of contested wards in the 2006 Plymouth City Council elections. | |||||||||||||||||||||||||||||||||||||
|
The 2006 Plymouth City Council election was held on 4 May 2006 to elect members of Plymouth City Council in England. One third of the council was up for election on the day, with an additional seat in Southway Ward remaining vacant until a by-election on 22 June. After the election, Labour were reduced to 28 out of the 56 filled seats, thus temporarily losing control of the council to No Overall Control. [4] However, Labour won the Southway by-election on 22 June, thus restoring their overall control of the council. [5]
Party | Seats | Gains | Losses | Net gain/loss | Seats % | Votes % | Votes | +/− | |
---|---|---|---|---|---|---|---|---|---|
Conservative | 12 | 6 | 0 | 6 | 63.2 | 39.6% | 24,088 | ||
Labour | 7 | 0 | 5 | 5 | 36.8 | 27.9% | 16,988 | ||
Liberal Democrats | 0 | 0 | 1 | 1 | 0.0 | 19.5% | 11,864 | ||
UKIP | 0 | 0 | 0 | 0.0 | 6.3% | 3,835 | |||
Green | 0 | 0 | 0 | 0.0 | 4.0% | 2,422 | |||
Independent | 0 | 0 | 0 | 0.0 | 2.5% | 1,495 | |||
Respect | 0 | 0 | 0 | 0.0 | 0.2% | 112 | |||
Total | 19 | 60,804 |
Party | Candidate | Votes | % | |
---|---|---|---|---|
Conservative | Grant Monahan | 1,260 | 37.8% | |
Labour | Bill Coleman | 1,052 | 31.5% | |
Liberal Democrats | Janet Crocker | 541 | 16.2% | |
UKIP | Carole Bragg | 483 | 14.5% | |
Majority | 208 | 6.2% | ||
Turnout | 3,336 | 35.7% | ||
Conservative gain from Labour | ||||
Party | Candidate | Votes | % | |
---|---|---|---|---|
Conservative | Ted Fry | 1,830 | 51.3% | |
Liberal Democrats | Steven Smith | 840 | 23.6% | |
Labour | Thomas Taylor | 549 | 15.4% | |
Green | Nicola Bannon | 345 | 9.7% | |
Majority | 990 | 27.8% | ||
Turnout | 3,564 | 38.5% | ||
Conservative hold |
Party | Candidate | Votes | % | |
---|---|---|---|---|
Labour | William Stevens | 968 | 34.5% | |
Conservative | Jim Bell | 802 | 28.6% | |
Liberal Democrats | Matthew Radmore | 396 | 14.1% | |
Independent | William Goffin | 363 | 12.9% | |
Green | Wendy Miller | 163 | 5.8% | |
Respect | Andrew Symons | 112 | 4.0% | |
Majority | 166 | 5.9% | ||
Turnout | 2,804 | 29.3% | ||
Labour hold |
Party | Candidate | Votes | % | |
---|---|---|---|---|
Conservative | Steven Ricketts | 488 | 30.4% | |
Liberal Democrats | Christina MacCullie | 361 | 22.5% | |
Labour | Mark Coker | 323 | 20.1% | |
Independent | David Santillo | 317 | 19.8% | |
Green | Colin Bannon | 116 | 7.2% | |
Majority | 127 | 7.9% | ||
Turnout | 1,605 | 26.5% | ||
Conservative gain from Liberal Democrats | ||||
Party | Candidate | Votes | % | |
---|---|---|---|---|
Labour | Andrew Kerswell | 1,149 | 37.9% | |
Conservative | Mary Orchard | 885 | 29.2% | |
Liberal Democrats | Lilli Miller | 715 | 23.6% | |
Green | Tean Mitchell | 284 | 9.4% | |
Majority | 264 | 8.7% | ||
Turnout | 3,033 | 31.8% | ||
Labour hold |
Party | Candidate | Votes | % | |
---|---|---|---|---|
Conservative | Ian Bowyer | 1,624 | 39.8% | |
Liberal Democrats | Lee Finn | 1,037 | 25.4% | |
Labour | Debbie Roche | 921 | 22.6% | |
UKIP | Malcolm Hipwell | 355 | 8.7% | |
Green | Colin Trier | 139 | 3.4% | |
Majority | 587 | 14.4% | ||
Turnout | 4,076 | 41.1% | ||
Conservative gain from Labour | ||||
Party | Candidate | Votes | % | |
---|---|---|---|---|
Labour | Ian Gordon | 1,233 | 39.5% | |
Conservative | Lynda Bowyer | 753 | 24.2% | |
Liberal Democrats | Stephen Goldthorp | 498 | 16.0% | |
UKIP | Julia Langmaid | 479 | 15.4% | |
Green | Melanie Roach | 155 | 5.0% | |
Majority | 480 | 15.4% | ||
Turnout | 3,118 | 32.4% | ||
Labour hold |
Party | Candidate | Votes | % | |
---|---|---|---|---|
Labour | Pauline Purnell | 1,191 | 38.7% | |
Conservative | Eileen Willey | 666 | 21.7% | |
UKIP | Michael Parr | 626 | 20.4% | |
Liberal Democrats | Gillian Hirst | 593 | 19.3% | |
Majority | 525 | 17.1% | ||
Turnout | 3,076 | 31.0% | ||
Labour hold |
Party | Candidate | Votes | % | |
---|---|---|---|---|
Conservative | Michael Foster | 1,320 | 40.3% | |
Labour | Michael Fox | 1,214 | 37.1% | |
Liberal Democrats | Geoffrey Shepherdson | 740 | 22.6% | |
Majority | 106 | 3.2% | ||
Turnout | 3,274 | 35.3% | ||
Conservative gain from Labour | ||||
Party | Candidate | Votes | % | |
---|---|---|---|---|
Conservative | Martin Leaves | 2,219 | 54.4% | |
Liberal Democrats | Deborah Earl | 861 | 21.1% | |
Labour | Anthony Portman | 617 | 15.1% | |
Green | Don Allen | 381 | 9.3% | |
Majority | 1,358 | 33.3% | ||
Turnout | 4,078 | 41.1% | ||
Labour hold |
Party | Candidate | Votes | % | |
---|---|---|---|---|
Conservative | Glenn Jordan | 964 | 55.5% | |
Liberal Democrats | Robert McVicar | 457 | 26.3% | |
Labour | Ross Burns | 315 | 18.1% | |
Majority | 507 | 29.2% | ||
Turnout | 1,736 | 28.9% | ||
Conservative hold |
Party | Candidate | Votes | % | |
---|---|---|---|---|
Conservative | David James | 1,862 | 48.0% | |
Liberal Democrats | Paul Rowe | 928 | 23.9% | |
UKIP | James Sanderson | 548 | 14.1% | |
Labour | John Sewell | 538 | 13.9% | |
Majority | 934 | 24.1% | ||
Turnout | 3,876 | 40.3% | ||
Conservative hold |
Party | Candidate | Votes | % | |
---|---|---|---|---|
Conservative | Vivien Pengelly | 2,434 | 62.7% | |
Labour | Simon Barrett | 543 | 14.0% | |
Liberal Democrats | Steven Turner | 539 | 13.9% | |
UKIP | Hugh Williams | 366 | 9.4% | |
Majority | 1,891 | 48.7% | ||
Turnout | 3,882 | 39.9% | ||
Conservative hold |
Party | Candidate | Votes | % | |
---|---|---|---|---|
Conservative | Wendy Foster | 1,801 | 48.0% | |
Independent | Roger Dodd | 656 | 17.5% | |
Liberal Democrats | Justin Robbins | 453 | 12.1% | |
Labour | John Davey | 442 | 11.8% | |
UKIP | Alan Skuse | 401 | 10.7% | |
Majority | 1,145 | 30.5% | ||
Turnout | 3,753 | 39.8% | ||
Conservative hold |
Party | Candidate | Votes | % | |
---|---|---|---|---|
Labour | Sallyanne Letcher | 1,178 | 40.0% | |
Conservative | Brian Roberts | 681 | 23.1% | |
UKIP | Thomas Williams | 577 | 19.6% | |
Liberal Democrats | Raymond McSweeney | 506 | 17.2% | |
Majority | 497 | 16.9% | ||
Turnout | 2,942 | 31.7% | ||
Labour hold |
Party | Candidate | Votes | % | |
---|---|---|---|---|
Labour | Susan McDonald | 1,058 | 37.7% | |
Conservative | Sally Stephens | 928 | 33.0% | |
Liberal Democrats | Hugh Janes | 460 | 16.4% | |
Green | Clare O'Neill | 205 | 7.3% | |
Independent | Jo Jo | 159 | 5.7% | |
Majority | 130 | 4.6% | ||
Turnout | 2,810 | 30.8% | ||
Labour hold |
Party | Candidate | Votes | % | |
---|---|---|---|---|
Conservative | Thomas Browne | 1,400 | 40.2% | |
Labour | James Kirk | 1,371 | 39.4% | |
Liberal Democrats | Terrance O'Connor | 712 | 20.4% | |
Majority | 29 | 0.8% | ||
Turnout | 3,483 | 37.4% | ||
Conservative gain from Labour | ||||
Party | Candidate | Votes | % | |
---|---|---|---|---|
Conservative | Jill Dolan | 1,358 | 39.0% | |
Labour | Mark Lowry | 1,232 | 35.4% | |
Liberal Democrats | Emma Swann | 552 | 15.9% | |
Green | Hannah Ross | 338 | 9.7% | |
Majority | 126 | 3.6% | ||
Turnout | 3,480 | 36.4% | ||
Conservative gain from Labour | ||||
Party | Candidate | Votes | % | |
---|---|---|---|---|
Labour | Mary Aspinall | 1,094 | 38.0% | |
Conservative | Edmund Shillabeer | 813 | 28.2% | |
Liberal Democrats | Peter York | 675 | 23.5% | |
Green | Louise Parker | 296 | 10.3% | |
Majority | 281 | 9.8% | ||
Turnout | 2,878 | 30.4% | ||
Labour hold |
Local government elections took place in England (only) on Thursday 4 May 2006. Polling stations were open between 7:00 and 22:00.
Plymouth is a unitary authority in Devon, England. Until 1 April 1998 it was a non-metropolitan district.
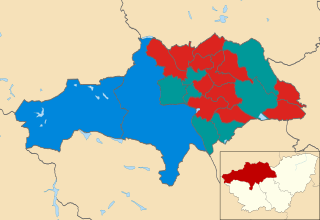
The 2007 Thurrock Council election took place on 3 May 2007 to elect members of Thurrock Council in Essex, England. One third of the council was up for election and the Conservative party lost overall control of the council to no overall control.
The 2008 Barnsley Metropolitan Borough Council election took place on 1 May 2008 to elect members of Barnsley Metropolitan Borough Council in South Yorkshire, England. One third of the council, alongside an additional vacancy in Old Town was up for election. Prior to the election the defending councillor in Penistone West, having earlier defected from Conservative to the Barnsley Independent Group, fought the election as an Independent. The Labour party stayed in overall control of the council.
The 2006 Derby City Council election took place on 4 May 2006 to elect members of Derby City Council in England. One third of the council was up for election and the Labour party lost their majority on the council to no overall control.
The 2006 Halton Borough Council election took place on 4 May 2006 to elect members of Halton Unitary Council in Cheshire, England. One third of the council was up for election and the Labour party stayed in overall control of the council.
The 2000 Southampton Council election took place on 4 May 2000 to elect members of Southampton Unitary Council in Hampshire, England. One third of the council was up for election and the Labour party lost overall control of the council to no overall control.
Local elections were held in the United Kingdom on 3 May 1979. The results provided some source of comfort to the Labour Party (UK), who recovered some lost ground from local election reversals in previous years, despite losing the general election to the Conservative Party on the same day.
The 2006 Sunderland Council election took place on 4 May 2006 to elect members of Sunderland City Council in Tyne and Wear, England. One third of the Council was up for election and the Labour party stayed in overall control.
The 2002 Barnsley Metropolitan Borough Council election took place on 2 May 2002 to elect members of Barnsley Metropolitan Borough Council in South Yorkshire, England. One third of the council was up for election and the Labour party stayed in overall control of the council.
The 2006 Barnsley Metropolitan Borough Council election took place on 4 May 2006 to elect members of Barnsley Metropolitan Borough Council in South Yorkshire, England. One third of the council was up for election, with an extra vacancy in Penistone East caused by a resignation, and the Labour party stayed in overall control of the council.
The 2007 Barnsley Metropolitan Borough Council election took place on 3 May 2007 to elect members of Barnsley Metropolitan Borough Council in South Yorkshire, England. One third of the council was up for election and the Labour party stayed in overall control of the council.
The 2008 Cardiff Council election was held on 1 May, along with the 2008 Welsh local elections. All 75 seats of Cardiff Council were contested, with it remaining in no overall control. It was preceded by the 2004 election and followed by the 2012 election
The 2012 Exeter City Council election took place on 3 May 2012, to elect members of Exeter City Council in Devon, England. The election was held concurrently with other local elections in England. One third of the council was up for election; the seats up for election were last contested in 2008. The Labour Party gained overall control of the council, which had been under no overall control since 2003. The Liberal Party was wiped off the council.
The 2014 Plymouth City Council election took place on 22 May 2014 to elect members of Plymouth City Council in England. This was on the same day as other local elections. The election was won by the Labour Party, who maintained their overall majority. The UK Independence Party gained representation on the council for the first time, and this was the only election in which the party won seats in Plymouth.
The 2015 United Kingdom local elections were held on Thursday 7 May 2015, the same day as the general election for the House of Commons of the United Kingdom.
The 2015 Plymouth City Council election took place on 7 May 2015 to elect members of Plymouth City Council in England.
The 2007 West Oxfordshire District Council election took place on 3 May 2007 to elect members of West Oxfordshire District Council in Oxfordshire, England. One third of the council was up for election and the Conservative party stayed in overall control of the council.
The 2018 Plymouth City Council election took place on 3 May 2018 to elect members of Plymouth City Council in England. The election was won by the Labour Party, who gained enough seats to achieve an overall majority and took control of the council.