The 2015 Torridge District Council election took place on 7 May 2015 to elect members of Torridge District Council in England. [1] This was on the same day as other local elections and the 2015 UK General Election hence turnout was much higher than usual Local Elections.
2019 Torridge District Council election | ||||||||||
---|---|---|---|---|---|---|---|---|---|---|
Party | Candidates | Seats | Gains | Losses | Net gain/loss | Seats % | Votes % | Votes | +/− | |
Conservative | 24 | 19 | 4 | 3 | 1 | 52.8 | 34.2 | 13,020 | –3.6 | |
Independent | 15 | 6 | 1 | 5 | 4 | 16.7 | 20.6 | 7,854 | +1.5 | |
Green | 14 | 2 | 1 | 0 | 1 | 5.6 | 16.0 | 6,085 | +9.7 | |
UKIP | 11 | 7 | 7 | 0 | 7 | 19.4 | 14.2 | 5,417 | +10.0 | |
Labour | 8 | 1 | 0 | 0 | 2.8 | 8.9 | 3,386 | -0.1 | ||
Liberal Democrats | 4 | 1 | 0 | 5 | 5 | 2.8 | 6.0 | 2,287 | -17.6 |
Party | Candidate | Votes | % | |
---|---|---|---|---|
Conservative | Andrew Eastman | 791 | ||
UKIP | Kenneth Davis | 548 | ||
Green | Peter Hames | 426 | ||
Independent | Barry Edwards | 382 | ||
Conservative | James Jackson | 314 | ||
Turnout | 70.5 | |||
Conservative hold | ||||
UKIP gain from Independent |
Party | Candidate | Votes | % | |
---|---|---|---|---|
Conservative | Mervyn Langmead | 1378 | ||
UKIP | Sam Robinson | 935 | ||
UKIP | Gaston Dezart | 845 | ||
Labour | Ruth Craigie | 709 | ||
Independent | Pauline Davies | 569 | ||
Green | Stephen Pagett | 561 | ||
Turnout | 61.11 | |||
Conservative hold | ||||
UKIP gain from Conservative | ||||
UKIP gain from Independent |
Party | Candidate | Votes | % | |
---|---|---|---|---|
Green | Peter Christie | 1313 | ||
Conservative | Dermot McGeough | 928 | ||
Liberal Democrats | Trevor Johns | 843 | ||
Conservative | Philip Pester | 763 | ||
Independent | Douglas Bushby | 634 | ||
Labour | Anne Brenton | 616 | ||
Labour | Michael James | 536 | ||
Turnout | 65.33 | |||
Green hold | ||||
Conservative hold | ||||
Liberal Democrats hold |
Party | Candidate | Votes | % | |
---|---|---|---|---|
Conservative | Simon Inch | 947 | ||
Conservative | Anthony Inch | 932 | ||
Labour | David Brenton | 801 | ||
Liberal Democrats | Robert Wootton | 798 | ||
Labour | Joseph Day | 636 | ||
Labour | James Craigie | 594 | ||
Turnout | 57.75 | |||
Conservative hold | ||||
Labour hold |
Party | Candidate | Votes | % | |
---|---|---|---|---|
Conservative | Peter Watson | Uncontested | ||
Conservative hold |
Party | Candidate | Votes | % | |
---|---|---|---|---|
Independent | Richard Wiseman | 618 | ||
Green | William Douglas-Mann | 333 | ||
Turnout | 77.15 | |||
Independent hold |
Party | Candidate | Votes | % | |
---|---|---|---|---|
UKIP | Robin Julian | Uncontested | ||
Turnout | ||||
UKIP gain from Liberal Democrats |
Party | Candidate | Votes | % | |
---|---|---|---|---|
Conservative | Philip Hackett | 703 | ||
Independent | Gloria Tabor | 368 | ||
Turnout | 82.17 | |||
Conservative hold |
Party | Candidate | Votes | % | |
---|---|---|---|---|
Conservative | Zygmunt Gregorek | 694 | ||
Green | Jonathan Middleton | 333 | ||
Turnout | 74.98 | |||
Conservative hold |
Party | Candidate | Votes | % | |
---|---|---|---|---|
Independent | Anna Dart | 1114 | ||
UKIP | Alan Whittle | 598 | ||
Green | Jill Maynard | 567 | ||
Turnout | 71.9 | |||
Independent gain from Liberal Democrats | ||||
UKIP gain from Liberal Democrats |
Party | Candidate | Votes | % | |
---|---|---|---|---|
Conservative | Ian Parker | 1194 | ||
Conservative | Kenith Carroll | 816 | ||
UKIP | Brian Alchorn | 629 | ||
Liberal Democrats | Howard Ratledge | 464 | ||
Green | John Sanders | 371 | ||
Turnout | 69.44 | |||
Conservative hold | ||||
Conservative gain from Liberal Democrats |
Party | Candidate | Votes | % | |
---|---|---|---|---|
Conservative | Alison Boyle | 656 | ||
UKIP | Derek Sargent | 299 | ||
Turnout | 74.29 | |||
Conservative hold |
Party | Candidate | Votes | % | |
---|---|---|---|---|
Independent | Phil Pennington | 410 | ||
Conservative | Benjamin Parry | 346 | ||
Green | Ruth Funnell | 192 | ||
Turnout | 77.38 | |||
Independent hold |
Party | Candidate | Votes | % | |
---|---|---|---|---|
Conservative | Jane Whittaker | 1,285 | ||
Conservative | John Himan | 1,162 | ||
UKIP | Richard Hancock | 1,062 | ||
Independent | Richard Miller | 945 | ||
Labour | Irene Rowe | 764 | ||
Turnout | 69.86 | |||
Conservative hold | ||||
UKIP gain from Conservative |
Party | Candidate | Votes | % | |
---|---|---|---|---|
Conservative | John Langton-Lockton | 515 | ||
UKIP | Christopher Leather | 505 | ||
Turnout | 74.14 | |||
Conservative gain from Independent |
Party | Candidate | Votes | % | |
---|---|---|---|---|
Conservative | David Hurley | 900 | ||
Green | Gillian Douglas-Mann | 290 | ||
Turnout | 76.42 | |||
Conservative hold |
Party | Candidate | Votes | % | |
---|---|---|---|---|
Independent | Kenneth James | Uncontested | ||
Independent hold |
Party | Candidate | Votes | % | |
---|---|---|---|---|
Conservative | Rosemary Lock | 705 | ||
Green | Colin Jones | 335 | ||
Turnout | 76.52 | |||
Conservative hold |
Party | Candidate | Votes | % | |
---|---|---|---|---|
Independent | Margaret Brown | 986 | ||
Green | Cathrine Simmons | 901 | ||
UKIP | Roger Darch | 841 | ||
Conservative | Sharon Claydon | 786 | ||
Conservative | Harold Martin | 736 | ||
UKIP | John Pitts | 659 | ||
Green | Keith Funnell | 627 | ||
Labour | Penelope Hewitt | 496 | ||
Turnout | 64.65 | |||
Independent hold | ||||
Green gain from Conservative | ||||
UKIP gain from Liberal Democrats |
Party | Candidate | Votes | % | |
---|---|---|---|---|
Conservative | James Morrish | Uncontested | ||
Conservative hold |
Party | Candidate | Votes | % | |
---|---|---|---|---|
Independent | Robert Hicks | 572 | ||
Independent | James Lowe | 427 | ||
Turnout | 75.82 | |||
Independent hold |
Party | Candidate | Votes | % | |
---|---|---|---|---|
Conservative | Peter le Maistre | 528 | ||
Independent | Roger Tisdale | 473 | ||
Green | Christopher Jordan | 311 | ||
Turnout | 71.20 | |||
Conservative gain from Independent |
Party | Candidate | Votes | % | |
---|---|---|---|---|
Conservative | Betty Boundy | 664 | ||
Independent | Gail Flockhart | 356 | ||
Liberal Democrats | John Kane | 182 | ||
Green | Jacob Glanville | 152 | ||
Turnout | 77.97 | |||
Conservative gain from Independent |
Party | Candidate | Votes | % | ±% | |
---|---|---|---|---|---|
Liberal Democrats | Jane Leaper | 973 | 57.5 | +57.5 | |
Green | John Sanders | 720 | 42.5 | +17.6 | |
Majority | 253 | 14.9 | |||
Turnout | 1,693 | ||||
Liberal Democrats gain from UKIP | Swing | ||||
Party | Candidate | Votes | % | ±% | |
---|---|---|---|---|---|
Liberal Democrats | Cheryl Cottle-Hunkin | 701 | 60.2 | +60.2 | |
Independent | Di Davey | 180 | 15.5 | +15.5 | |
Conservative | Harold Martin | 159 | 13.6 | -6.0 | |
Green | Sue Clarke | 76 | 6.5 | -16.0 | |
UKIP | John Pitts | 49 | 4.2 | -16.8 | |
Majority | 521 | 44.7 | |||
Turnout | 1,165 | ||||
Liberal Democrats gain from UKIP | Swing | ||||
Party | Candidate | Votes | % | ±% | |
---|---|---|---|---|---|
Independent | Nick Laws | 321 | 46.9 | +46.9 | |
Conservative | Roger Levick | 128 | 18.7 | -21.5 | |
UKIP | Derek Sargent | 90 | 13.2 | +13.2 | |
Liberal Democrats | Stephen Potts | 63 | 9.2 | +9.2 | |
Independent | Barry Mason | 47 | 6.9 | +6.9 | |
Labour | Stan Coats | 35 | 5.1 | +5.1 | |
Majority | 193 | 28.2 | |||
Turnout | 684 | ||||
Independent gain from Conservative | Swing | ||||
Party | Candidate | Votes | % | ±% | |
---|---|---|---|---|---|
Conservative | James Hellyer | 383 | 30.9 | -2.3 | |
Labour | Anne Brenton | 273 | 22.0 | +4.9 | |
Liberal Democrats | Jamie McKenzie | 236 | 19.0 | +19.0 | |
Independent | Jude Gubb | 231 | 18.6 | +18.6 | |
Green | Gregory de Freyne-Martin | 62 | 5.0 | -8.5 | |
Independent | Pauline Davies | 56 | 4.5 | -9.2 | |
Majority | 110 | 8.9 | |||
Turnout | 1,241 | ||||
Conservative gain from UKIP | Swing | ||||
Party | Candidate | Votes | % | ±% | |
---|---|---|---|---|---|
Conservative | Richard Boughton | 408 | 58.5 | +58.5 | |
Liberal Democrats | Martin Hill | 204 | 29.3 | -28.2 | |
Green | John Sanders | 85 | 12.2 | -30.3 | |
Majority | 204 | 29.3 | |||
Turnout | 697 | ||||
Conservative gain from Liberal Democrats | Swing | ||||
Party | Candidate | Votes | % | ±% | |
---|---|---|---|---|---|
Conservative | Jon Hutchings | 698 | 56.4 | +11.5 | |
Independent | John Allen | 314 | 25.4 | +25.4 | |
Liberal Democrats | Christopher Styles-Power | 151 | 12.2 | -5.3 | |
Labour | Tom Hammett | 75 | 6.1 | +6.1 | |
Majority | 384 | 31.0 | |||
Turnout | 1,238 | ||||
Conservative hold | Swing | ||||
Torridge is a local government district in north-west Devon, England. Its council is based in the town of Bideford. The district also includes the towns of Great Torrington, Holsworthy and Northam, along with numerous villages and surrounding rural areas. The island of Lundy forms part of the district. The district is named after the River Torridge.
Broadland District Council in Norfolk, England is elected every four years. Up until 2004 one third of the Council was elected each year, followed by one year without election. Since the last boundary changes in 2004, 47 councillors have been elected from 27 wards.
Lichfield District Council elections are held every four years. Lichfield District Council is the local authority for the non-metropolitan district of Lichfield in Staffordshire, England. Since the last boundary changes in 2015, 47 councillors have been elected from 22 wards.
Lewes District Council in East Sussex, England is elected every four years. Since the last boundary changes in 2019, 41 councillors are elected from 21 wards.
Buckland Brewer is a village and civil parish in the Torridge district of Devon, England, 4.7 miles south of Bideford. Historically the parish formed part of Shebbear Hundred. According to the 2001 census it had a population of 777, increasing to 794 at the 2011 census The village is part of Waldon electoral ward. The population for this at the same census was 1,679.
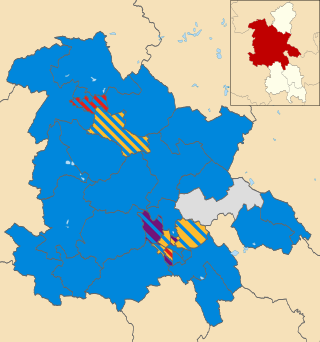
Aylesbury Vale District Council was the council for the non-metropolitan district of Aylesbury Vale in Buckinghamshire, England, which existed as a local government area from 1974 to 2020. The council was elected every four years from 1973 until 2020. At the time of its abolition, the council had 59 councillors, elected from 33 wards.
Blaby District Council elections are held every four years. Blaby District Council is the local authority for the non-metropolitan district of Blaby in Leicestershire, England. Since the last boundary changes in 2023 the council has comprised 36 councillors representing 17 wards, with each ward electing one, two or three councillors.
Charnwood Borough Council elections are held every four years. Charnwood Borough Council is the local authority for the non-metropolitan district of Charnwood in Leicestershire, England. Since the last boundary changes in 2023 the council has comprised 52 councillors, representing 24 wards, with each ward electing one, two or three councillors.
East Devon District Council is the local authority for East Devon in England. The council is elected every four years. Sixty councillors are elected from 30 wards since the last boundary changes in 2019.
West Berkshire Council is the local authority for West Berkshire, a unitary authority in Berkshire, England. Until 1 April 1998 it was a non-metropolitan district called Newbury.
South Ribble Borough Council elections are held every four years. South Ribble Borough Council is the local authority for the non-metropolitan district of South Ribble in Lancashire, England. Since the last boundary changes in 2015, 50 councillors have been elected from 23 wards. The next borough council elections are due to take place in 2027 as part of the wider 2027 United Kingdom local elections.
North Norfolk District Council in Norfolk, England is elected every four years.
Mid Devon District Council elections are held every four years to elect Mid Devon District Council in Devon, England. Since the last boundary changes in 2023 the council has comprised 42 councillors, representing 22 wards, with each ward electing one, two or three councillors.
Tonbridge and Malling Borough Council is the local authority for the borough of Tonbridge and Malling in Kent, United Kingdom. The council is elected every four years. Since the last boundary changes in 2023, 44 councillors have been elected from 19 wards.
West Devon Borough Council in Devon, England is elected every four years. Since the last boundary changes in 2015, 31 councillors have been elected from 18 wards.
Teignbridge District Council in Devon, England is elected every four years. Since the last boundary changes in 2019, 47 councillors have been elected from 24 wards.
Thanet District Council elections are held every four years to elect Thanet District Council in Kent, England. Since the last boundary changes in 2003 the council has comprised 56 councillors representing 23 wards.
The 2007 Torridge District Council election took place on 3 May 2007 to elect members of Torridge District Council in Devon, England. The whole council was up for election and independents lost overall control of the council to no overall control.
The 2011 Torridge District Council election took place on 5 May 2011 to elect members of Torridge District Council in Devon, England. The whole council was up for election and the council stayed under no overall control.